Dashboard Gauge 3: 2 Ways to Map a Custom Background Image in Tableau
To this point in the series, I’ve shown you my favorite type of gauge with bullet graphs and a way to round gauges when your primary objective is to track progress to 100%. In the next example, I will show you how to make a custom gauge in Tableau with any image. I learned this trick from Lindsey Poulter in her visualization, Best States to Raise Children. Downloading Tableau Public visualizations and reverse engineering them is one of the best ways to pick up new techniques.
In the visualization, Lindsey draws an arrow over a custom sequential color palette to communicate performance across five different categories. In this post, I’ll show you how to make a gauge out of a custom background image for a company that is interested in viewing individual responses to a Net Promoter Score (NPS) survey. The following approach is useful any time you want to customize how a gauge looks with the image of your choosing.
This is the third in a five-part series on dashboard gauges in Tableau. For future updates, subscribe to our mailing list.
Watch the Related Video with Playfair+
Introduction + use case
By the end of this post, you will be able to make a gauge using any background image. Here is an example showing a response to an NPS survey on a custom image showing rounded shapes that are colored to indicate whether the respondent is a ‘Detractor’ (response between 0-6), ‘Passive’ (response of 7 or 8), or ‘Promoter’ (response of 9 or 10).

Typically, NPS scores are calculated by taking the percentage of Detractors and subtracting that number by the percentage of Promoters, but for this illustration, let’s pretend we are wanting to look at individual responses. Again, you can apply the following techniques to any use case where you are wanting to create a custom gauge using an image.
Approach 1 – How to create a custom gauge in Tableau by mapping a custom background image
For the first technique, we will map the custom gauge pictured in the introduction using the traditional way of mapping a background image in Tableau. To lay the framework for our custom gauge, we will need two measures:
(1) A placeholder field which will create the y-axis. For this arbitrary placeholder measure, I always create a calculated field with the formula MIN(0):

(2) The metric we want to show up on the custom gauge. This will be plotted on the x-axis, or Columns Shelf.
I can show you both measures using the Sample – Superstore dataset because the first is a calculated field that I can create in any dataset, and I will parameterize the second to represent different NPS responses. Parameters are not the focus of this post, but you can learn more about them in my introduction to Tableau parameters post / video. Essentially what I did to create the second measure is set up a parameter with a data type of Integer, allowable values of 0 – 10, then created a calculated field that contained nothing but the parameter value. I’m doing this purely to show you an example using the sample data, but the second measure will be in your dataset and you don’t have to worry about these steps.
![]()
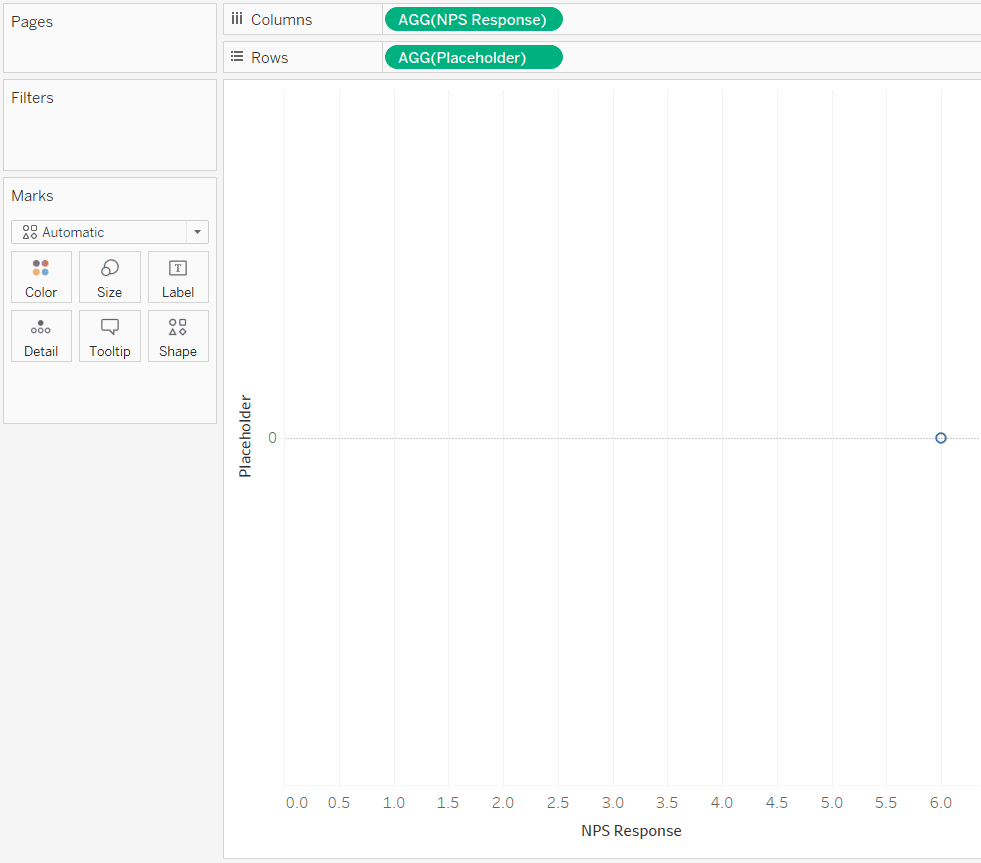
Now start the view by placing the Placeholder measure onto the Rows Shelf, and the measure you are analyzing onto the Columns Shelf. By default, this creates a scatter plot with one data point on the view:
To map a custom background image in Tableau, navigate to Map > Background Image > [Your Data Source]:

After clicking “Add Image”, this will open a dialog box where you can find the custom image on your computer and map the x and y axes. The measure selected and values for the ‘X Field’ will determine how far the custom image spans horizontally; the measure selected and values for the ‘Y Field’ will determine how far the custom image spans vertically.
Being that I want my image to go left to right for values between 0 and 10, I will set those values for my X Field. The values for Y are more arbitrary but can be used to determine how much vertical space the image represents. I’ll set it to -1 to 0 for now, but later will fix my y-axis to span from -1 to 1. I’ll do that because the NPS measure will always be plotted vertically at the value of 0, so by making the image start at -1, the mark will be displayed at the top of the gauge. Later when I fix the y-axis to span from -1 to 1, the gauge will fill up only half the vertical space (-1 to 0 will have the image, 0 to 1 will be blank). Here are my final settings:

After clicking OK twice to close the settings, you will see the custom image starting to come into focus:

Next, we need to fix both the y-axis and x-axis so they only span the values of the custom background image. You can fix axes by right-clicking on them and choosing “Edit Axis”. Then on the General tab, choose Fixed Range and type in your values. I will fix the y-axis to span from -1 to 1 as mentioned earlier, and my x-axis from 0 to 10, as those are all the possible NPS responses.

All that’s left to do from this point is formatting! Here’s how the view looks after hiding all lines, hiding both headers, choosing a triangle shape for the mark, making the view less wide, and adding the NPS score to the Label Marks Card.

Since I parameterized the NPS responses for this illustration, I can show you how the view looks if I change the current value of the NPS parameter to 8 instead of 6.

Regardless of what response is chosen to populate the value on the x-axis, the slider will move to the appropriate place on top of the custom gauge in the background! The colors help the viewer instantly identify what segment the respondent falls in and the magnitude of their brand affinity. If you lined several of these gauges up on a dashboard, this could also be used to compare respondents to each other to see at glance who are the biggest Promoters or Detractors across different areas of the business.
Approach 2 – How to use transparent sheets to create custom gauges in Tableau
As of Tableau version 2018.3, you can make the backgrounds of sheets transparent. This unlocks even more design flexibility in Tableau, including the option to float a sheet over an image of a custom gauge. If your company has upgraded, you can take advantage of this technique which requires fewer steps than the first approach. The tradeoff is that it’s not quite as precise because the background image is not directly tied to the values on the view; you are simply lining up a sheet on top of an image.
To alleviate this drawback some, you still want to ensure you have fixed the range of the x-axis. This way if you make the worksheet and custom background image the same number of pixels wide, they will be on the same scale.
To make a dashboard sheet transparent, right-click anywhere on the view and choose “Format…”. For the shading, make sure the worksheet shading is set to None.

To create a custom gauge using transparent sheets, create a new dashboard and add an Image object that contains your custom gauge image. This works best when the objects are floating because you can precisely size them to ensure everything lines up on the same scale.

Next, float the transparent sheet over the Image object.

As you can see, they’re not yet lined up because the transparent sheet and Image object have different widths and x coordinates.

You can change these settings of a floating object by navigating to the Layout pane. After ensuring both the transparent sheet with the NPS response and the custom gauge image are 500 pixels wide and start at the x-position of 224, the gauge lines up again!

Thanks for reading,
– Ryan


Written By
Ryan Sleeper
Related Content
3 Creative Ways to Use Transparent Sheets to Add Context in Tableau
As of Tableau Desktop 2018.3, authors can make worksheet backgrounds transparent. This means you can float multiple worksheets on top…
3 Ways to Make Magnificent Maps in Tableau
Maps are one of the most effective chart types in Tableau and are also among the easiest chart types to…

Ryan Sleeper
Create and Encode Custom Shapes Using Any Image We’ll have some fun mapping custom polygons on a baseball stadium. You’ll…