Data’s Rosetta Stone

What is Visual Analytics?

Playfair Data is the first consulting agency focused exclusively on visual analytics – but what exactly does that mean?

It starts with understanding that data is useless without a means for translating it into insights. Even the best analytics alone can’t provide optimal value if they can’t be translated into something meaningful for decision-makers. That’s where visual analytics come in.

What is visual analytics?

Visual analytics combines advanced methods of statistical analysis with visual interfaces that help facilitate the understanding of large amounts of data.

Why should we use visual analytics?

Technological advances have made it possible to track and store more data than ever before. This is an exciting opportunity, but humans are not wired to read and interpret data in its raw form. Visual analytics tools make it possible to identify insights in even the largest data sets – in turn making the data valuable.

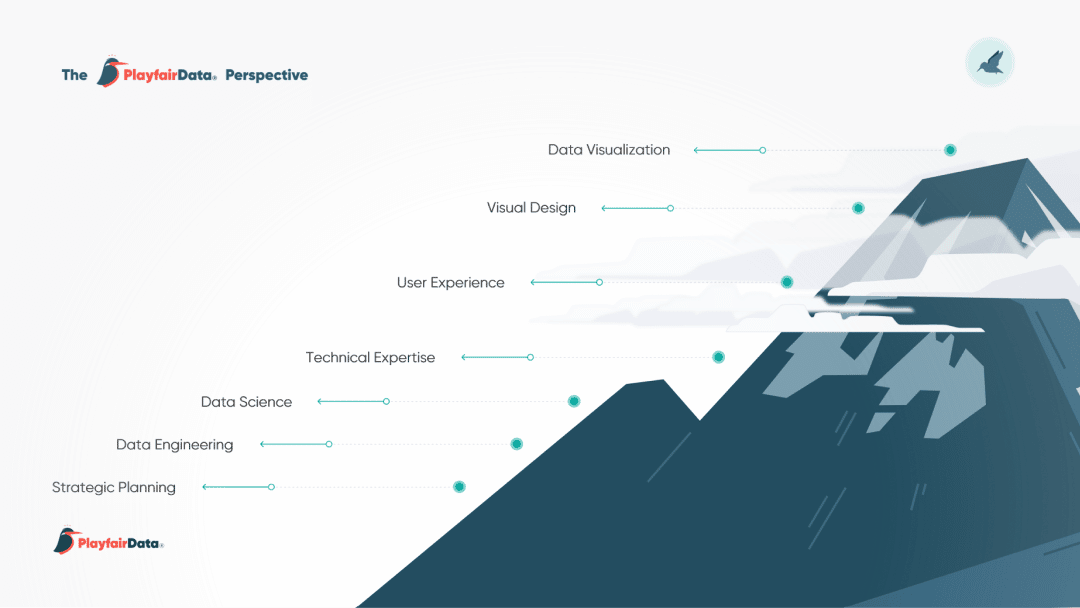
Gain the Playfair Data Perspective™️

To help our clients maximize the value of their data, Playfair Data guides them through the following visual analytics process:

Playfair Data offers a wide array of data services
Faded Logo Mark

We think of visual analytics as a mountain sitting next to a lake – a data lake, of course!

When you stand right next to the edge at the base of the mountain close to individual data points, you can’t see patterns or how the data fits together. If you’re able to reach the summit of data visualization – the key to translating raw data – you gain a whole new understanding that helps drive decision-making.

How can we help you turn your data into value?

Let’s establish your plan.

Get Started