How to Do Currency Conversion in Tableau with Google Sheets

With many organizations operating in different countries, the topic of currency conversion becomes more important for data visualization specialists. Despite the topic being relevant to many of us, there is very little documentation out there specifically for Tableau, as solutions are mostly directed towards relational databases.
However, with recent developments in Google Suite, converting currencies directly in Tableau has never been easier. In this post, I will walk you through how to get historic and current currency conversion rates using Google Sheets, how to join it in Tableau, and how to connect the data with different origin currencies.
By the end of this tutorial, you will be able to use data from different currencies and convert them in a single currency of your choice. This may allow your business better tracking of sales in different countries and expand insights into the distribution of customers.
Learn more author experience tips with Playfair+
Introduction to the sample dataset
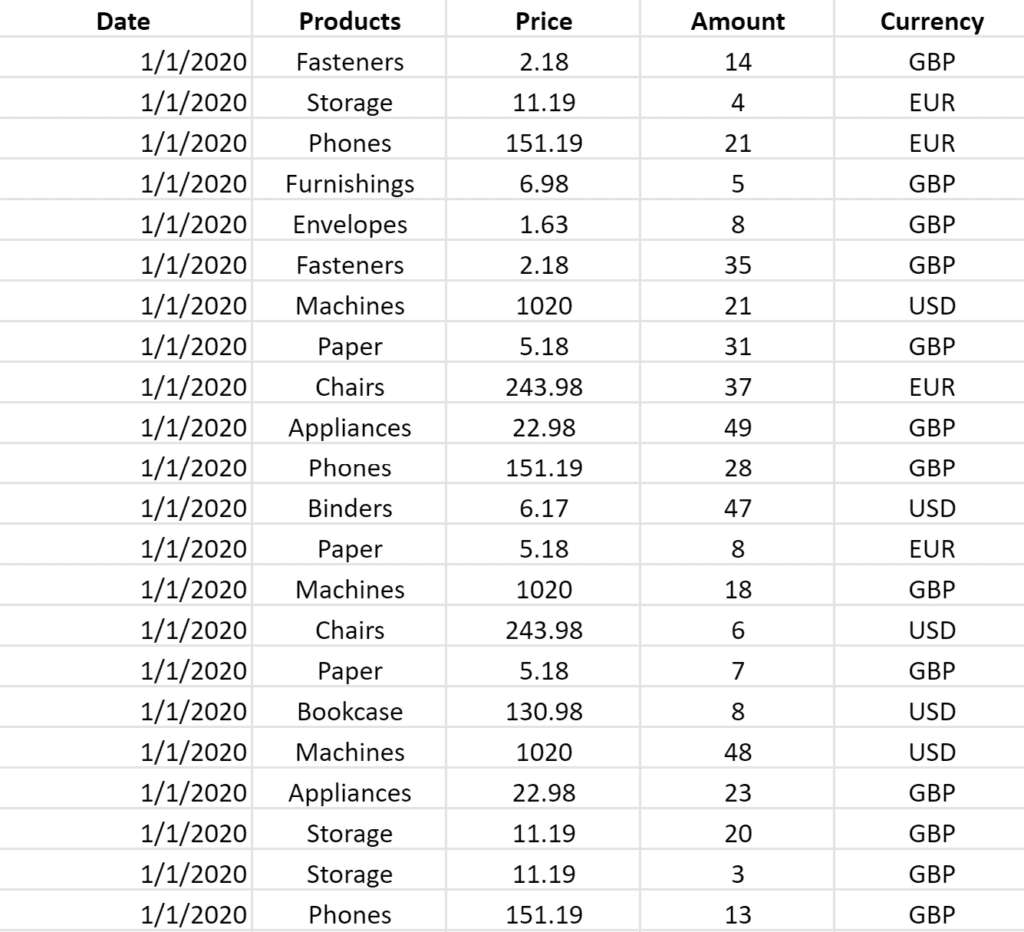
To show you how to convert currencies in Tableau, I have created a mock dataset using the Sub-Category dimension from the Sample-Superstore dataset. I created a separate dataset so I could include three different currencies for this example. However; you could also connect directly to the sample-superstore dataset and use this technique to convert the sales into different currencies.
![]()
The use case I have created is of a multinational company who has sales in multiple countries and wants to get the total revenue in one respective currency. The mock dataset that I created includes Date, Products, Price, Amount, and Currency. Below you can find a screenshot of the data after I populated it with random values.
Continue reading with a free account, or login.
Unlock this tutorial and hundreds of other free visual analytics resources from our expert team.
Already have an account? Sign In
By continuing, you agree to our Terms of Use and Privacy Policy.
If you would like to follow along, you can access the mocked-up data here including the example of the currency exchange rates calculation.
Generating the exchange rates
With help from the function GOOGLEFINANCE, Google Sheets allows us to directly access the information we need through Tableau. We can populate Google Sheets with all kinds of exchange rates or (if interested) stock tickers by simply following the recommended syntax.
The syntax itself, shown below, gives us a good orientation of what needs to be included in our dataset.
GOOGLEFINANCE(ticker, [attribute], [start_date], [end_date|num_days], [interval])
The first part within the brackets is asking about the ticker we want to track. For currencies, the tickers are the respective exchange rates. That means our ticker is called “CURRENCY” and we simply include which currencies we want to convert into the formula, e.g. “CURRENCY:USDEUR”.
By putting USDEUR as part of our ticker, we have determined that the base currency is the US Dollar. If you change this to EURUSD instead, your new base currency will be Euros and the rate shown will change accordingly.
The second part of the GOOGLEFINANCE Syntax is asking for an attribute. You have a couple of options depending on what you want to track and if it is current or historic information. You can find various ticker options directly on google support under this link here.
For the example used in this blog, I was focusing on historic data from January 2020. That is why I have chosen “CLOSE” as my ticker; other values for historic data would have been open, high, low, volume or all. As you can imagine, you are either getting the exchange rate at the end of the day, beginning of the day, the daily high or low, the volume traded that date or all of the information.
Finally, we just have to include the days we want to have included in our dataset and set an interval which you can set to daily or weekly.
Hint: You can leave out the start date, end date and interval and it will give you the current rate of the day when you refresh it. You will also get additional options for choosing your ticker which you can find more information on in the link to google support above. If that is your goal, make sure you select “live” in Tableau when connecting the data to make it dynamic.
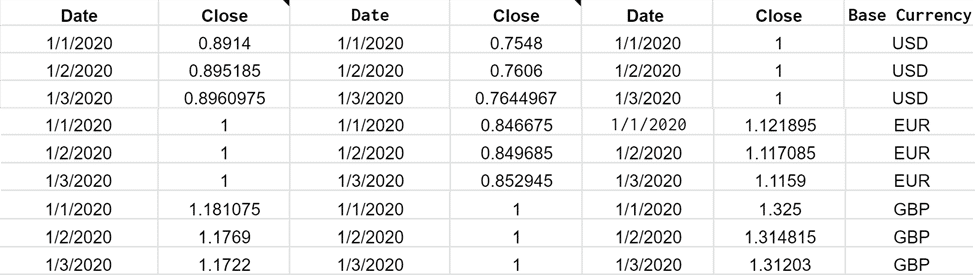
For the example here in the blog post, we are looking for exchange rates between January 1st and January 31st 2020 for the currencies USD, EUR, and GBP. I have created the first calculation as an example below. In the formula I have chosen USD as the base currency and I want to know the exchange rate to EUR.
=GOOGLEFINANCE(“Currency:USDEUR”,”close”,”1/1/2020″,”1/31/2020″, “Daily”)
You will have to do this a couple of times until you have all the information you need. What that means is you have to adapt the ticker part of the formula and change the exchange rates to cover all three currencies as a base rate. If you follow through correctly, you will have converted from USD to EUR, from USD to GBP, from EUR to USD, from EUR to GBP, from GBP to USD and from GBP to EUR. To give you an overview of how that could look, I have compiled an excerpt of the data below.
Joining data in Tableau Desktop
If you haven’t connected to Google Sheets before in Tableau, the easiest way to get to it is searching for it in the ”Connect” pane in Tableau. In addition to the Google Sheets data, make sure to load in your own dataset that you want to visualize (our mock sales data in this example).
Before you continue with the next steps to get your currency conversion going, make sure you rename the fields appropriately and hide any additional dates that you don’t need. you can do this by right-clicking on the field from the data source tab and selecting Rename or Hide. Your end result should look somewhat similar to what you can see in the extract below.
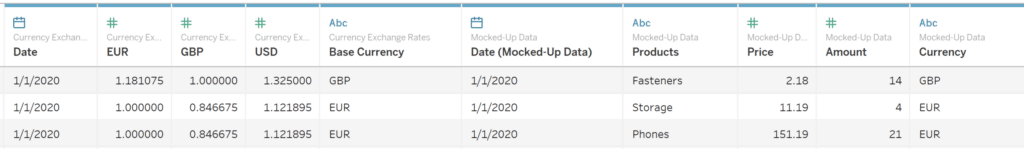
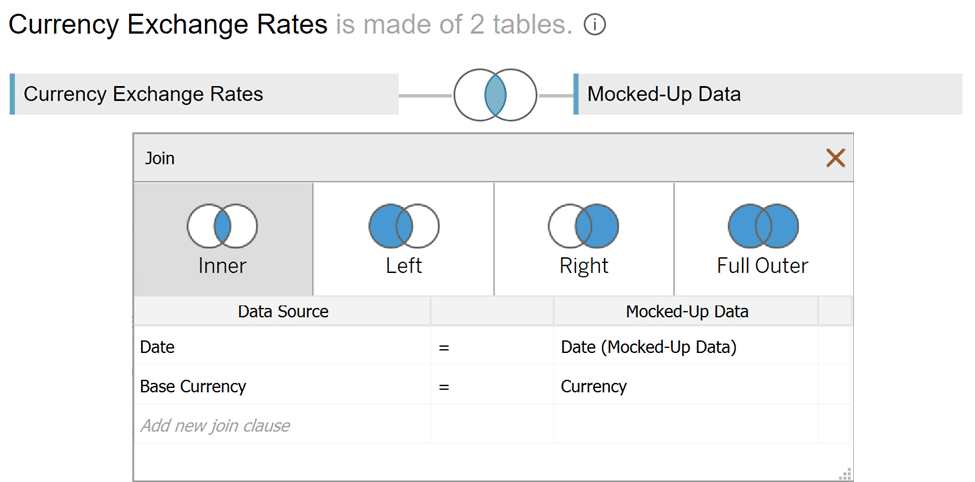
As a next step to be able to convert our currencies, we need to connect the two datasets and join them on their dates and their base currencies. The connection of the base currencies to the currency in the mock sales data is important and I chose to use an inner join for this step. Below is what the final output will look like after I connected and joined both datasets.
Now after joining the two datasets, we can finally start working in the Authoring interface and begin the fun part!
Creating a currency conversion selector in Tableau
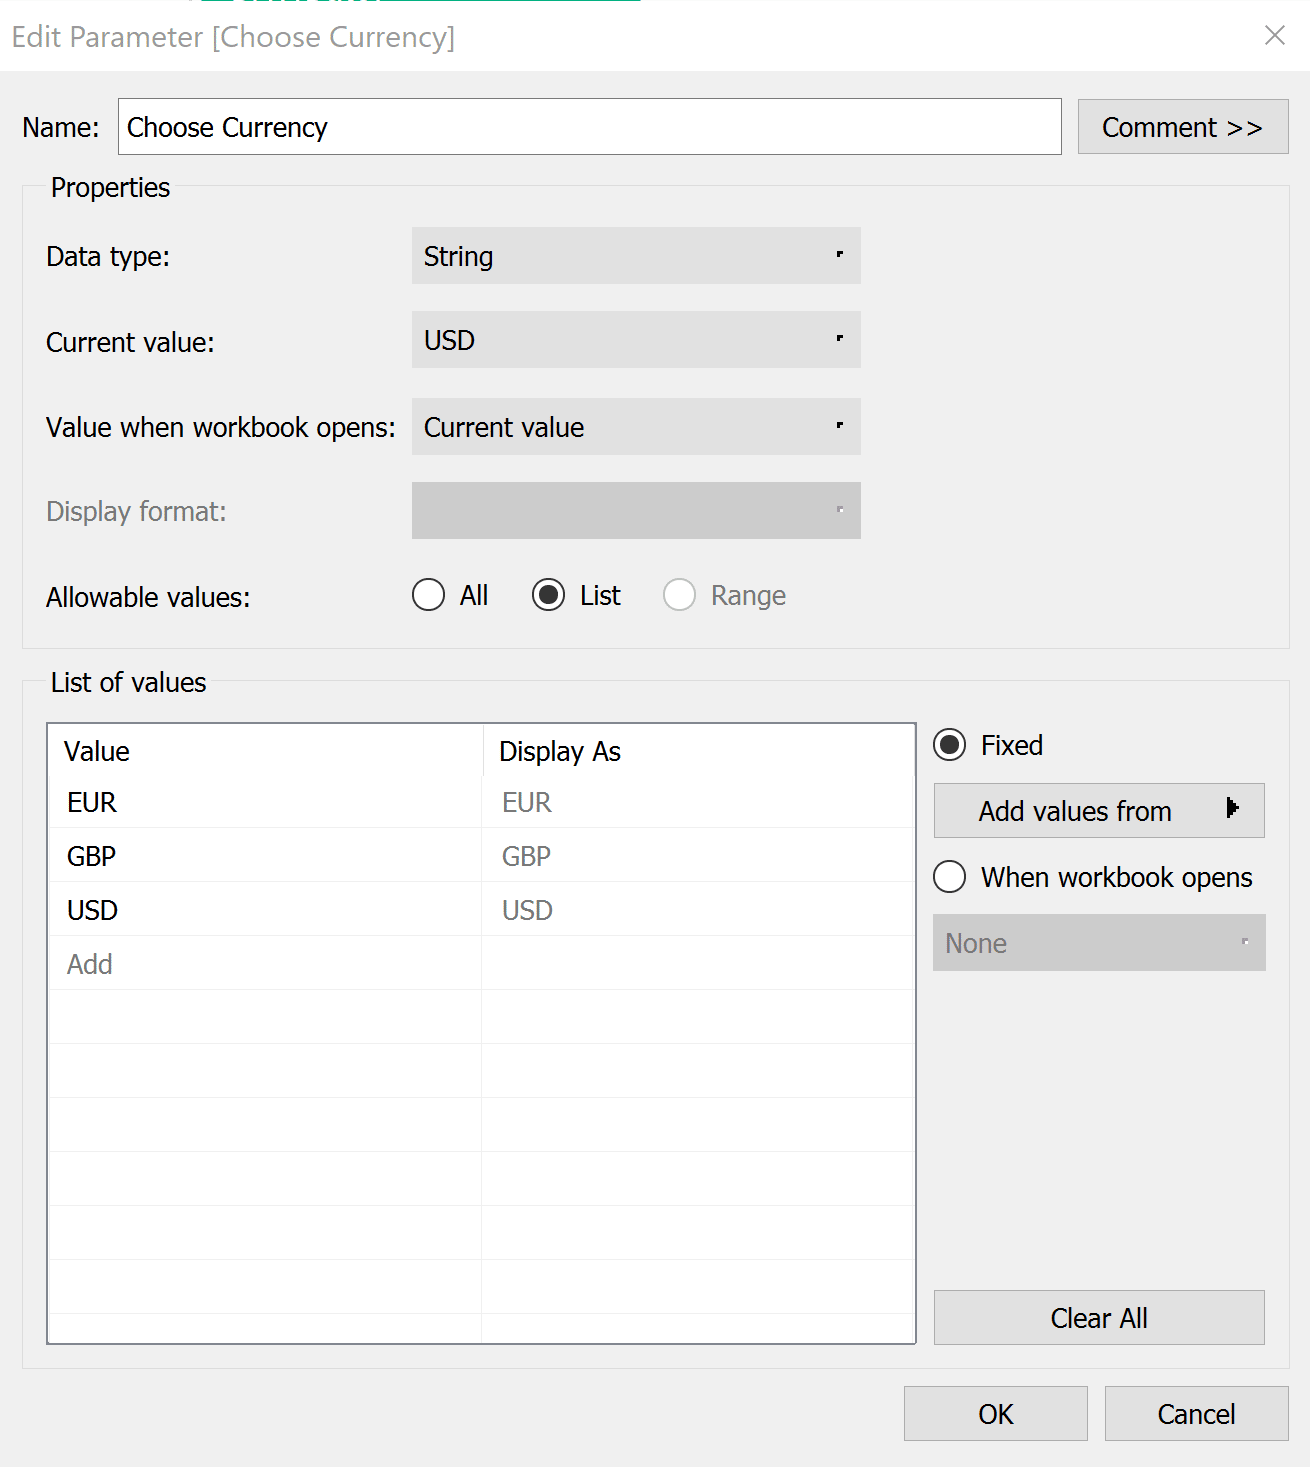
To stay flexible, it is nice to have a parameter that the user can change to convert currencies to different types.
To create the parameter, right-click in any blank space in the Data pane, choose Create, then Create Parameter. I will title it “Choose Currency”, change the data type to String, fill out a list of allowable values, then click OK.
You can choose whether you want to use the full name of the currency e.g., US Dollars or simply its abbreviation. I chose the abbreviation for the currencies because it’s less likely to have any spelling mistakes or create any troubles that we may have to fix later.
The parameter will be used to determine which exchange rate will be multiplied against the sales data. In our example, we change the base price of each item to the currency we have chosen in our parameter.
Create a currency conversion calculation in Tableau
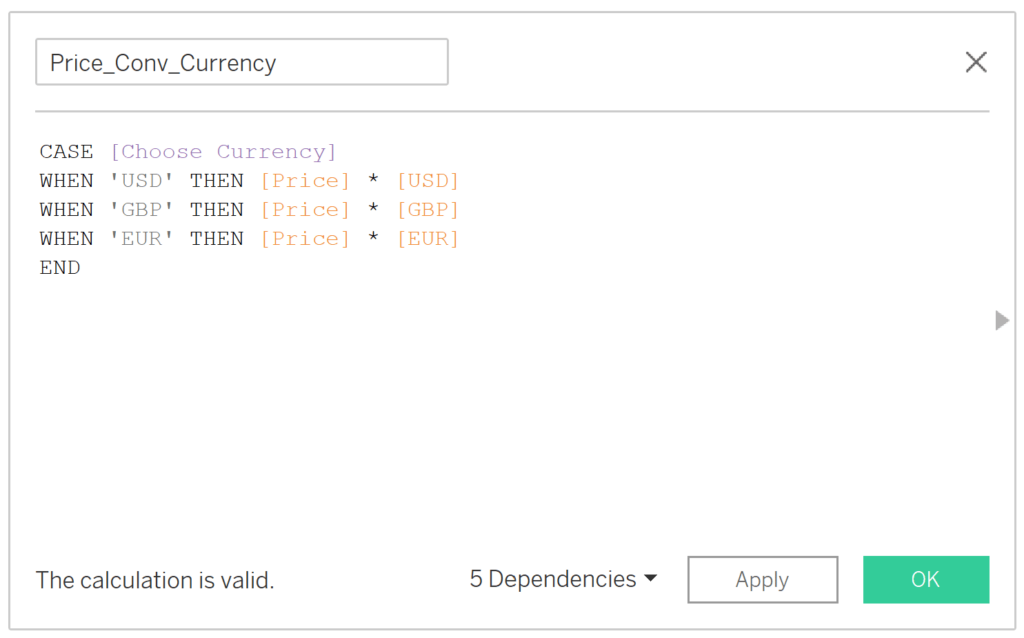
To make this conversion more interactive and applicable to real life, we need a CASE statement using our parameter and telling it what needs to happen depending on our choice.
There is no mathematical reason one couldn’t do this against total sales or aggregates, but this is the best option for our example since we are looking for every sales transaction only in the month of January.
I will right-click in any blank spot in the Data pane, select Create, then Calculated Field, call it Price_Conv_Currrency, and enter the following:
Price_Conv_Currency
CASE [Choose Currency]
WHEN ‘USD’ THEN [Price] * [USD]
WHEN ‘GBP’ THEN [Price] * [GBP]
WHEN ‘EUR’ THEN [Price] * [EUR]
END
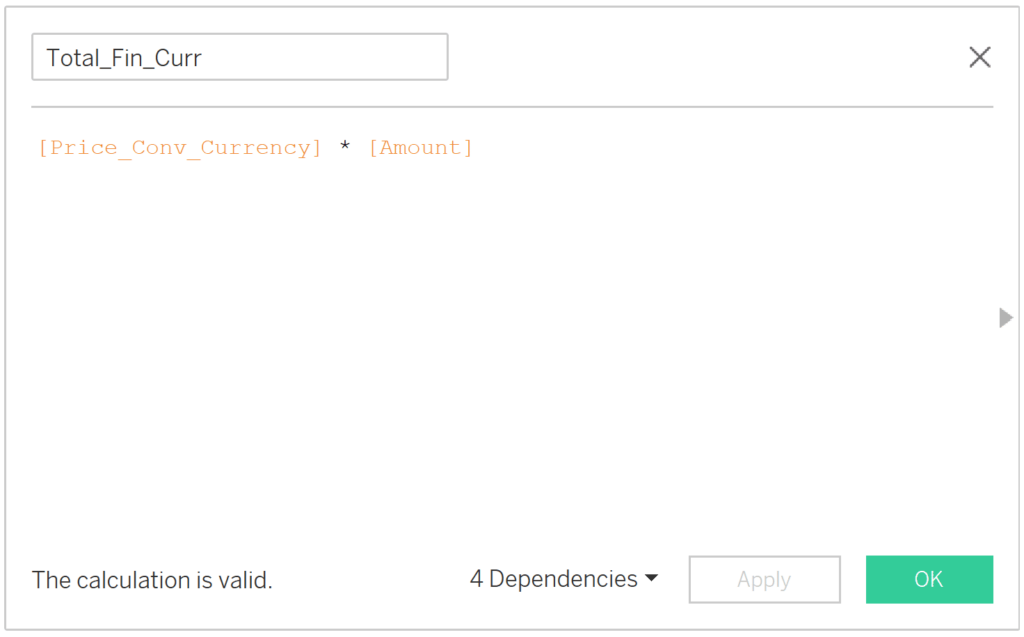
In the final step, we multiply our results from the calculated field above with the amount purchased and get our total sales in the final currency chosen, defined by our parameter.
Again, I will right-click in any blank spot in the Data pane, choose Create Calculated Field, and enter the following formula, which I will call “Total_Fin_Curr”:
Total_Fin_Curr
[Price_Conv_Currency] * [Amount]
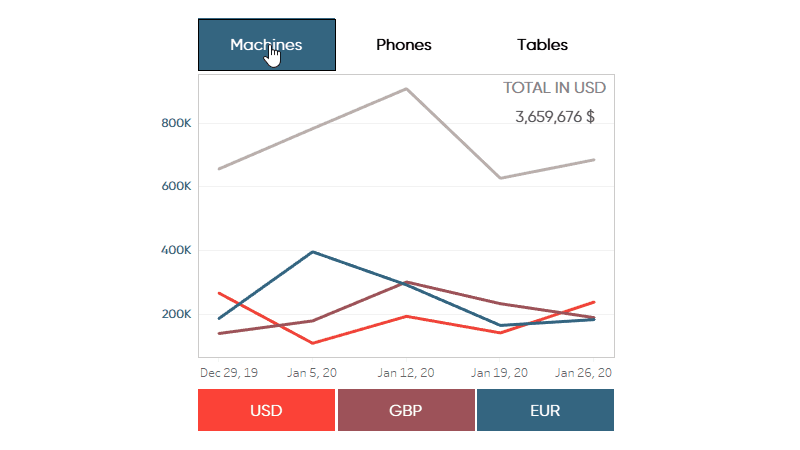
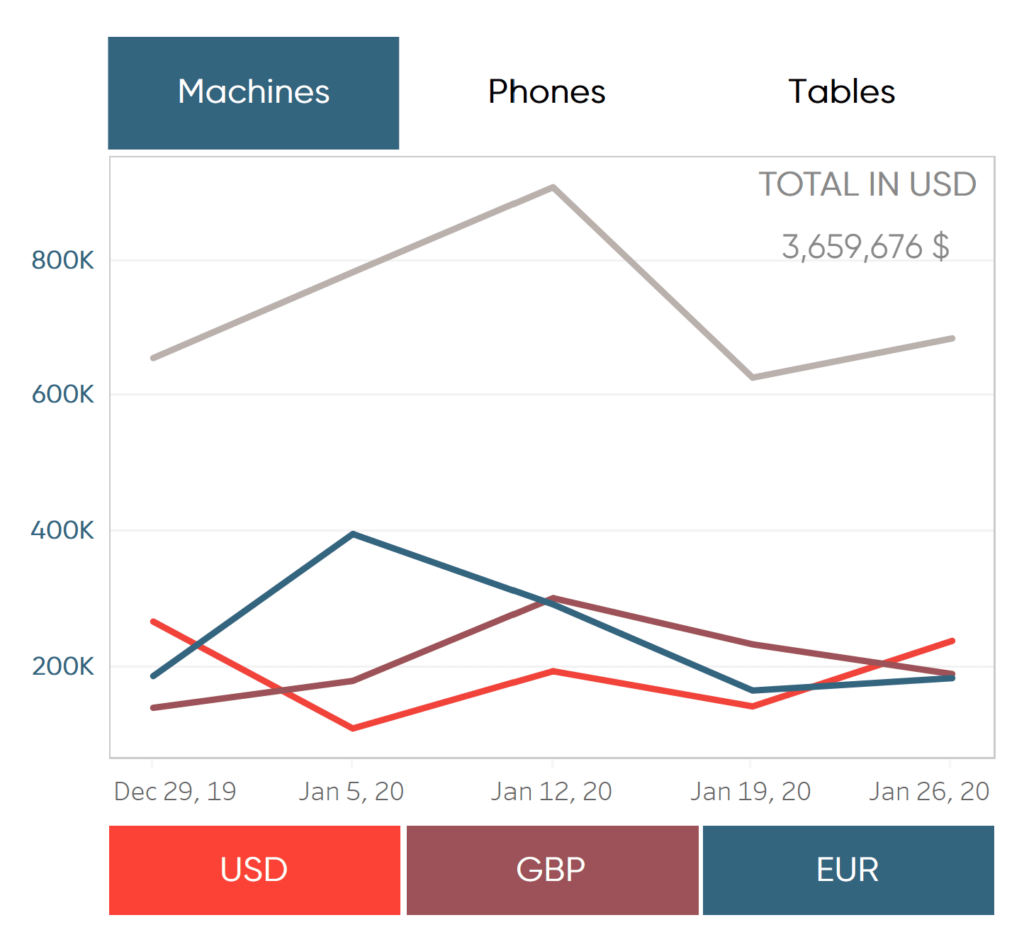
In the end, you only have to drag and drop the fields you want on your sheet in Tableau Desktop and create the visualization you prefer.
![]()
I personally chose to show the total sales of my products by allowing the user to toggle between three of the products. I also added a callout at the top showing the total sales in whichever currency the user selects as well as the distribution of each currency.
Now it’s your turn to create your own currency conversion in Tableau!
Stay hungry,
Maggy

Written By
Maggy Muellner
Related Content
Bringing Tables Together: Tableau’s Physical Layer

Welcome to our series on bringing tables together! This first article is all about the physical layer in Tableau, including…
3 Creative Ways to Use Google with Tableau Dashboard Actions
Google has a number of powerful tools that can help with your business analyses. In addition to the native Google…

Ryan Sleeper
Control any parameter actions scenario with a second data source One drawback to parameter actions is the value you want…