
Introducing Playfair Data’s Brand Identity

The analytics and data visualization space feels different this year. Innovations in artificial intelligence have made it easier than ever for people to embrace, create, and share visual analytics. I haven’t seen this much progress and potential positive impact in the field invented by our company’s namesake, William Playfair, back in 1786 since the launch of modern business intelligence tools like Tableau back in 2003.
It’s fun, inspiring, exciting, and at times, a bit nerve-racking. Just like the old times a generation ago.
What I’ve realized early on though is these extraordinarily powerful technologies coming our way, being improved seemingly by the day, still need people in the loop. AI still needs thought leaders to set a strategy tied to company objectives in motion. It still needs us to prepare and provide data in a form that will deliver results we can be confident in acting on. It needs soft skills to connect with audiences to deliver tailored and intentional design experiences. It needs analytics engineers to verify the code is sound, calculations are correct, and outputs are working as expected.
If these sound familiar, it’s because they’re the four tenets of the Decision-Ready DataTM framework – strategy, data preparation, design, and analytics engineering – that Playfair Data was founded on ten years ago. This once again isn’t an end, it’s just the start. That’s why I can’t wait to share that we are meeting the present moment with an entirely reimagined brand identity to not only stay relevant in this rapidly-evolving industry, but set the tone for our next ten years and beyond.
Why is Playfair Data introducing a new brand identity now?
In addition to entirely new logos, colors, typography, graphics – not to mention having to apply all those to thousands of resources we’ve provided over the years – we’re rebuilding our entire website from the ground up. This involved multiple agencies, hundreds of hours of work, and tens of thousands of dollars. It was not a small undertaking. So you may be wondering why we’re doing this now?
We’re doing this for several reasons:
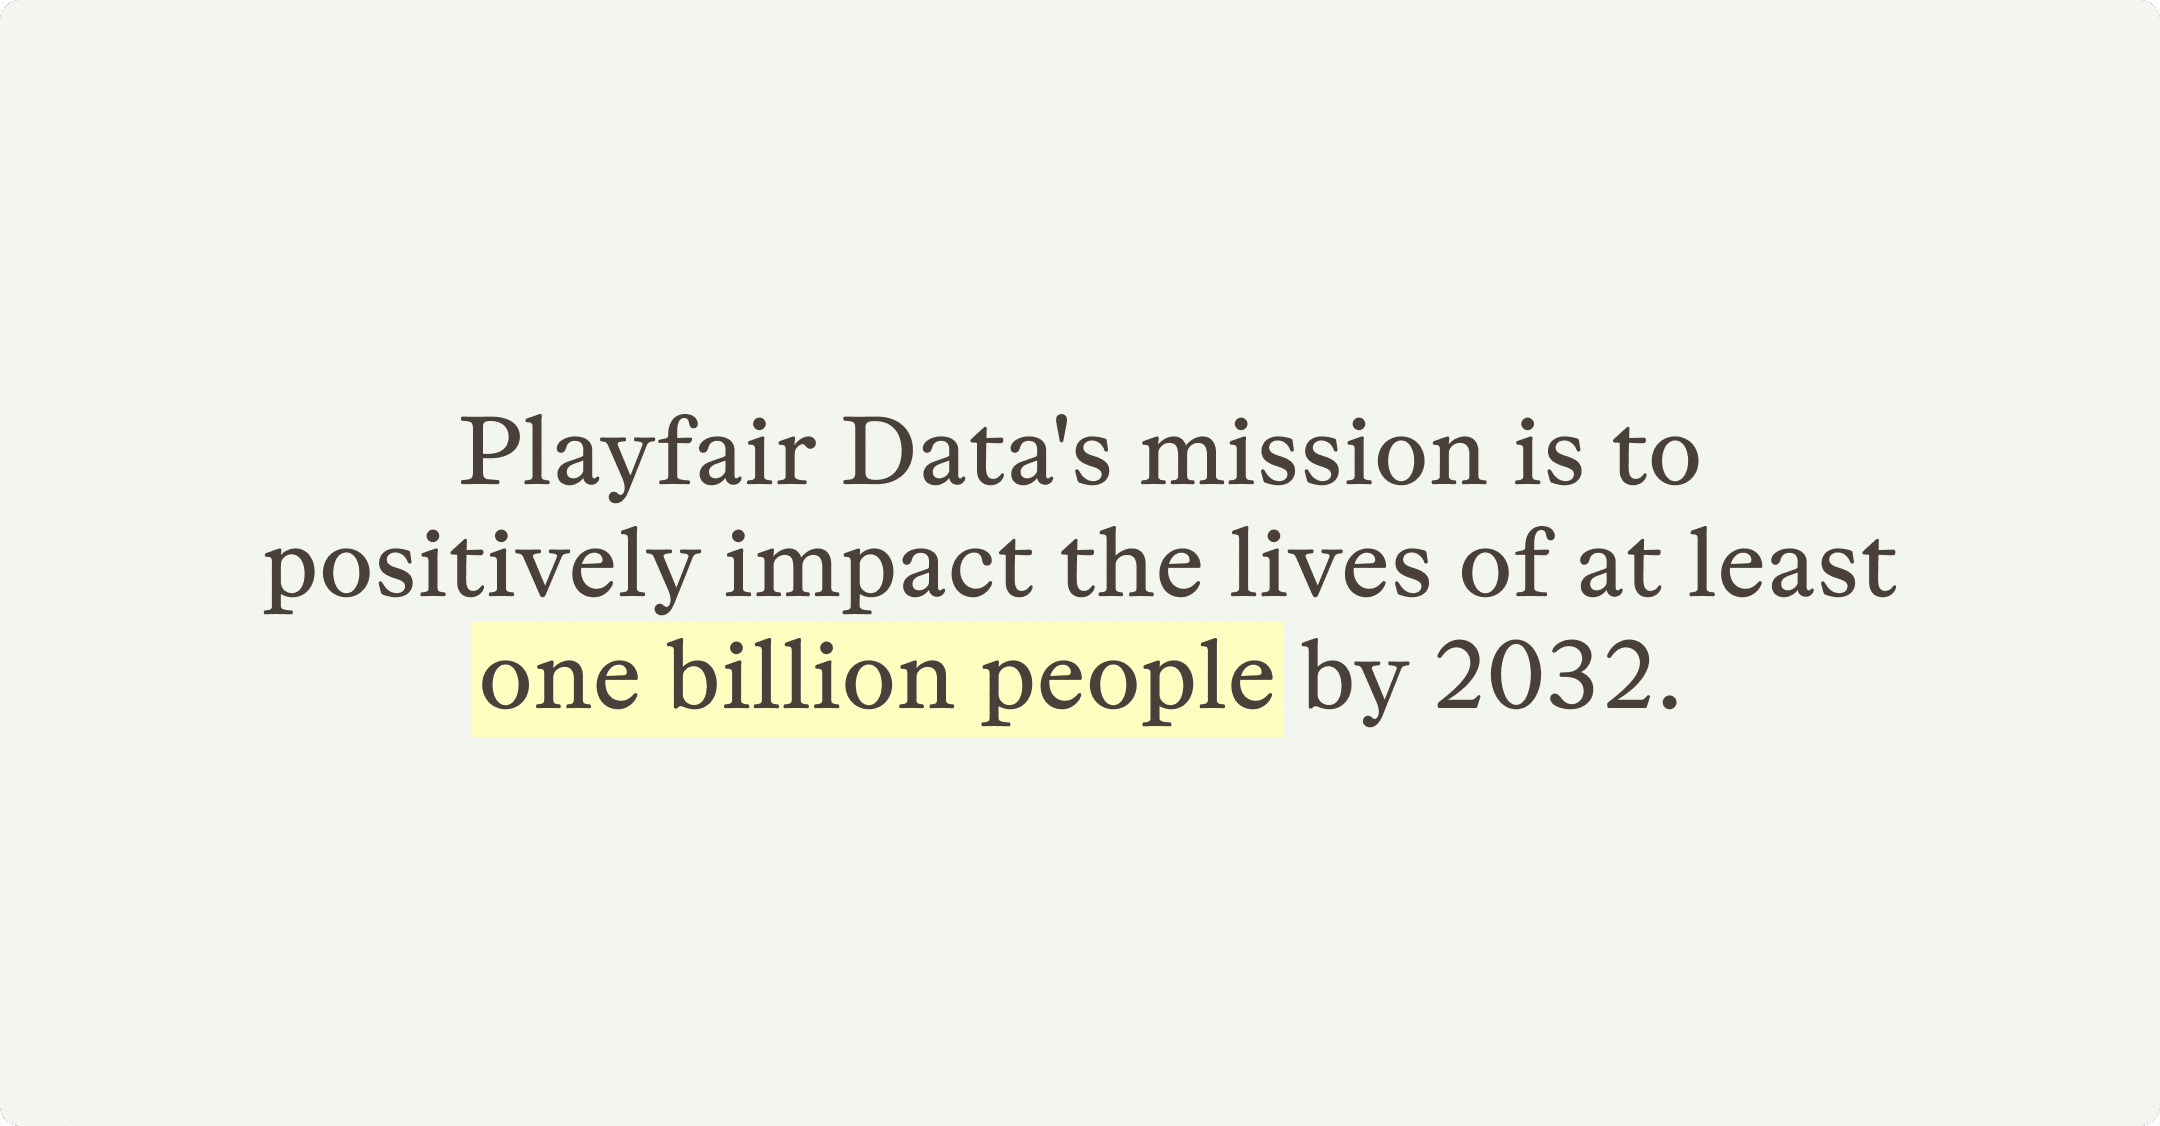
- We recently announced a new mission statement to our team, Playfair Data is on a mission to positively impact the lives of at least one billion people by 2032. In the short few months since we introduced this mission and began attempting to quantify our impact, it’s been incredible to me how easy this lens has made decision making for our business. When a potential course of action gets us closer to achieving this mission, we do it; otherwise we don’t. This new brand identity was needed to give us the best chance of helping others, in turn scaling our positive impact.
- There were a few practical challenges with our existing brand and website. Our primary color red, for example, is often associated with negative performance – not the best choice for the strategic business dashboards we are building for our Fortune 500 clients. On top of that, almost 10% of men in North America are red-green colorblind and, even worse, the contrast of white text on a red button used throughout our site wasn’t meeting basic accessibility standards. Making our brand as accessible as possible isn’t only practical and becoming the legal standard, it’s just the right thing to do.
I personally chose the color red when I started Playfair because the symbolism of it being the first color that humans can perceive, just like visualization allows humans to truly see their data for the first time. I will miss it, but we’ve come up with a solution that I believe will be even better in the Color section below.
- When it comes to the website, it was built on a framework that is no longer maintained. This proved to be particularly challenging for our company because we continued to introduce new resources and benefits to our thousands of members. This led to clunky user experiences, reduced credibility, and ultimately holding us back from helping as many people as I know we can.
- One of our core values is continuous improvement. In addition to recognizing that we can always get better and that we should try to incrementally improve every day, I have always believed in reinventing ourselves every two to three years. Technology, public perceptions, and skill commoditization just evolve too rapidly for us to rest on our past success. Fortunately for us, this round of reinvention aligns perfectly with arguably the biggest technological breakthroughs in human history. This is the perfect moment to incorporate everything we’ve learned in the past ten years, align ourselves with the best practices of the present, and leave flexibility to scale into the future.
Playfair Data’s new logo, brandmark, wordmark, and typography
The cornerstone of our new brand identity is a completely redesigned logo. It includes a brandmark, wordmark, and several ‘lockups’ that allow for flexibility in how the brand is applied. The logo is meant to act as both a first impression and seal of authority that evokes a balance of trustworthiness and a visual representation of the three core benefits of data visualization: speed to insight, accuracy of insight, and improved engagement.
Brandmark
Our brandmark continues to be based on our company’s mascot, the common kingfisher. Contrary to its name, the common kingfisher is one of the most unique animals in the world. First, they have evolved to have a built in water refraction adaptation which allows them to naturally account for how bending light might blur the path between them and the fish they are hunting. As they dive into the water, a transparent third eyelid protects their eyes and allows them to maintain their elite vision while underwater. Their beak is so precise and efficient that Japanese engineers modeled the front of bullet trains after them to prevent loud sonic booms from occurring when the trains exit tunnels.
All of these traits are the perfect metaphor for what Playfair Data delivers to our clients everyday: strategically planning the best course of action while accounting for misleading variables, executing with the best skills and tools available in the industry today, and scaling our successful deliveries through efficiency and consideration of the greatest good.
So, we’ve doubled down on the kingfisher representing our company, but have reimagined its positioning. Rather than perched, the kingfisher in our brandmark is now diving, an action pose meant to evoke the practice of making better, faster decisions.

There are other hidden meanings in our brandmark too.
- As the brandmark dives, its upper wing forms a bar chart with an upward trajectory. This is meant to be symbolic of our team diving for insights while simultaneously improving outcomes for our clients. The bar chart is also a nod to William Playfair’s invention of the bar chart in his 1786 book, The Commercial and Political Atlas.
- The circular eye is not only a shape popular in many of our favorite data visualizations like the scatter plot, dot plot, and box-and-whisker plot, but its oversize is meant to imply our clients’ ability to see and understand their data will also be oversized.
- The wings align perpendicularly, forming a x-axis and a y-axis, the foundation for every data visualization.
Wordmark and typography
When researching fonts for our new brand, we were searching for something that looked handcrafted and again, evoked William Playfair’s data visualization inventions in Scotland at the turn of the 19th century. After considering hundreds of fonts, we thought we found the perfect solution with Foundry Wilson, a font that was not only invented by a Scottish type founder, but within a year of William Playfair’s birth, no less. However, sticking to our roots of balancing the old (e.g. data visualization from 1786) with the new (e.g. modern BI tools and inventing new data visualizations), we opted to use Otto as a more-modern interpretation of an old Scottish font as the base for our wordmark.

Of course our wordmark also contains meaning and symbolism:
- Imperfections and openings in our primary initial, “P”, and the letters, “a”, are meant to look handcrafted and represent the same human touch we bring to our increasingly technical field.
- The subtle customization of the letter “f”, where the crossstroke is only visible on the right side of the letter, is another representation of speed to insight.
- The circular bulbs are meant to not only fit the circular language of the kingfisher brandmark, but represent some of our proven strategic frameworks, like the four circles from the Decision-Ready Data framework.
In addition to the wordmark, Otto will be used throughout our new brand for headlines. Otto, a serif font with foundations in 17th-century type, will be paired with the modern sans-serif font, Figtree. Figtree will be used for larger copy blocks throughout our hundreds of tutorials and was chosen for its legibility, particularly when it comes to the clarity of numbers throughout our data visualizations.
Lastly, we are introducing a new highlighting effect to our type which will be used to emphasize key quotes, statistics, or insights. This is one more effort to emphasize the human aspect of analytics, recognize our field started by meticulously plotting data and preattentive attributes on a x-axis and y-axis, and elicit a sense of handcrafted expertise.
Playfair Data’s new color palette
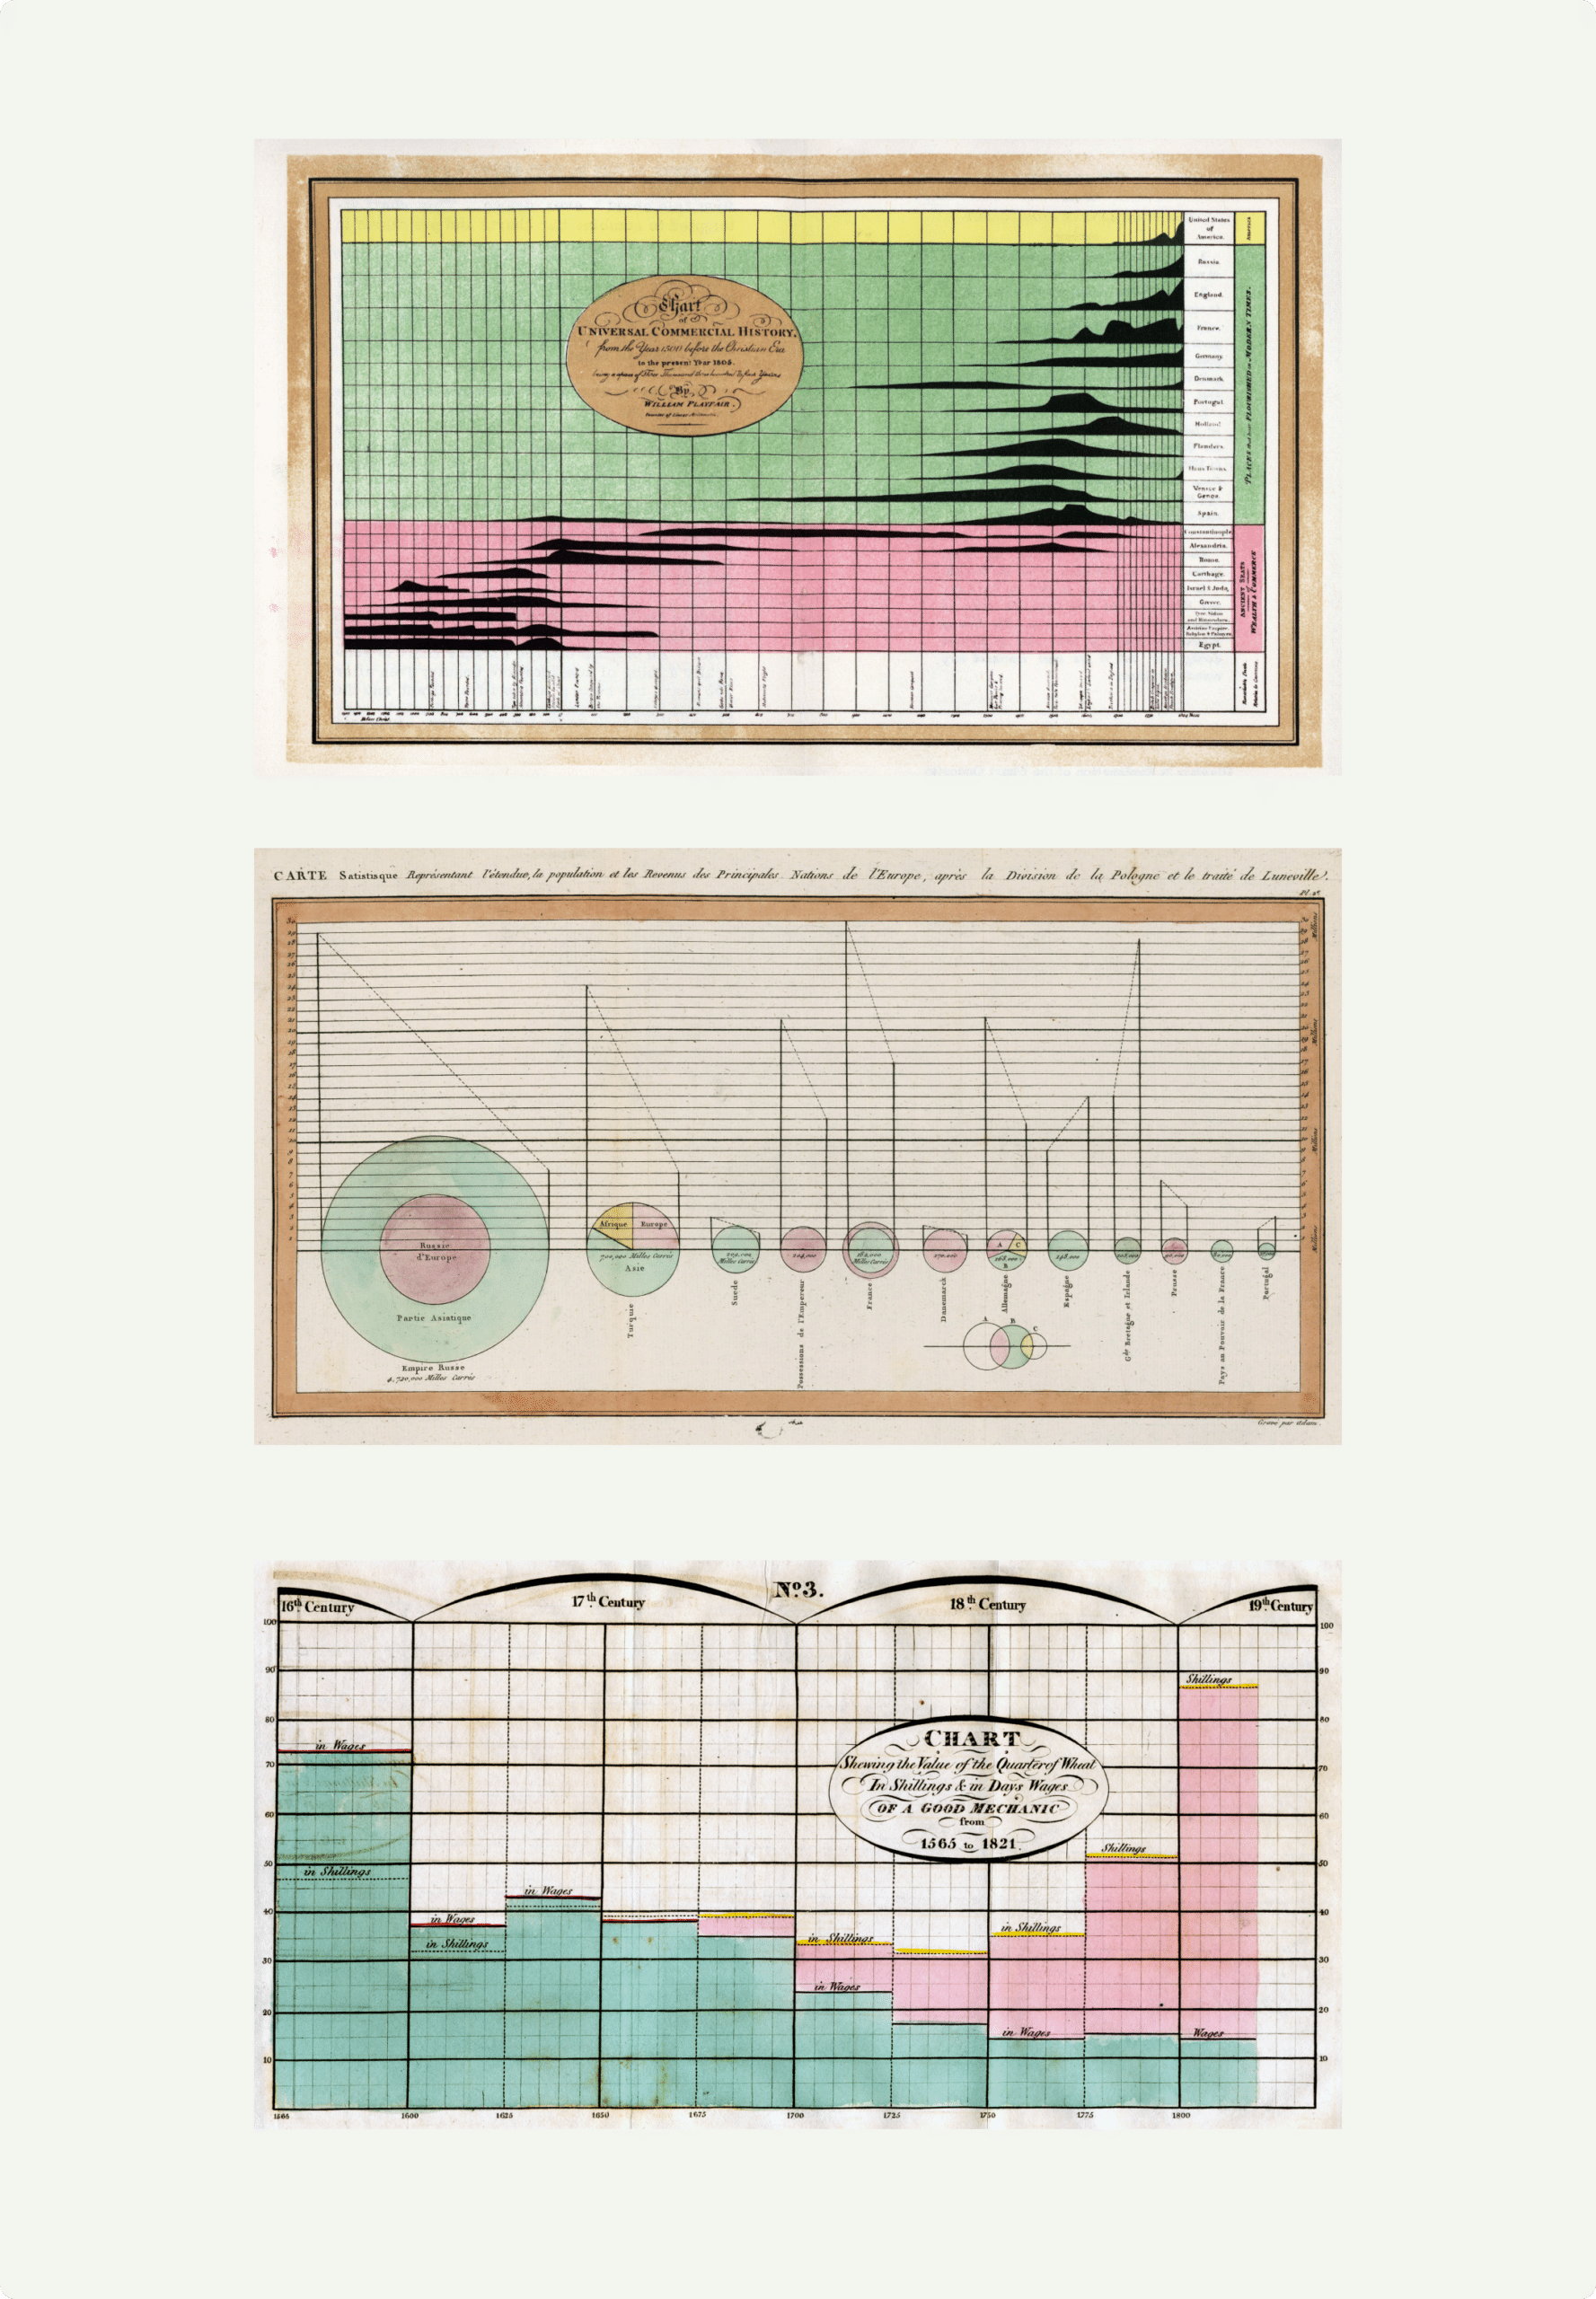
The highlight effect will only ever be seen in pastel green, yellow, or red. These are colors pulled directly from William Playfair’s earliest work like the area graphs in Universal Commercial History and his first pie chart showing divisions of the Turkish empire.
This same level of thoughtfulness and symbolism went into our entirely new color palette.

Our primary colors are moving away from the common black type on a white background seen in most interfaces today, and toward a dark brown “ink” on a variety of off white “paper” backgrounds. The purpose for this is threefold:
- It’s another recognition of our deep roots that run beyond technology and are built on Willam Playfair’s original data visualizations from 240 years ago.
- These more natural colors that elicit a sense of handcraftedness represent incorporating the human touch of expertise needed to get the most out of emerging technologies.
- The neutral color foundation will allow us to selectively use other colors to highlight key insights and decision points, letting the data visualizations we create speak for themselves.
Our secondary colors are based on the vibrant feather colors of the common kingfisher. Not only are these a great fit with our logo and company mascot, they 1. work well for data visualization 2. are more friendly to certain types of color blindness 3. will make insights and decision points extremely clear.
Here’s an early example of us applying the new brand colors to one of our decision consoles, Super Sample Superstore. We’ve used these dashboard views to teach analytics tactics and strategy for years. We also occasionally rebuild it in various software for feasibility testing and to push the envelope of what’s possible.
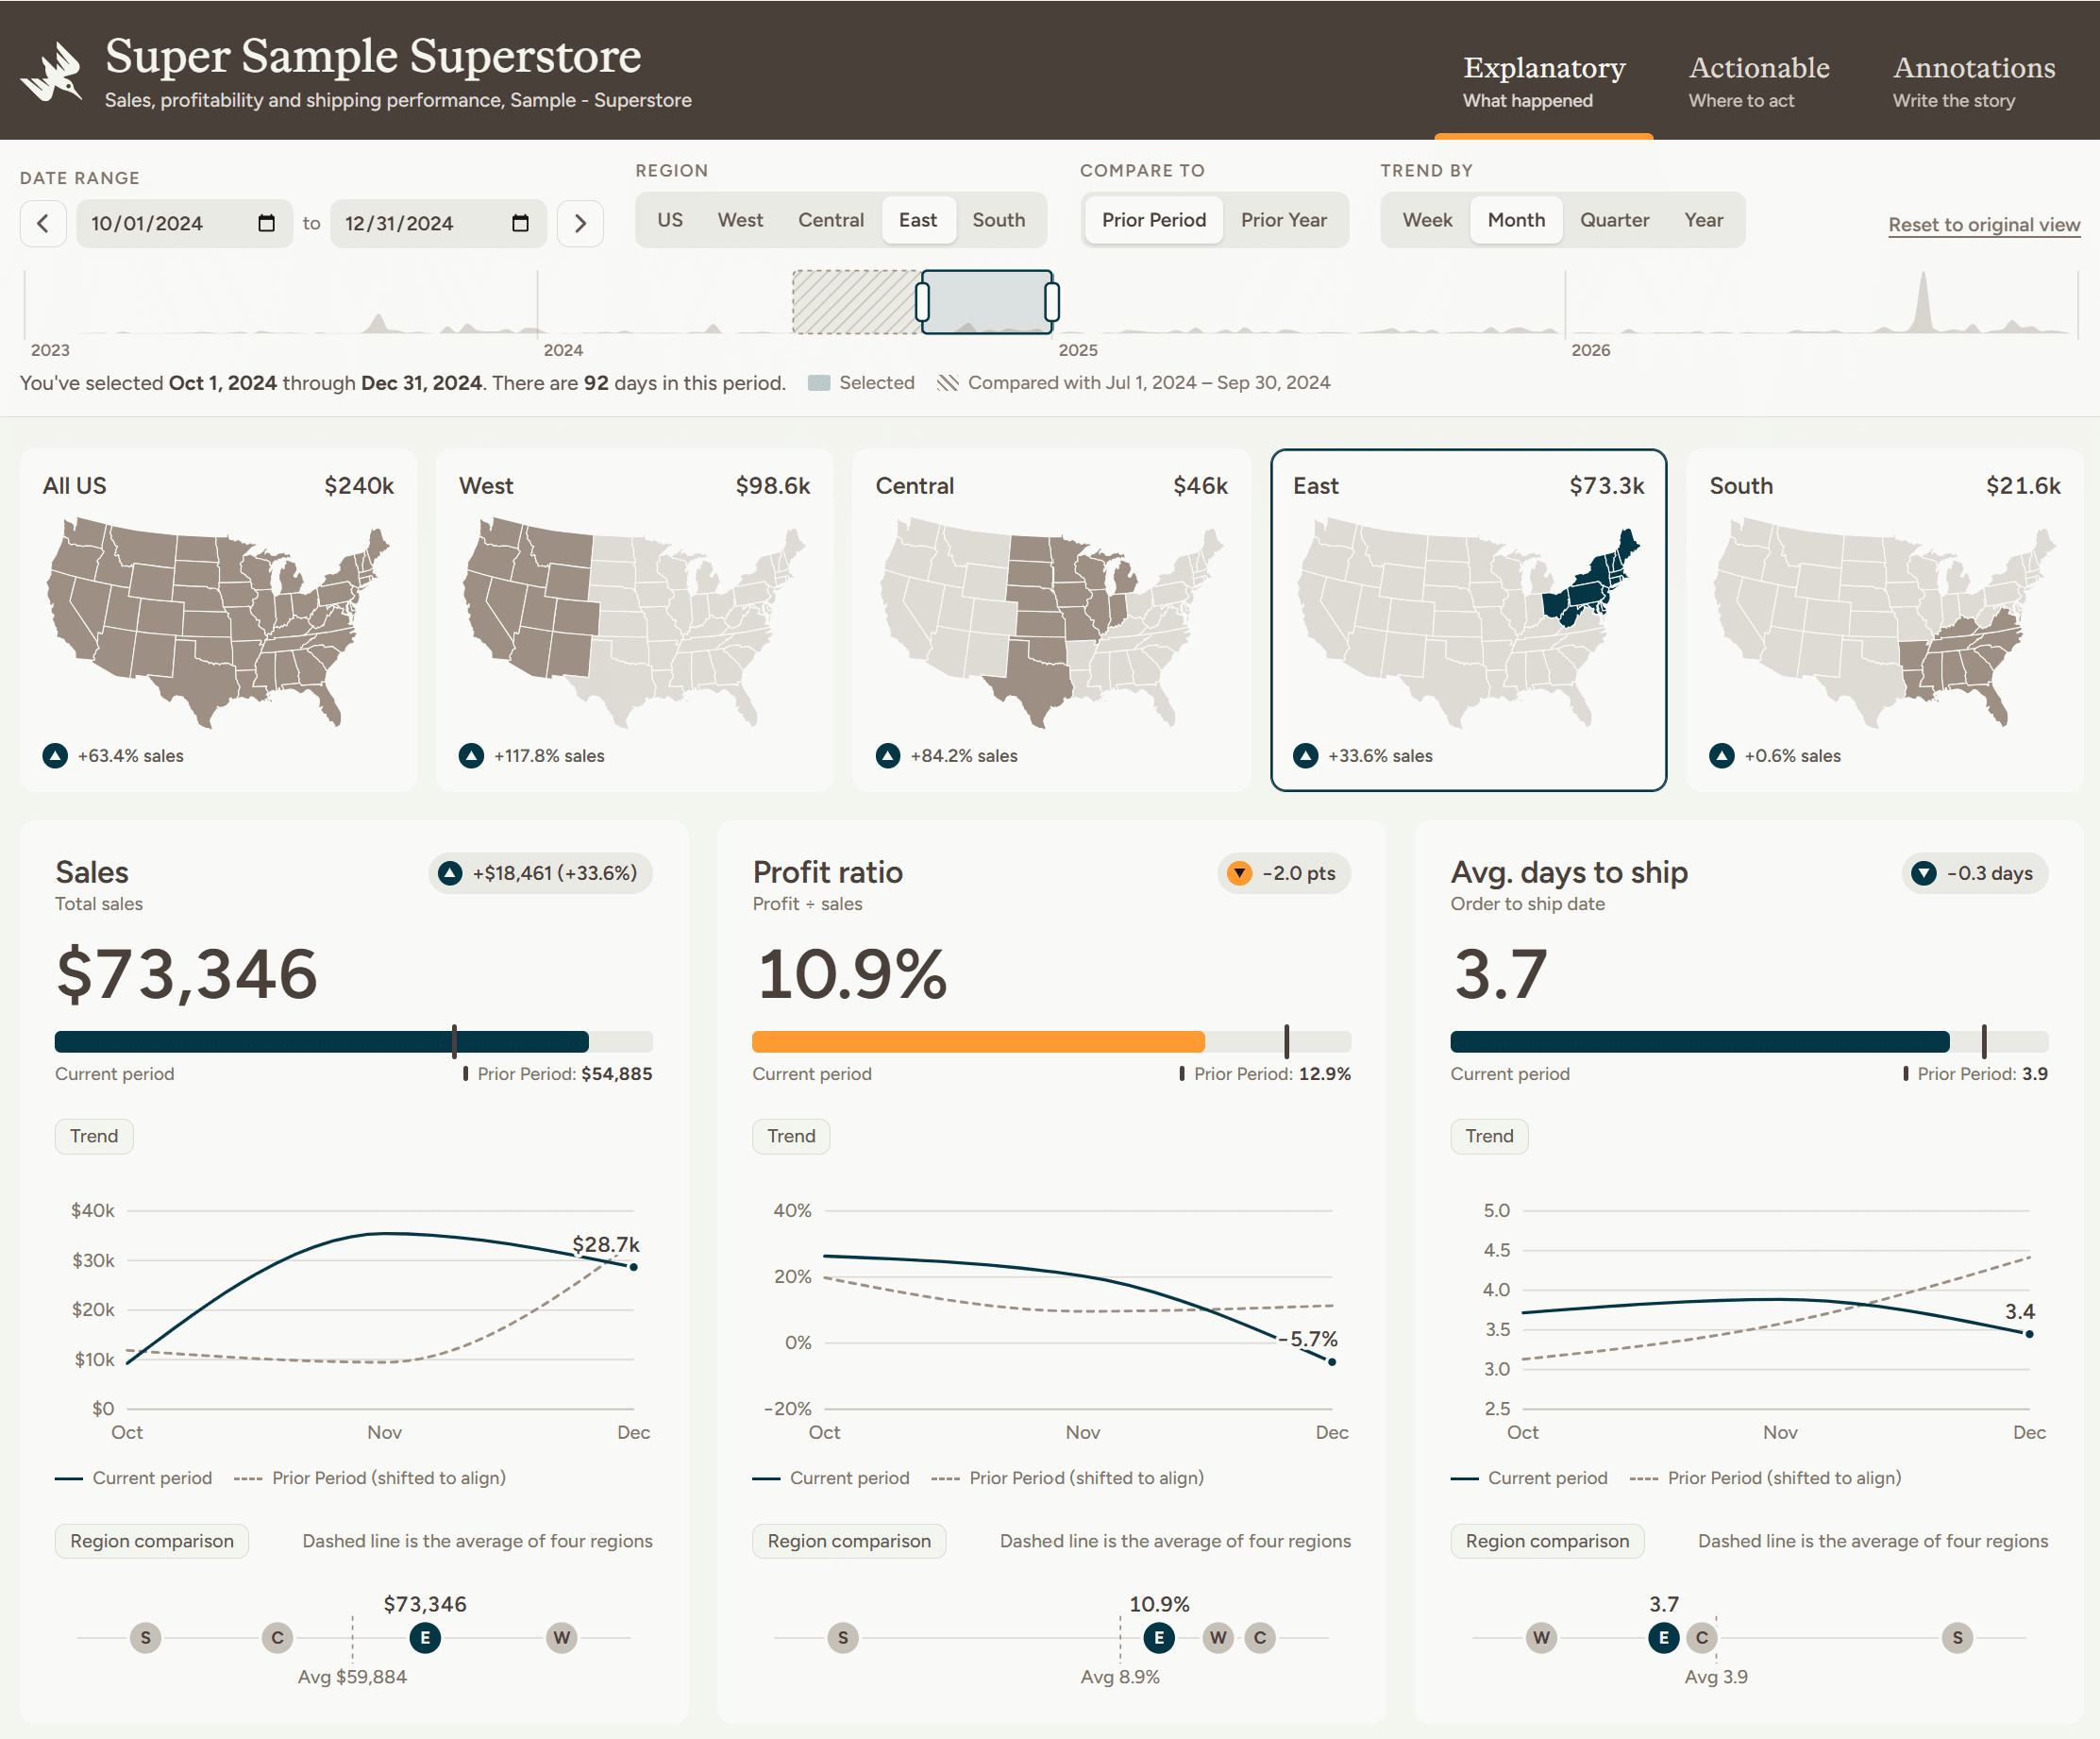
I mentioned earlier that I’ll miss the red from our original color palette because red is the first color we see in our lives, a fact I picked up as a young child reading The Giver by Lois Lowry. Well, orange, which we will be using as our main hue for guiding our stakeholders’ attention is a mix of red and yellow, the latter of which is the color that humans process the fastest. This is yet another symbol representing our company’s aspirations of creating analytics people actually use and creating solutions that lead to better, faster decisions.
We believe the balance of these meaningful, practical, and timeless colors will carry us for at least the next ten years – who knows, maybe even the next 240 years.
Playfair Data’s new graphics spectrum
A core part of our identity that has never changed is our mix of old and new. We often use bar charts and line graphs from 1786 in our current work, but we’re also on the cutting edge of visual analytics and our company has arguably invented six chart types. Our office during our back-to-back-to-back years of Inc. 5000 growth was located on the 19th-century trading route, The Sante Fe Trail in Overland Park, Kansas, while at the same time our Florida team worked from the smart city of Lake Nona, Florida, where it is not uncommon to see rockets being launched into space. The age-old practice of storytelling is still essential to persuading our stakeholders into action, and now we find ourselves on the cusp of another technological revolution with AI.
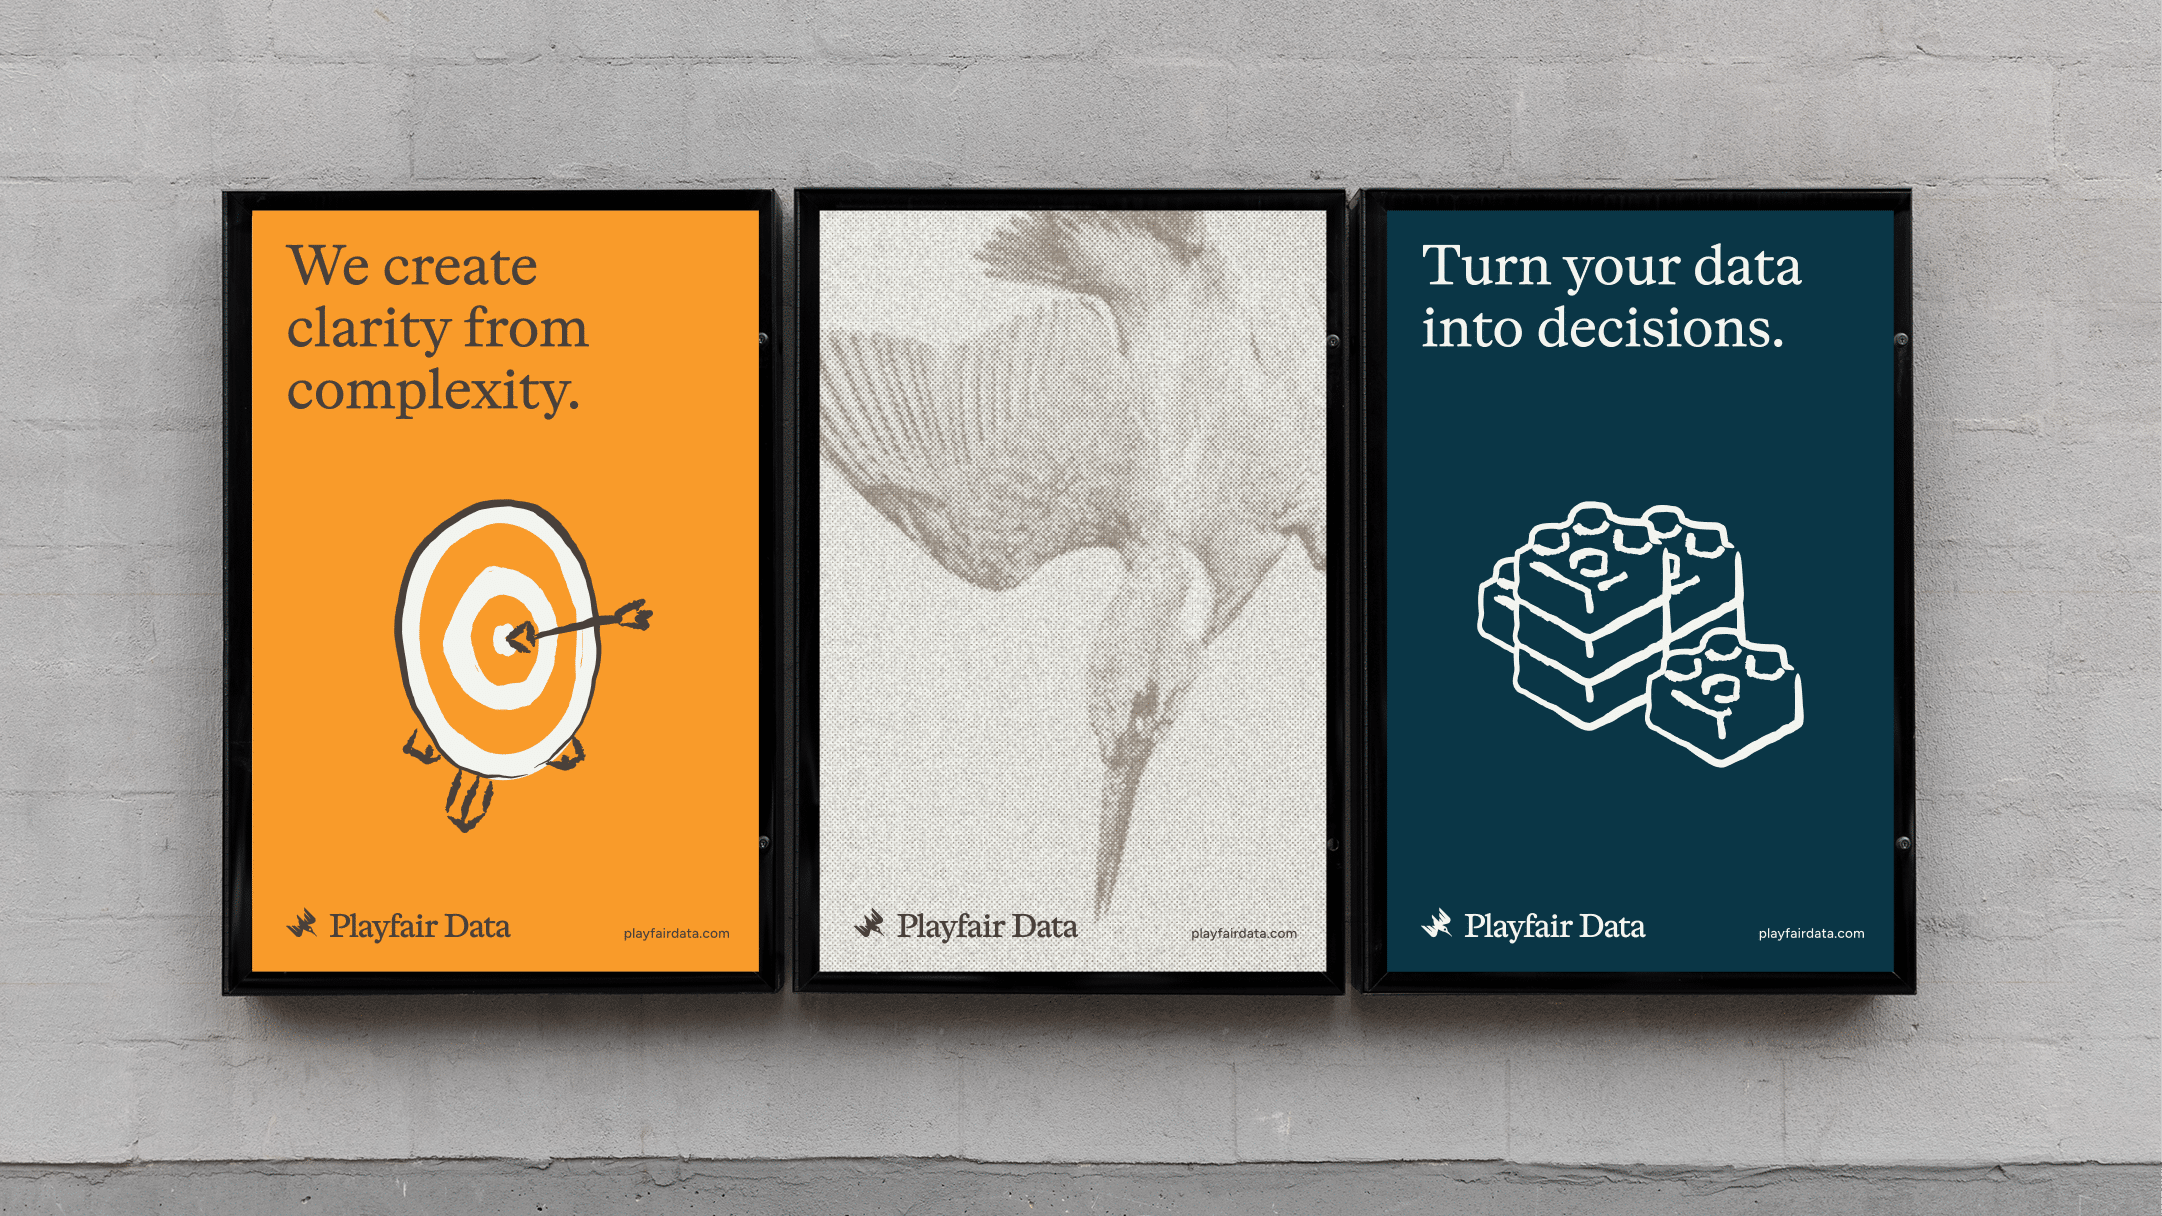
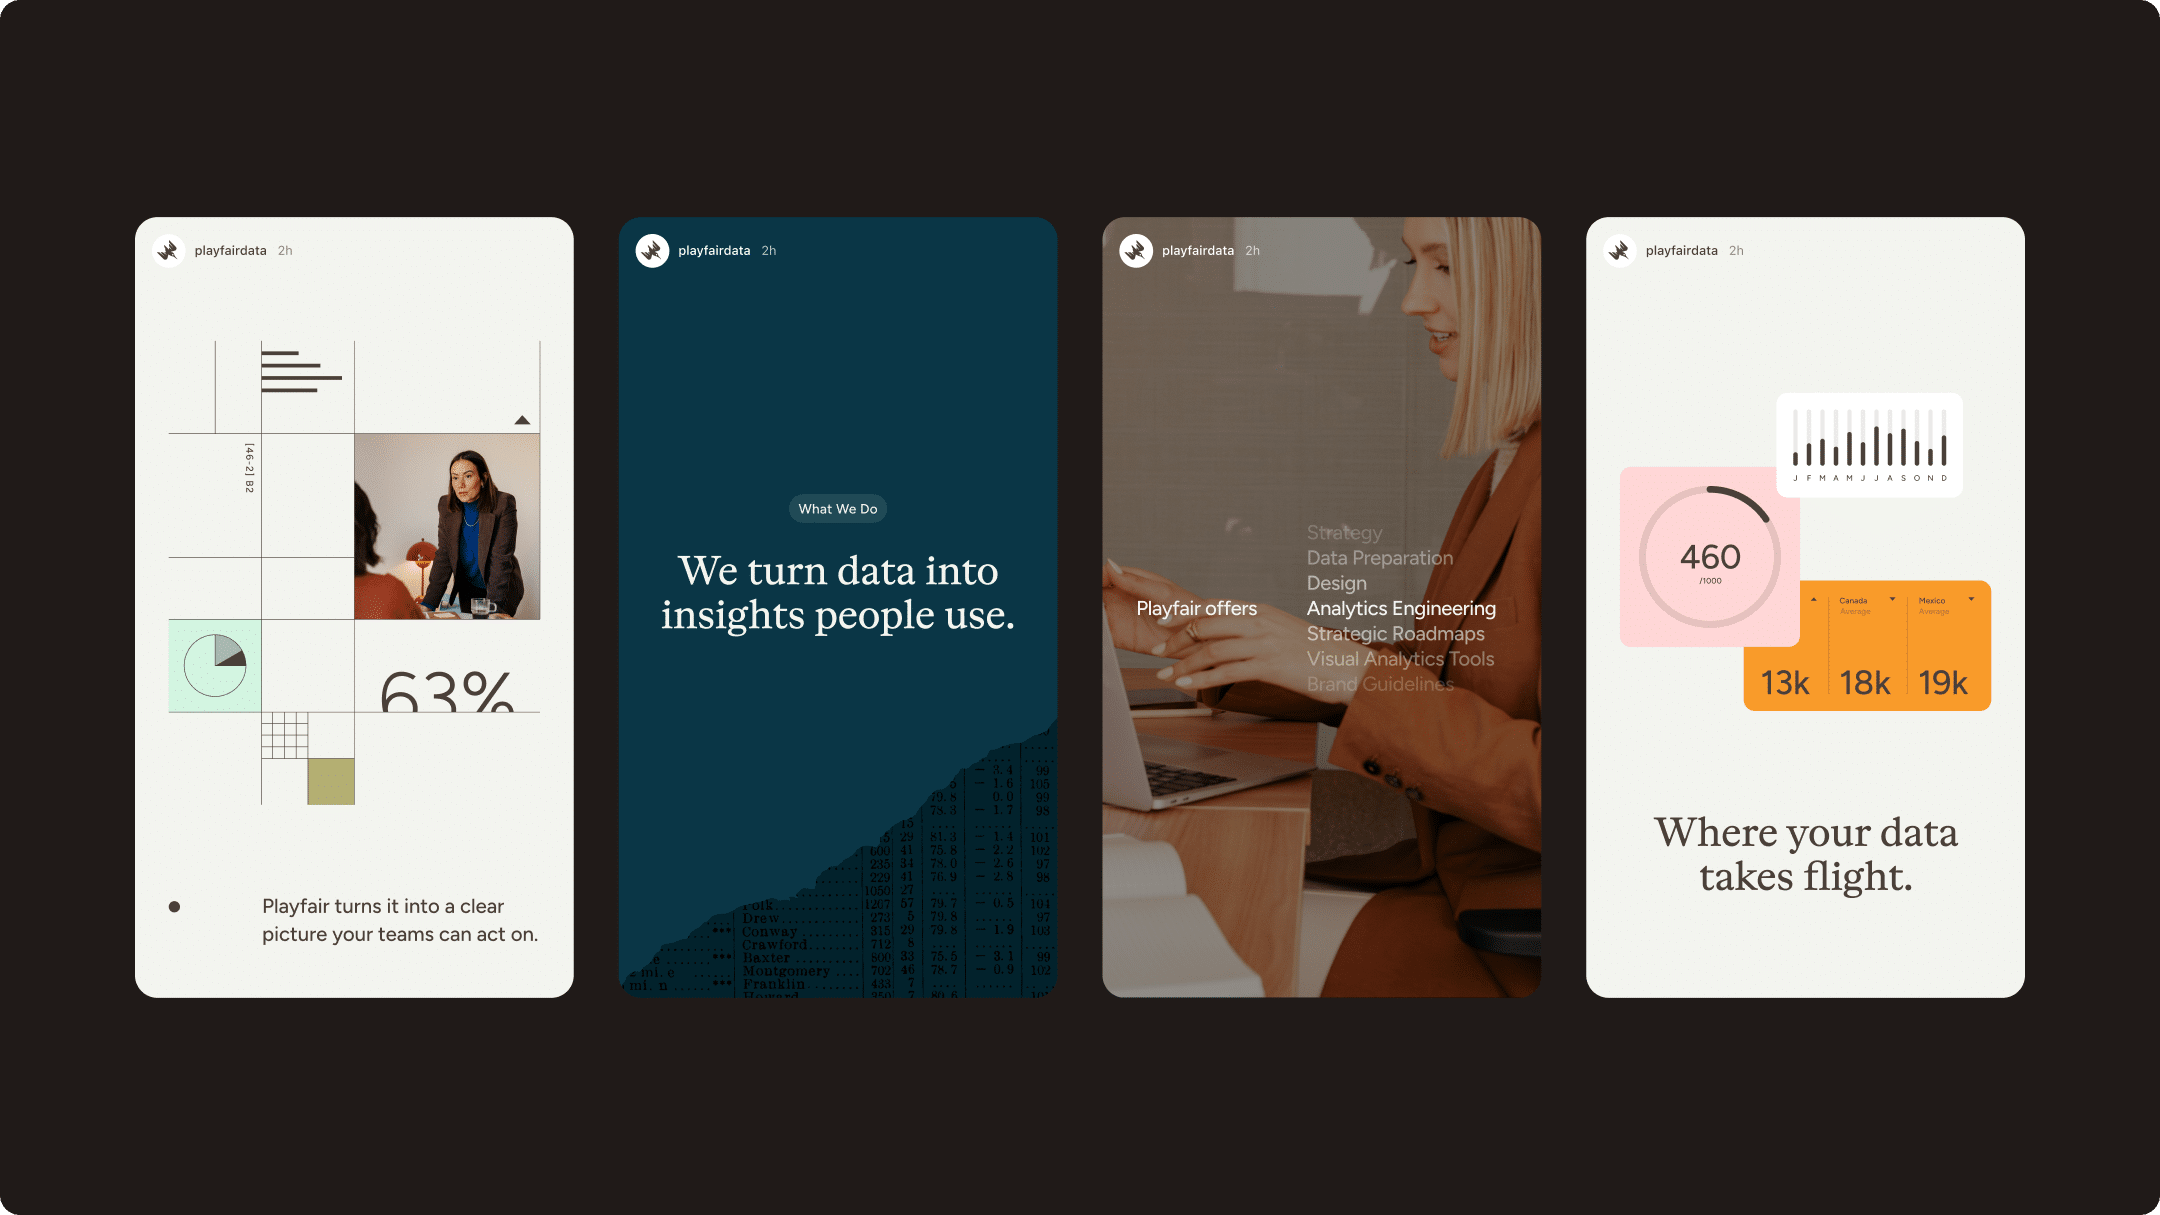
That’s why moving forward, the graphics you’ll see from Playfair Data will all fall on this spectrum from physical to digital – a visual representation of the spectrum from old to new.
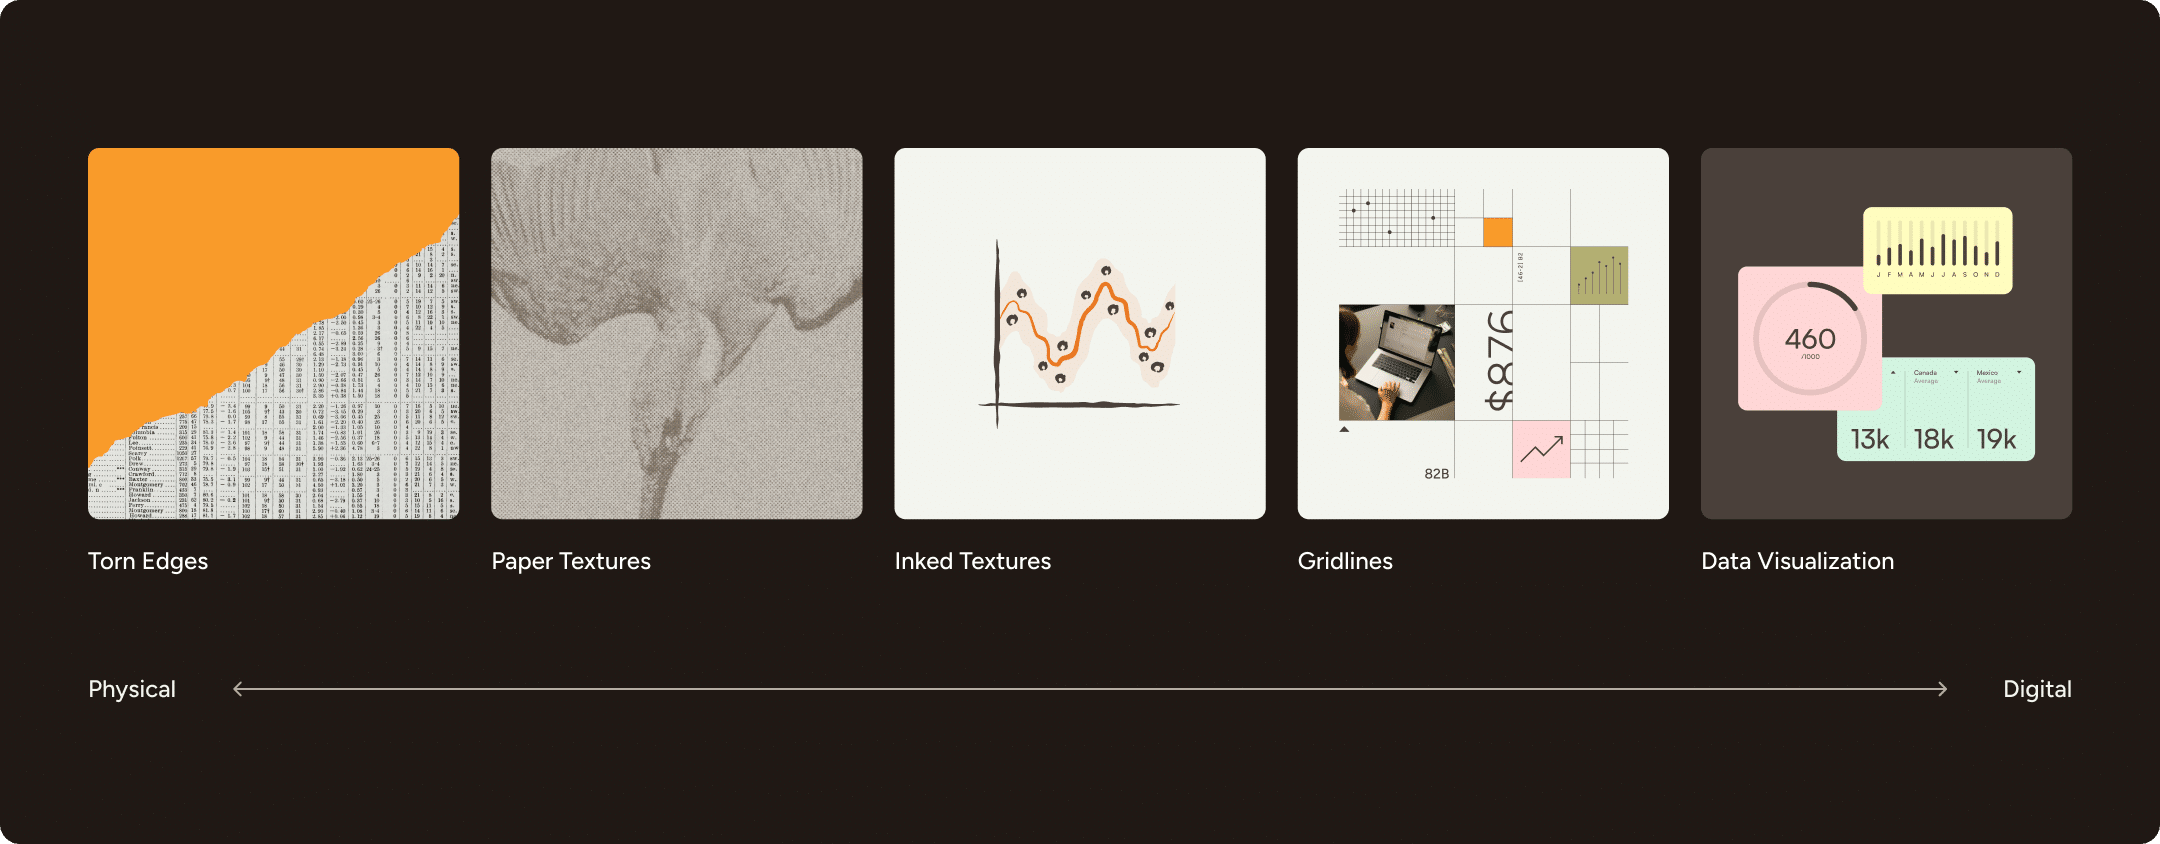
Here is a vision for how the combination of our new logos, colors, and graphics may manifest in the physical world.
Here are more examples from the digital side of the spectrum.
Speaking of digital experiences, I’ll wrap up this identity introduction by sharing some of the updates you can expect to see from us in the coming months.
What to expect from Playfair Data’s brand
Brand is essential to what we do in analytics, data visualization, and now AI. Not only is this a particularly private industry where data has the potential to provide a competitive advantage, but the quality of outcomes is dependent on the trust between us and our partners. There is nuance to this because data can be ambiguous, storytelling can be subjective, and competing objectives can insert bias into the process.
But at the end of the day, you can still expect the same great people behind the Playfair Data brand. The same incredibly talented data strategists, data preparation / AI-readiness specialists, interface designers, and analytics engineers will still be here to support you as an extension of your team. My hope is that this new brand identity will match our team members’ level of integrity, skill, and creativity, and be a proper visual representation of their globally positive impact in the years ahead.
From a practical perspective, here is some of what you can expect to see from our brand in the very nearterm:
- This page you are viewing is the very-first application of our new brand. We are actively rebuilding our entire website in this new brand to provide a better user experience for our visitors and Playfair+ members. The entirely new experience will be live in time for our ten-year anniversary in February 2027.
- Before the new site is live, you will see the brand incrementally rolled out in third-party touch points such as email, social media, and our digital certification provider, Accredible.
- All major resources including written tutorials, the Playfair Data Presents series of animations, Swifts dashboard templates, Atlas data visualization catalog, and training modules, among others, will receive both a brand and content update; the latter of which will ensure our content keeps up with software updates and evolving best practices in the industry.
- My fourth full-length analytics and data visualization book, Decision-Ready Data, will be released digitally as a member benefit. I can’t wait to share more details before the end of the year!
These updates will get us one step closer to reaching our ambitious mission of positively impacting the lives of at least one billion people by 2032. If you have an idea on how to use data to make a bigger impact on the world together, please don’t hesitate to reach out for a complimentary strategy planning call.
Thanks for reading,
– Ryan