Visual Analytics Consulting

The Decision-Ready Data Framework

Data is everywhere today. We translate it into a competitive advantage.

A Blueprint for Analytics Success

Today we can track, store, and process more data than ever before.

There’s no doubt data can help solve even the most challenging problems and provide a competitive advantage for those who can make sense of it.

But just as we need refineries to transform raw oil into useful products, we need tools and processes to translate raw data into valuable insight.

That’s why the visual analytics consulting team at Playfair Data follows the The Decision-Ready Data™ framework to unlock the true value of data.

Let’s Team Up

White Logo Mark

Playfair Data’s Decision-Ready Data framework has been used to build hundreds of visual analytics tools – and inspired thousands more.

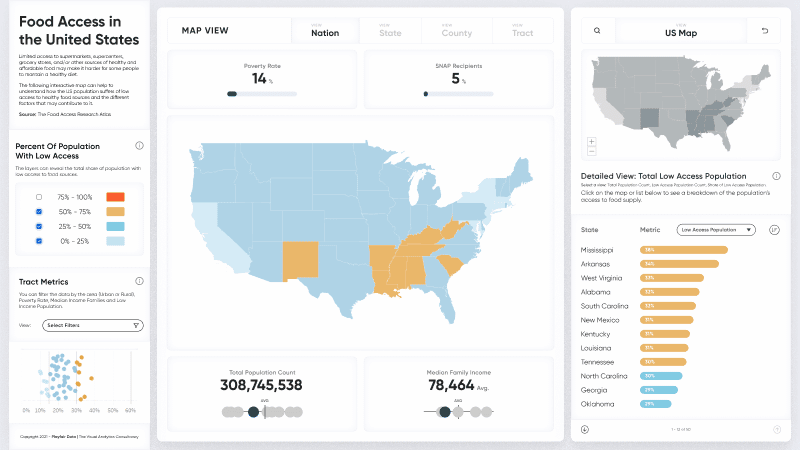
Food Access Dashboard - US
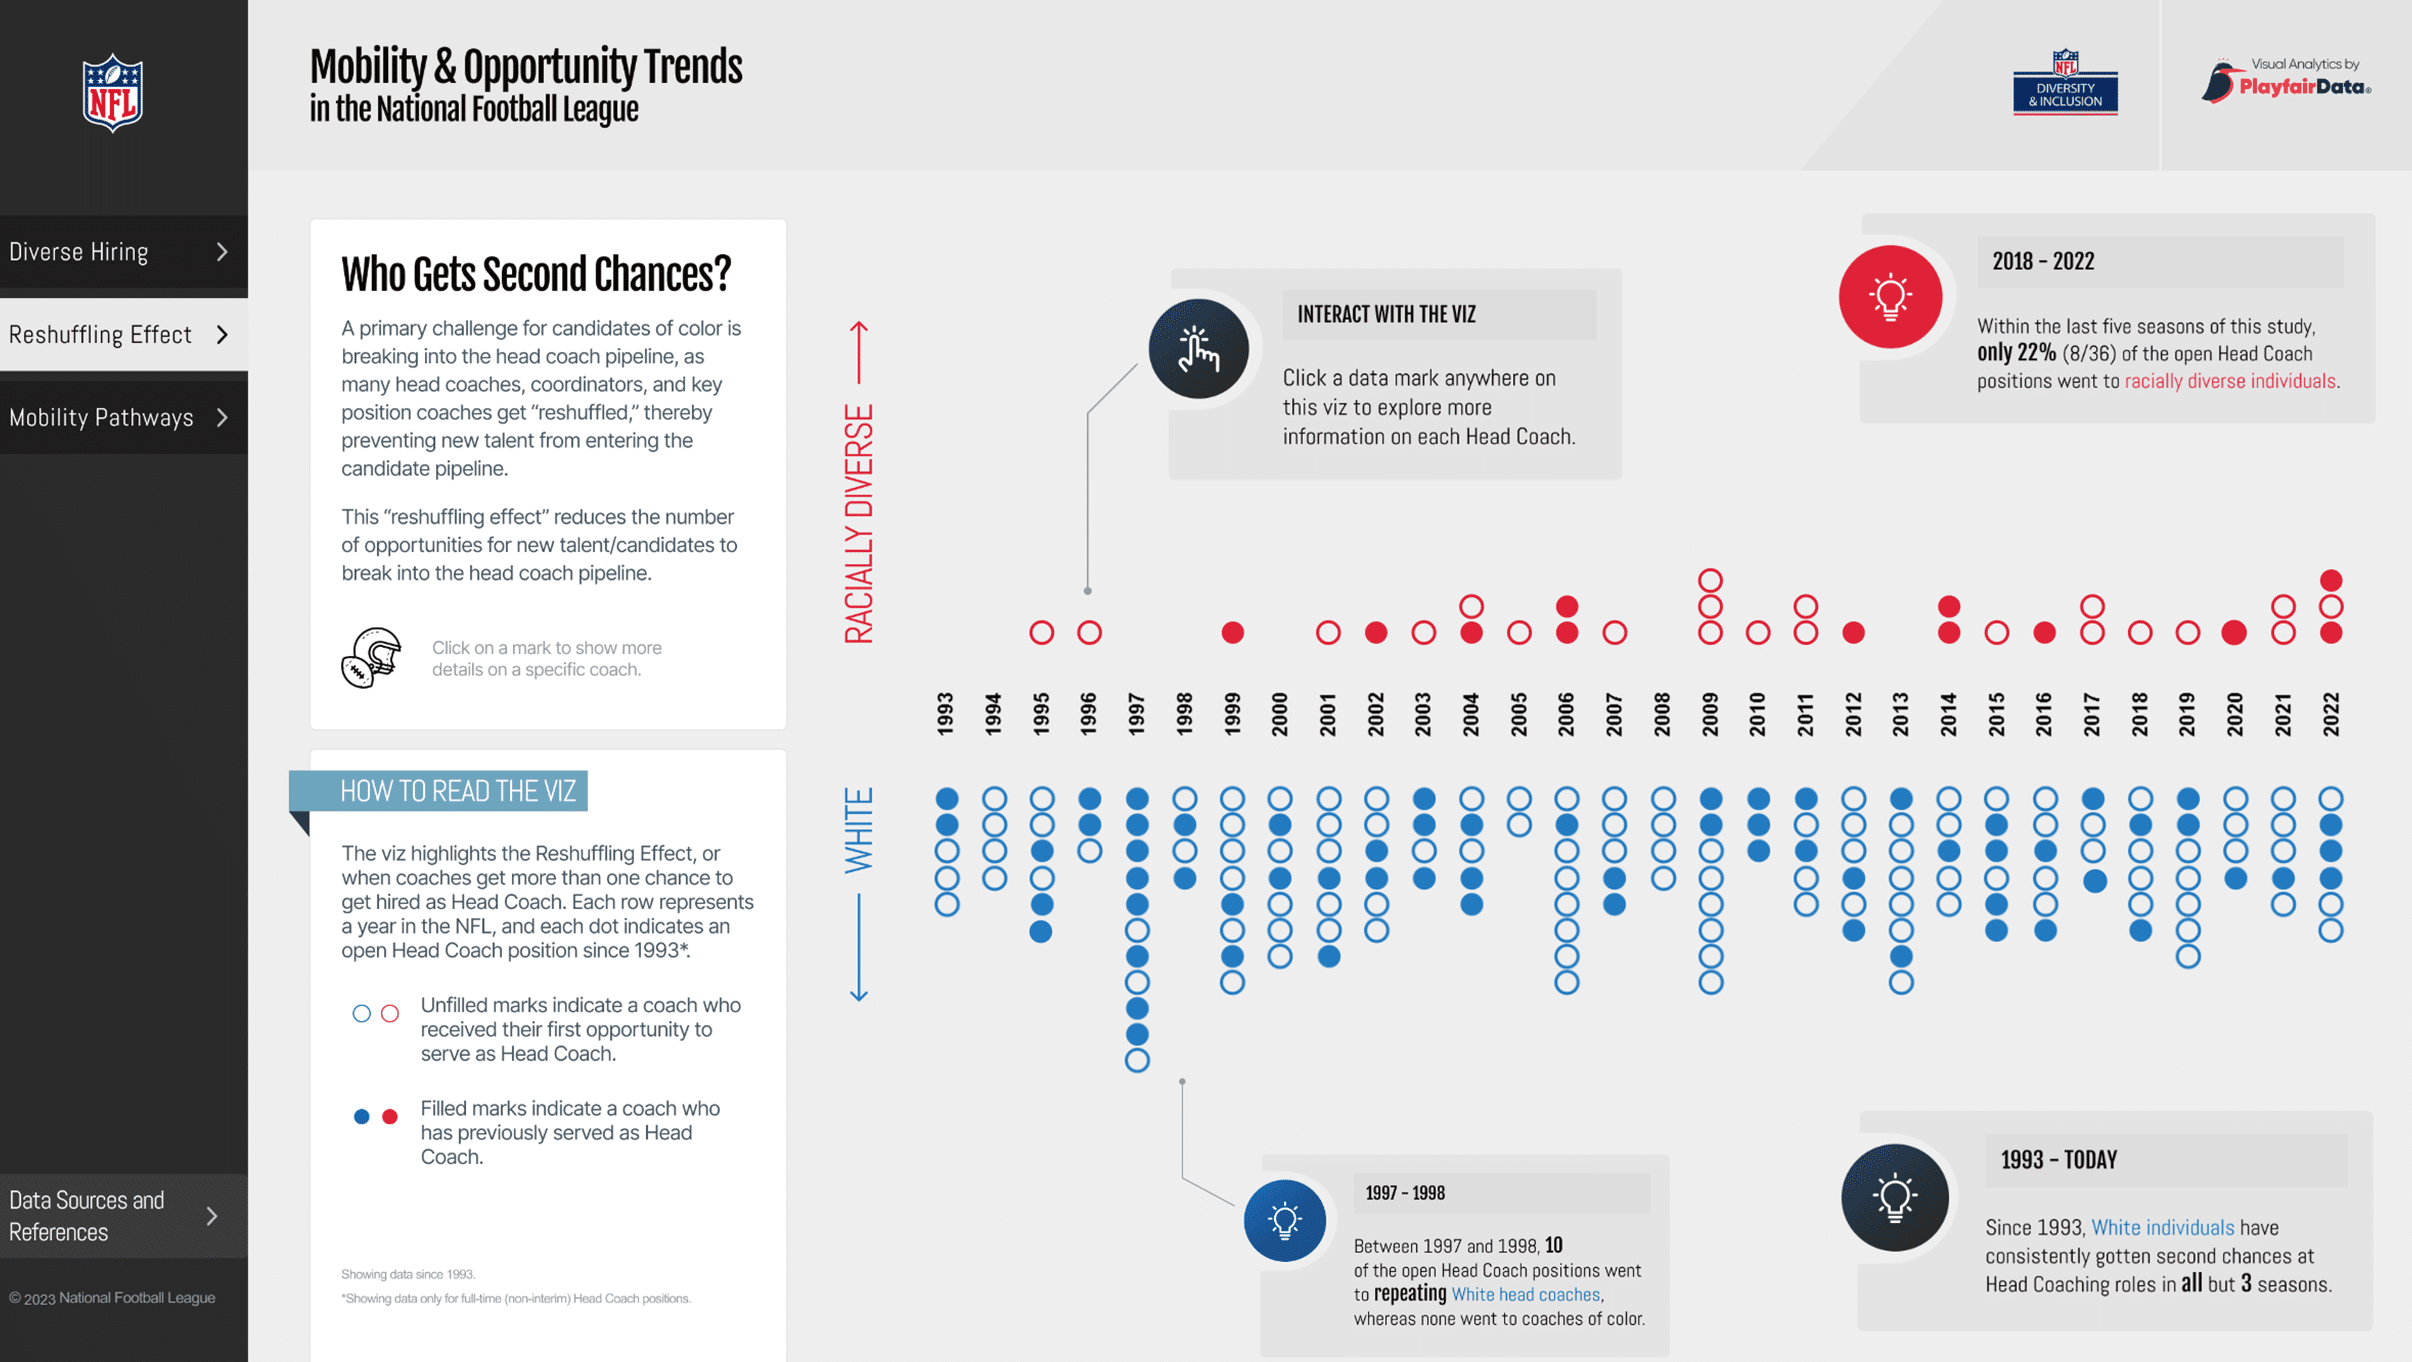
Playfair Data - Mobility & Opportunity Trends in the National Football League Thumbnail
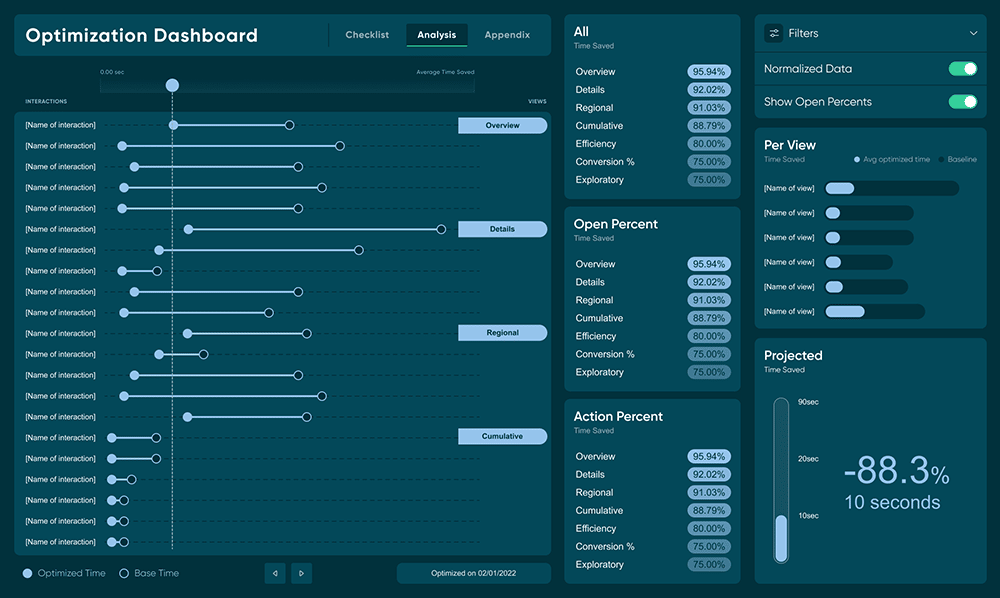
Playfair Data, Tableau Performance Optimization Dashboard@2X
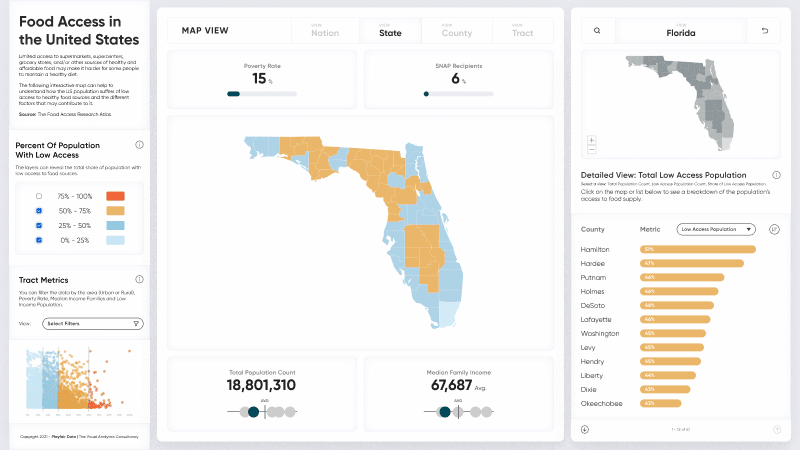
Food Access Dashboard - Florida
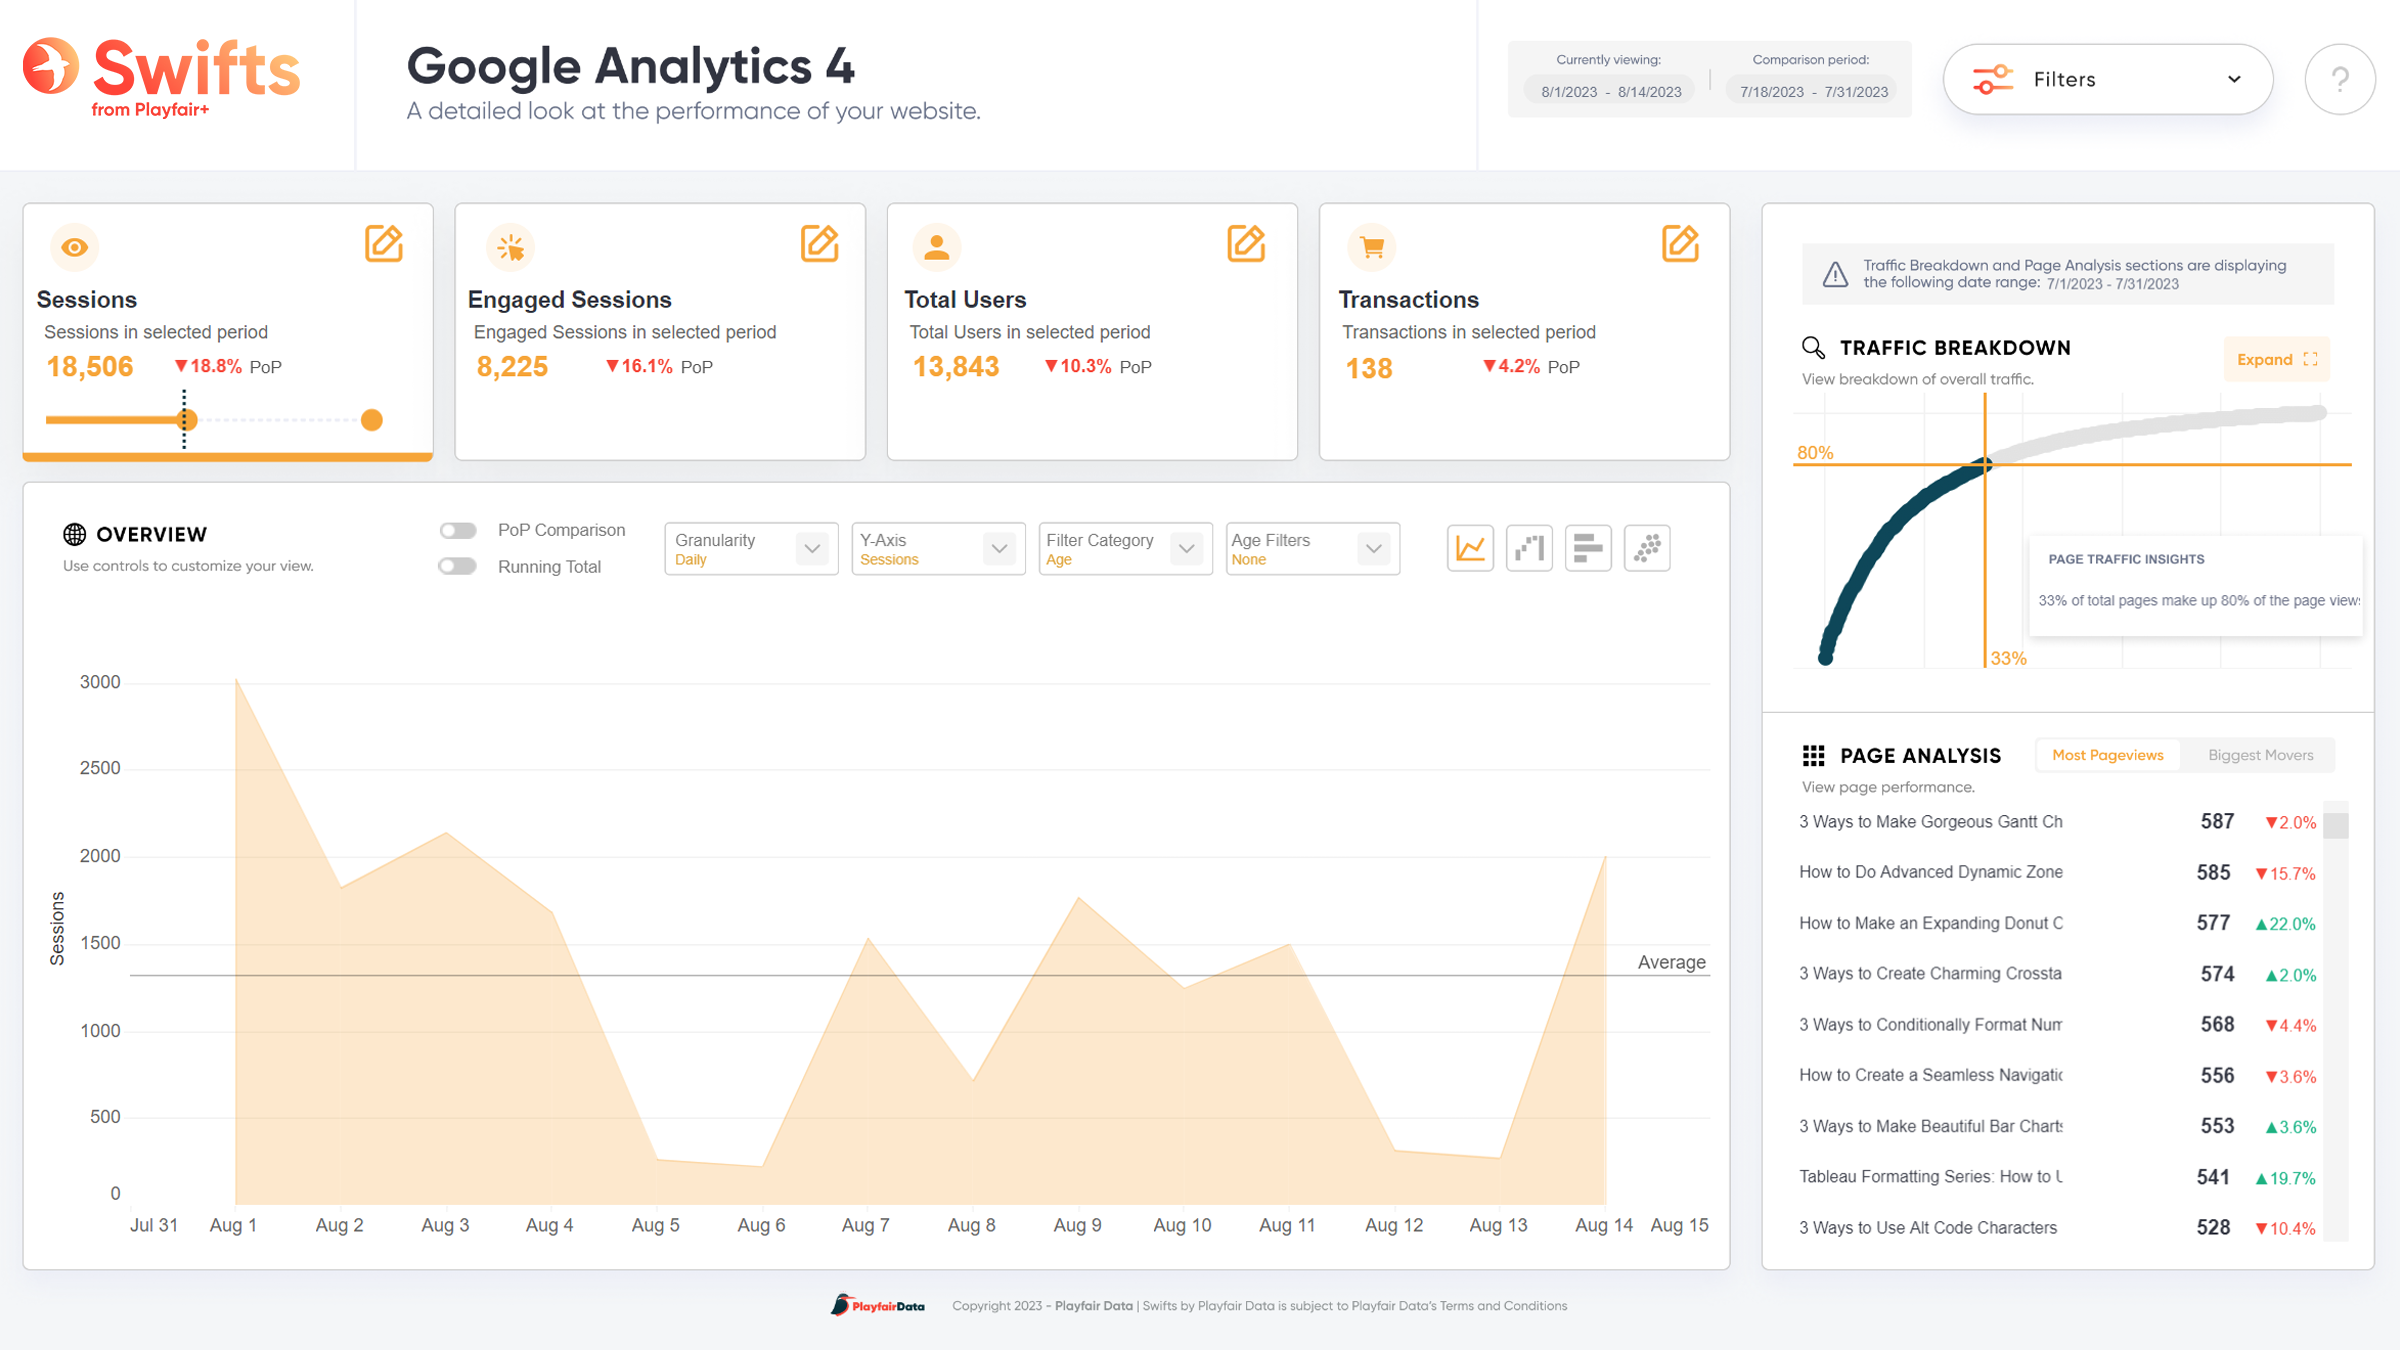
Playfair Data - GA4 Swift Thumbnail
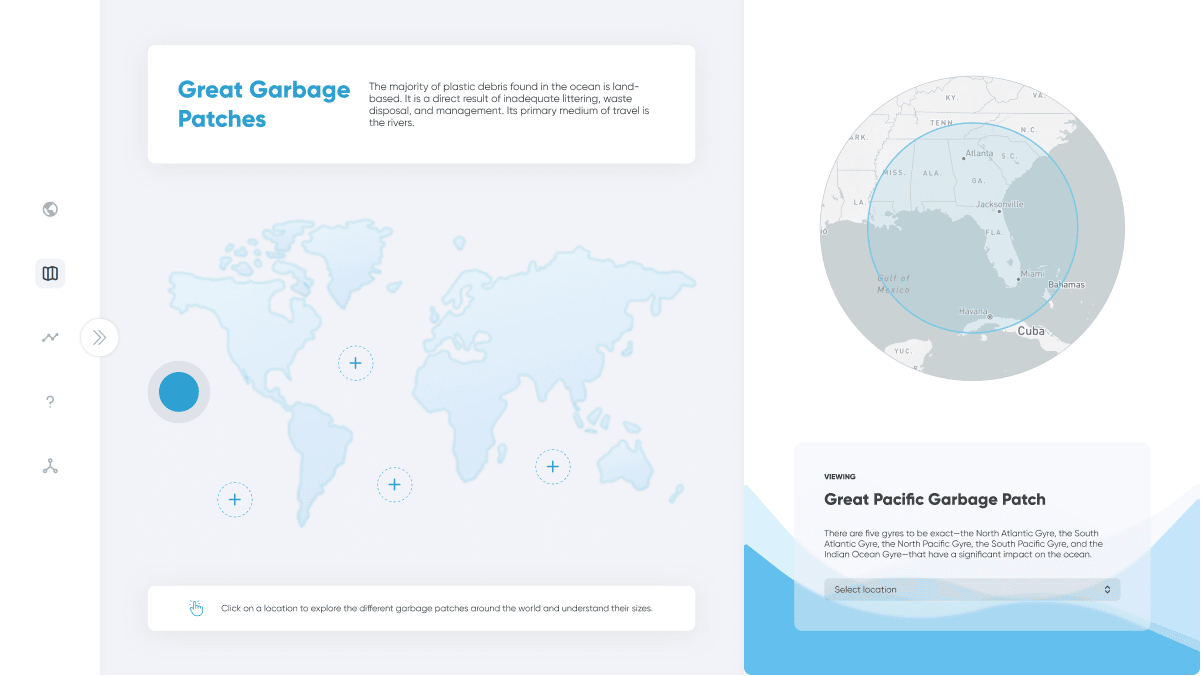
Plastics Pollution Light Mode Page 2
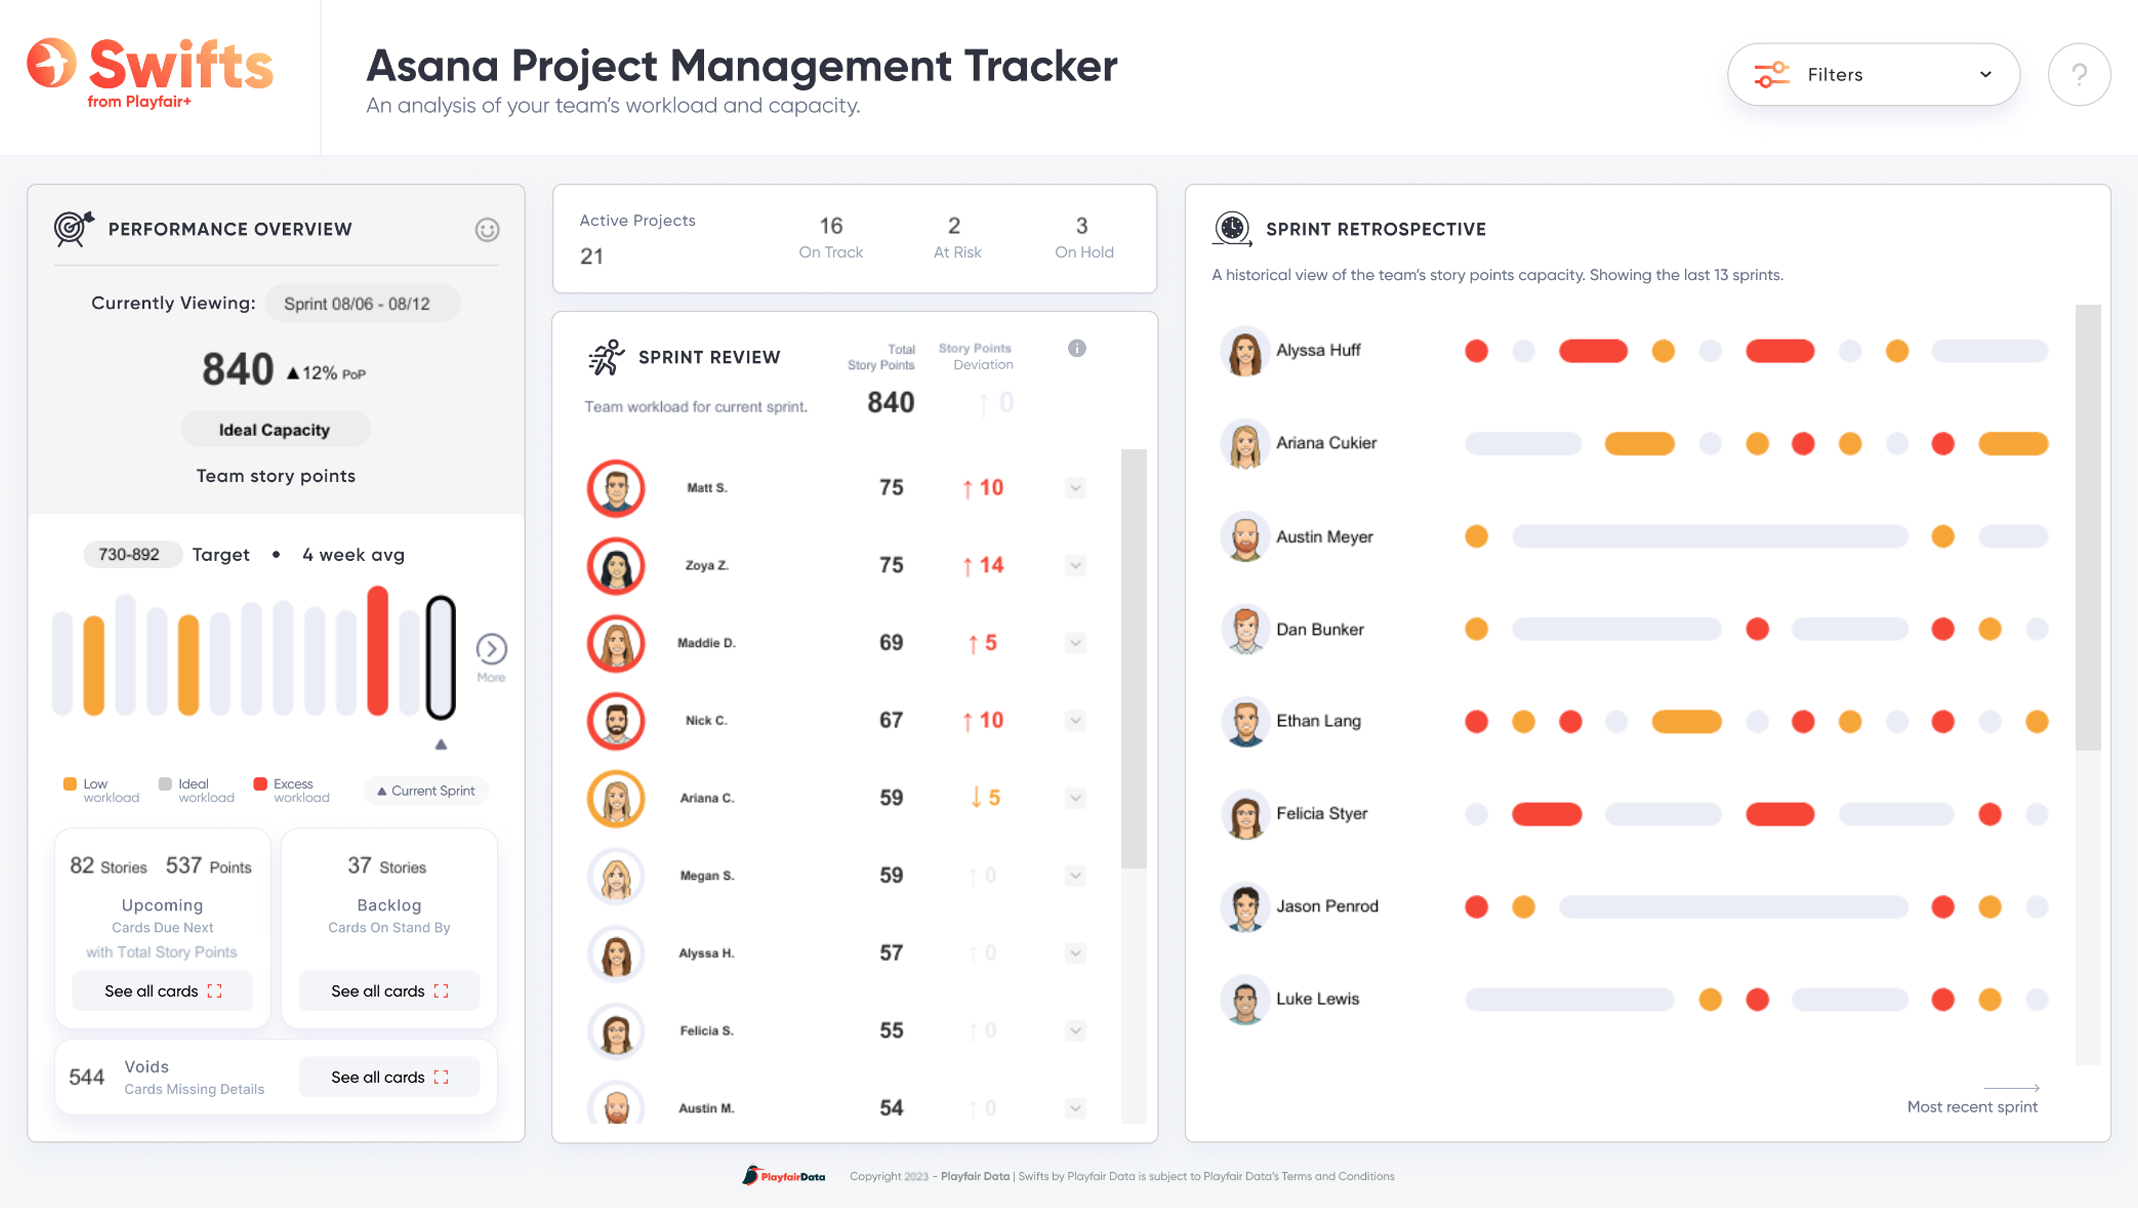
Playfair Data - Asana Project Management Swift Thumbnail
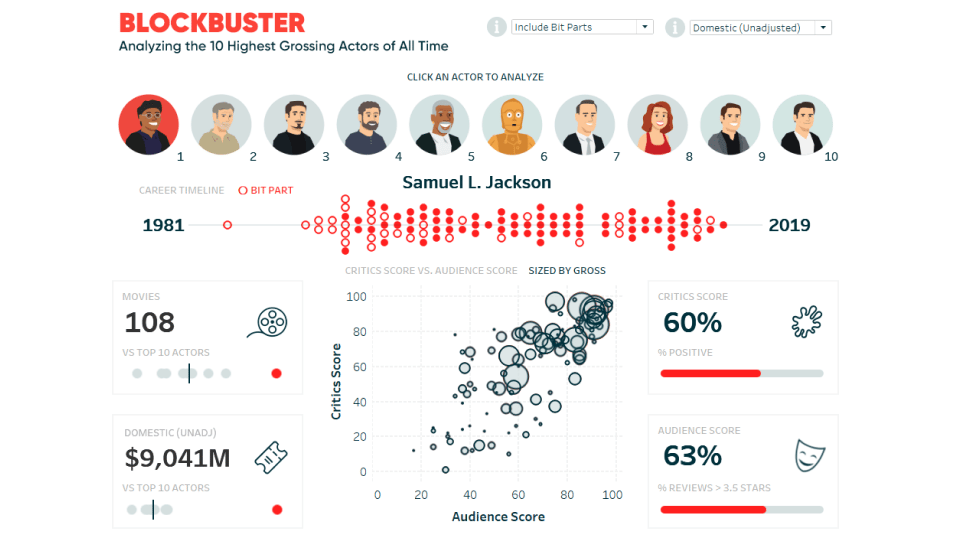
BLOCKBUSTER Dashboard by Playfair Data
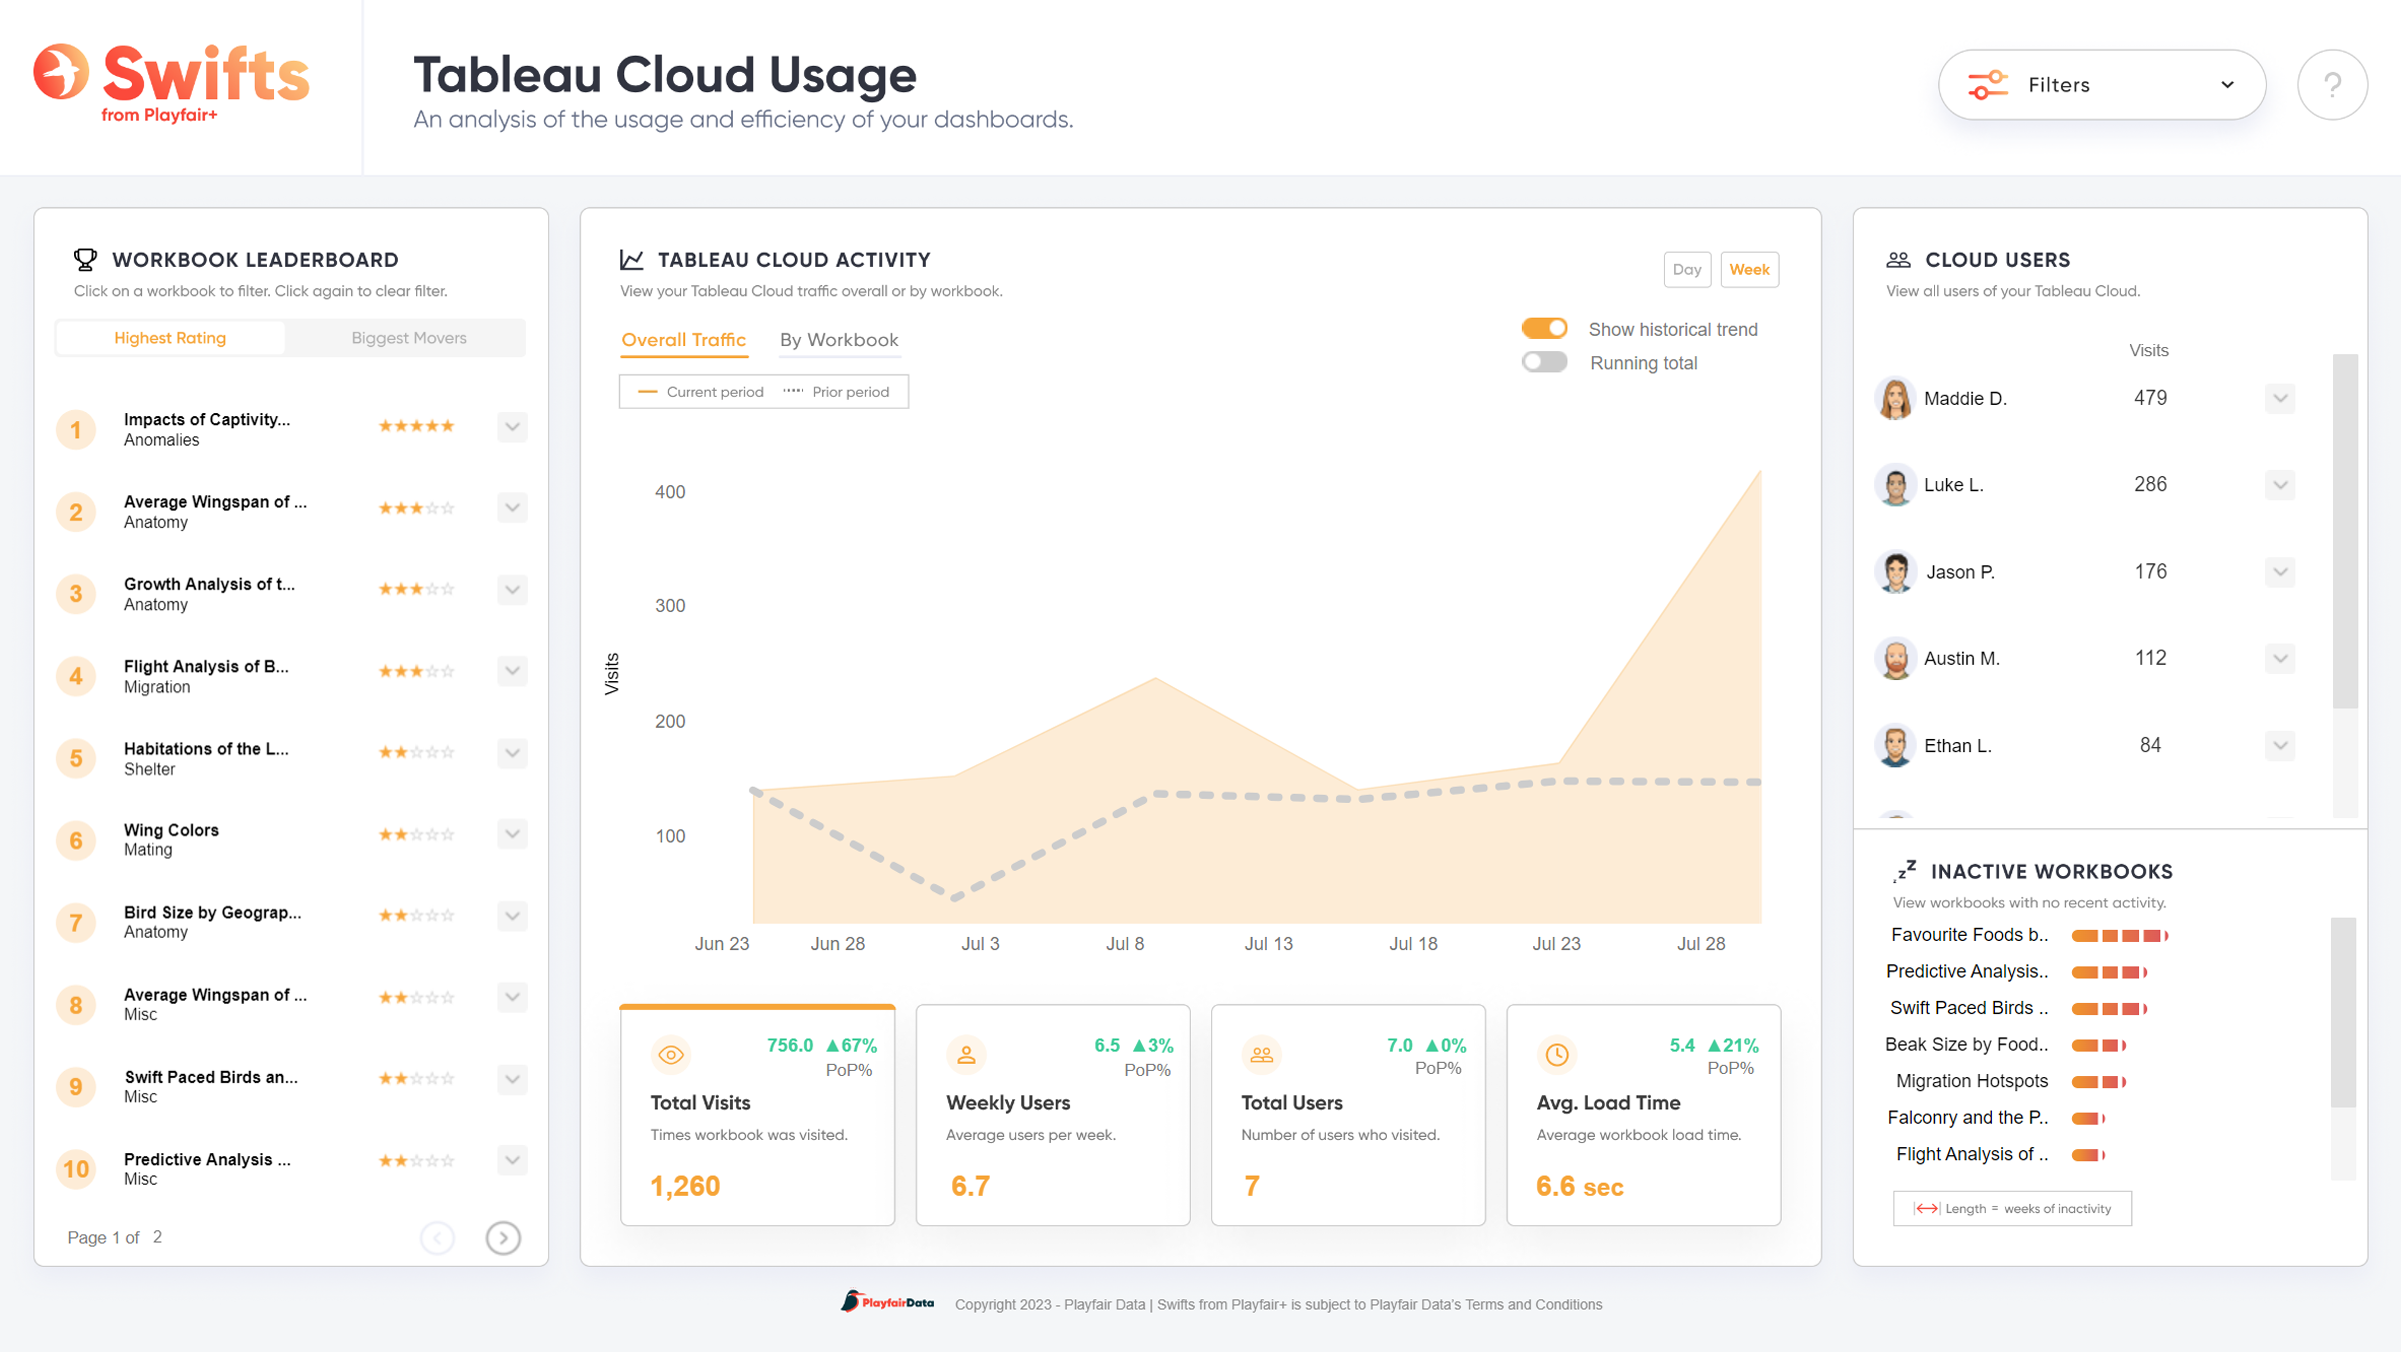
Playfair Data - Tableau Cloud Usage Swift Thumbnail
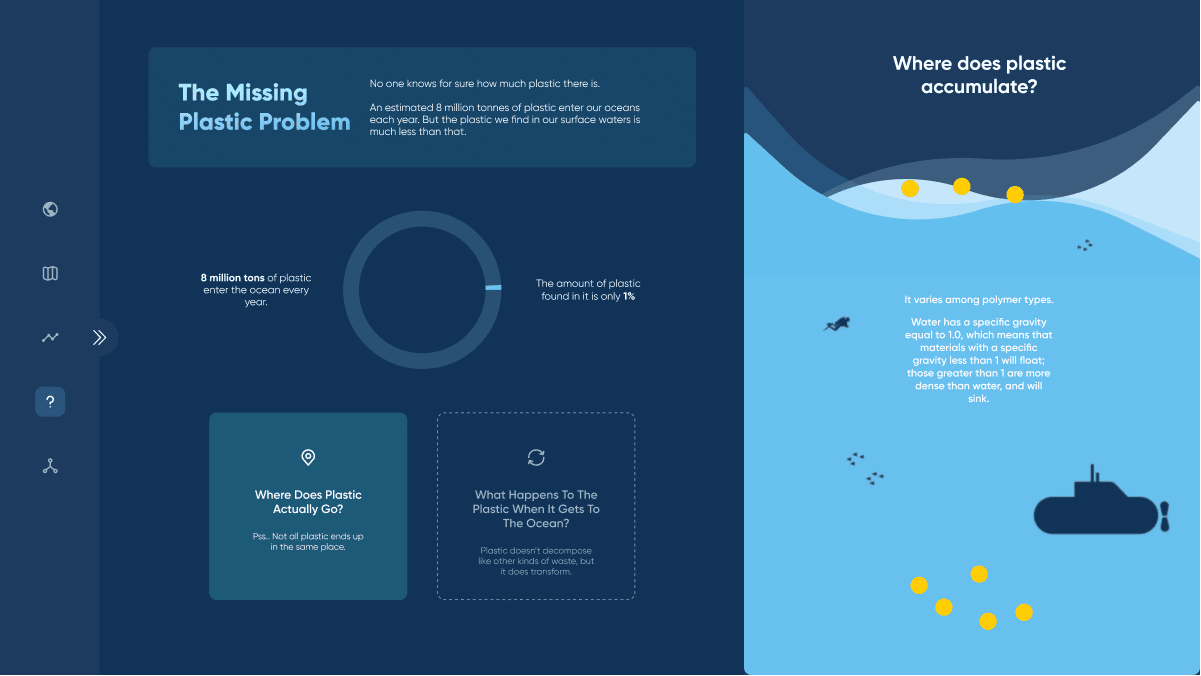
Plastic Pollution Dashboard - Page 4
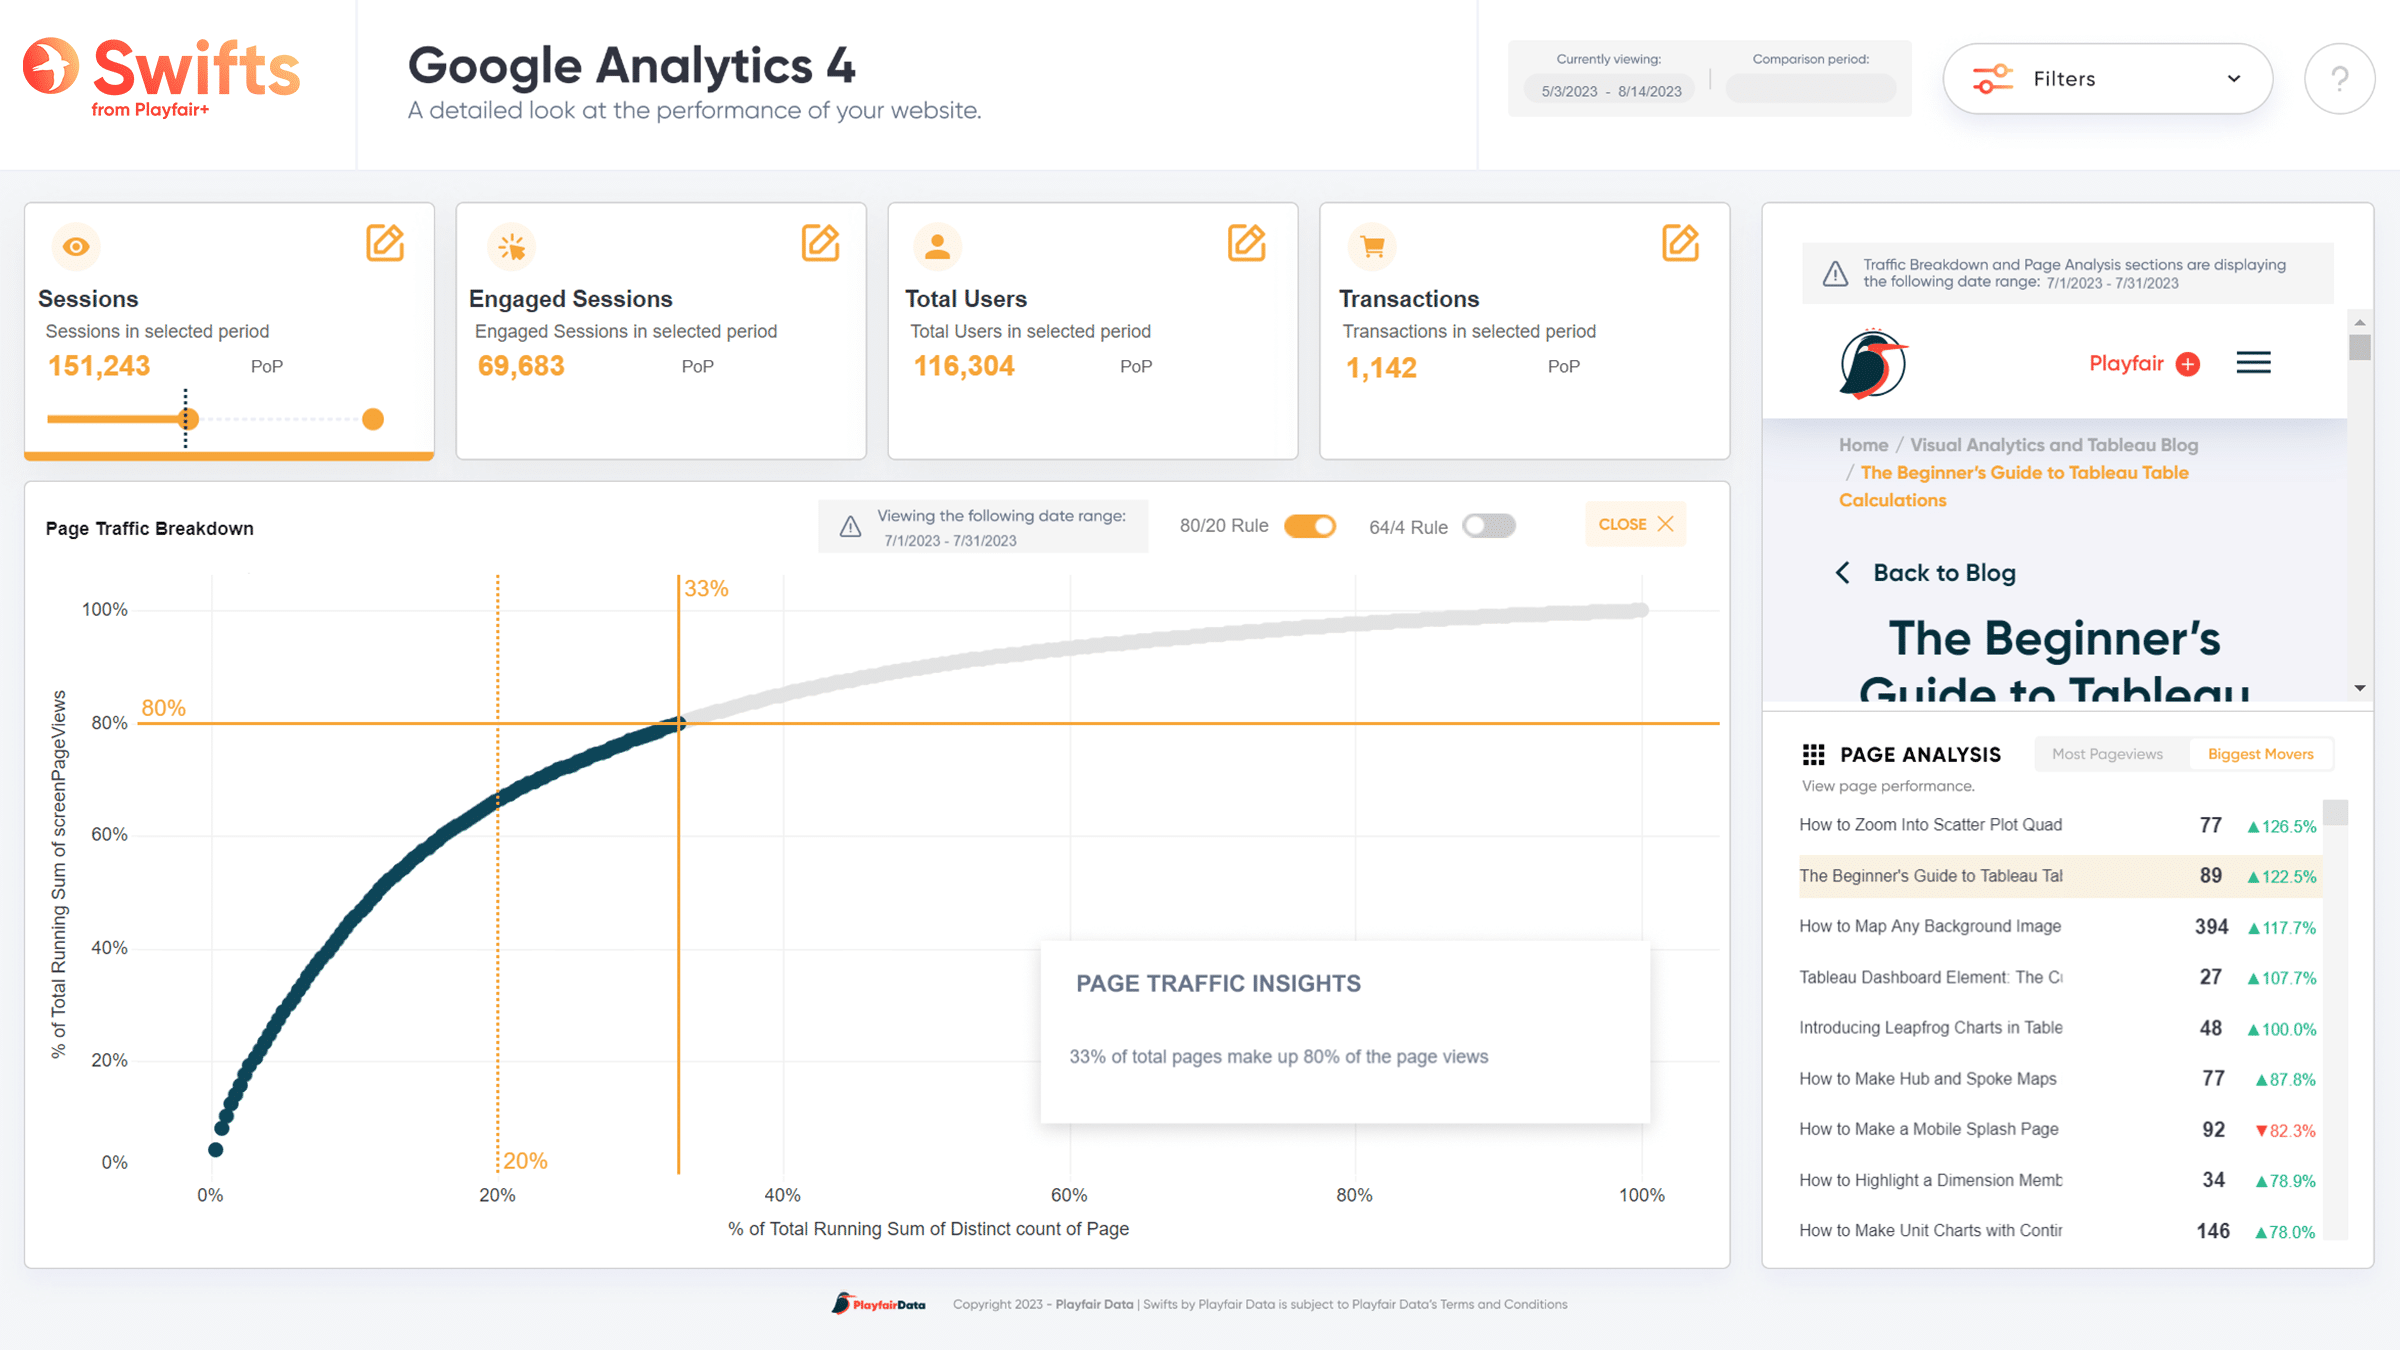
Playfair Data - GA4 Swift4

How it Works

Playfair Data uses various methods to conduct user interviews

Discovery

Where Empathy Meets Innovation.

Playfair Data has backgrounds in analytics, psychology, user experience, business, and more. Our visual analytics consulting team puts this experience to use by working with stakeholders to understand their objectives and unique business needs. We find that making personal connections within organizations leads to the most valuable and innovative solutions.

Playfair Data's data engineers shape data for final visualization

Data Engineering

Under the surface, it’s science.

To create visual analytics tools that look good, perform great, and provide value, it’s critical to have a firm understanding of what data points are relevant, the grain of the data, and how the data is aggregated.

Playfair Data will use technologies such as Alteryx, SQL, and Tableau Prep Builder to create optimal data workflows that can be automated for sustained insights. We also have the expertise to apply analytical methods to make those insights statistically significant – giving you the confidence to act on findings.

A visual analytics tool being developed in Tableau

Dashboard Development

Data’s “Rosetta Stone.”

Humans are not wired to read the vast amounts of data available today. Just like a foreign language, we need a translator to transform raw data into something meaningful.

Data visualization is that translator.

We believe in this so much that our name is a nod to the inventor of data visualization, William Playfair. Our promise is to make even the most complex data easy to understand, and to make the visual analytics tools we create look engaging and feel intuitive.

Playfair Data can deliver to your own Tableau Server or Tableau Online

Distribution

Vision drives decisions.

The primary goal of everything we build is to spark positive action in your organization. To achieve this, the last step is transferring control of analyses from ourselves to stakeholders and getting insights into the hands of decision-makers. We can distribute visual analytics tools with everything from local PowerPoint presentations to fully automated Tableau Server dashboards.


Looking for a visual analytics consulting partner?

Learn about our pilot project engagements.


Learn More