3 Innovative Ways to Use Filters in Tableau

Tableau filters are a dashboard engineer’s best friend. They help us convey a story, enhance the user experience and stay flexible to adjust to changes. But sometimes, a basic filter doesn’t have the capabilities that we wish for in our dashboards.
This blog will give you three tricks using filters in Tableau that will make the engineering process much easier. The techniques covered reach from contextual set actions, to control sheets and an “ALL” reset trick to override a selection. Caught your interest by now? Then let’s get started!
How to make contextual set controls
With the introduction of Tableau 2020.3, Tableau brought in additional functionality to their sets and set controls that allow you to show only values that are within context. That means if you are using filters in your worksheet and add them to context, your set control list will only show values within these specified parameters.
![]()
What I like about sets is they can be dynamic or static, depending on how you set them up. In addition, by using set actions, you are giving your audience the ability to add or remove values from a set. This will have a direct impact on what will be displayed on their dashboard. In many ways, sets can act as your filters as they make it possible to designate not only inputs for your calculations but also expand the possibilities of making your analysis more interactive and personalized.
Continue reading with a free account, or login.
Unlock this tutorial and hundreds of other free visual analytics resources from our expert team.
Already have an account? Sign In
By continuing, you agree to our Terms of Use and Privacy Policy.
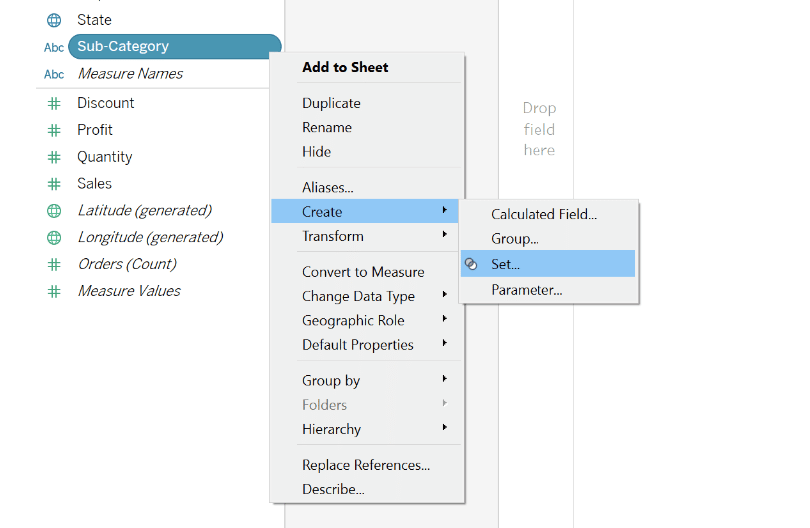
To create a set, right-click on the dimension that you want the set drawn from, hover over Create, and choose Set.
An Introduction to Tableau Sets
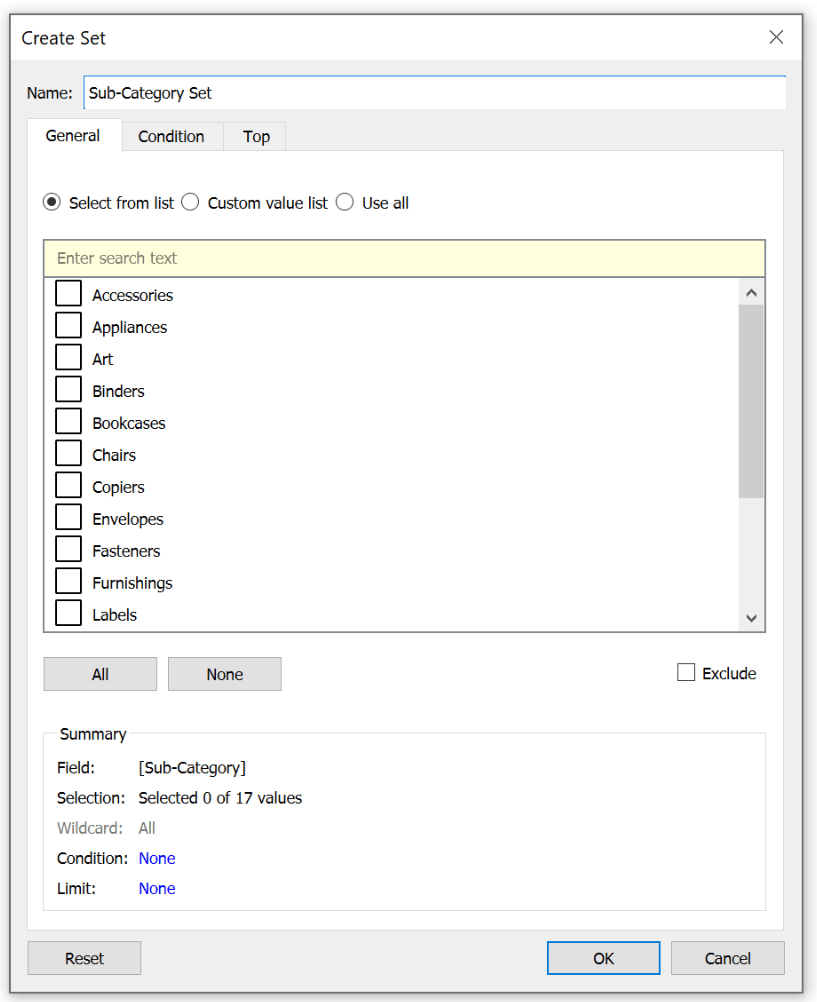
A new menu will pop up where you can manipulate the members in/out of your set or define conditions for the set. For our example, I have selected Sub-Category. I have decided to leave all of the members out of the set to better illustrate how the view will react to the context filters later on.
Now to demonstrate how the members in the set react to a filter in context, I will use the Sample-Superstore dataset and create a line chart that displays Sales by continuous Month of Order Date. To do that I will drag continuous Month of Order Date to the Columns shelf and then I will drag Sales to the Rows shelf.
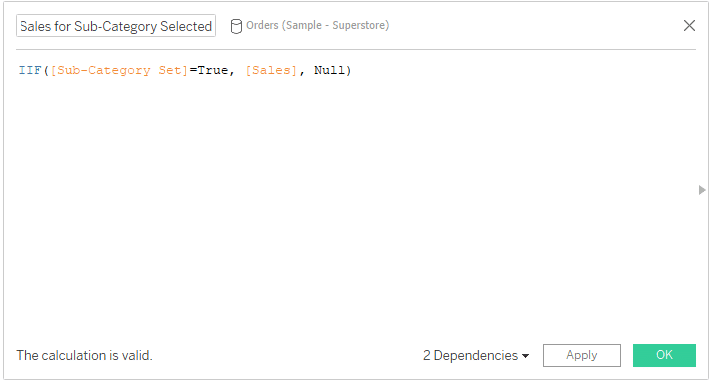
Next, I will create a new calculated field that will SUM the Sales of the Sub-Categories in my set. The formula for that calculation is a Boolean statement that will return Sales if the Sub-Category is in my set and Null if it’s out.
Sales for Sub-Category Selected
IIF ([Sub-Category Set] = True, [Sales], Null)
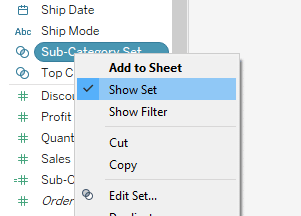
I will drag the new calculated field to the Rows shelf, right-click it, and select Dual Axis. Because we do not have any dimension members in the set, we only see the SUM of Sales. To allow the user to add members to the set I will right-click the Sub-Category Set in the Data pane and select Show Set. This will add the set control to the view and allow us to add members.
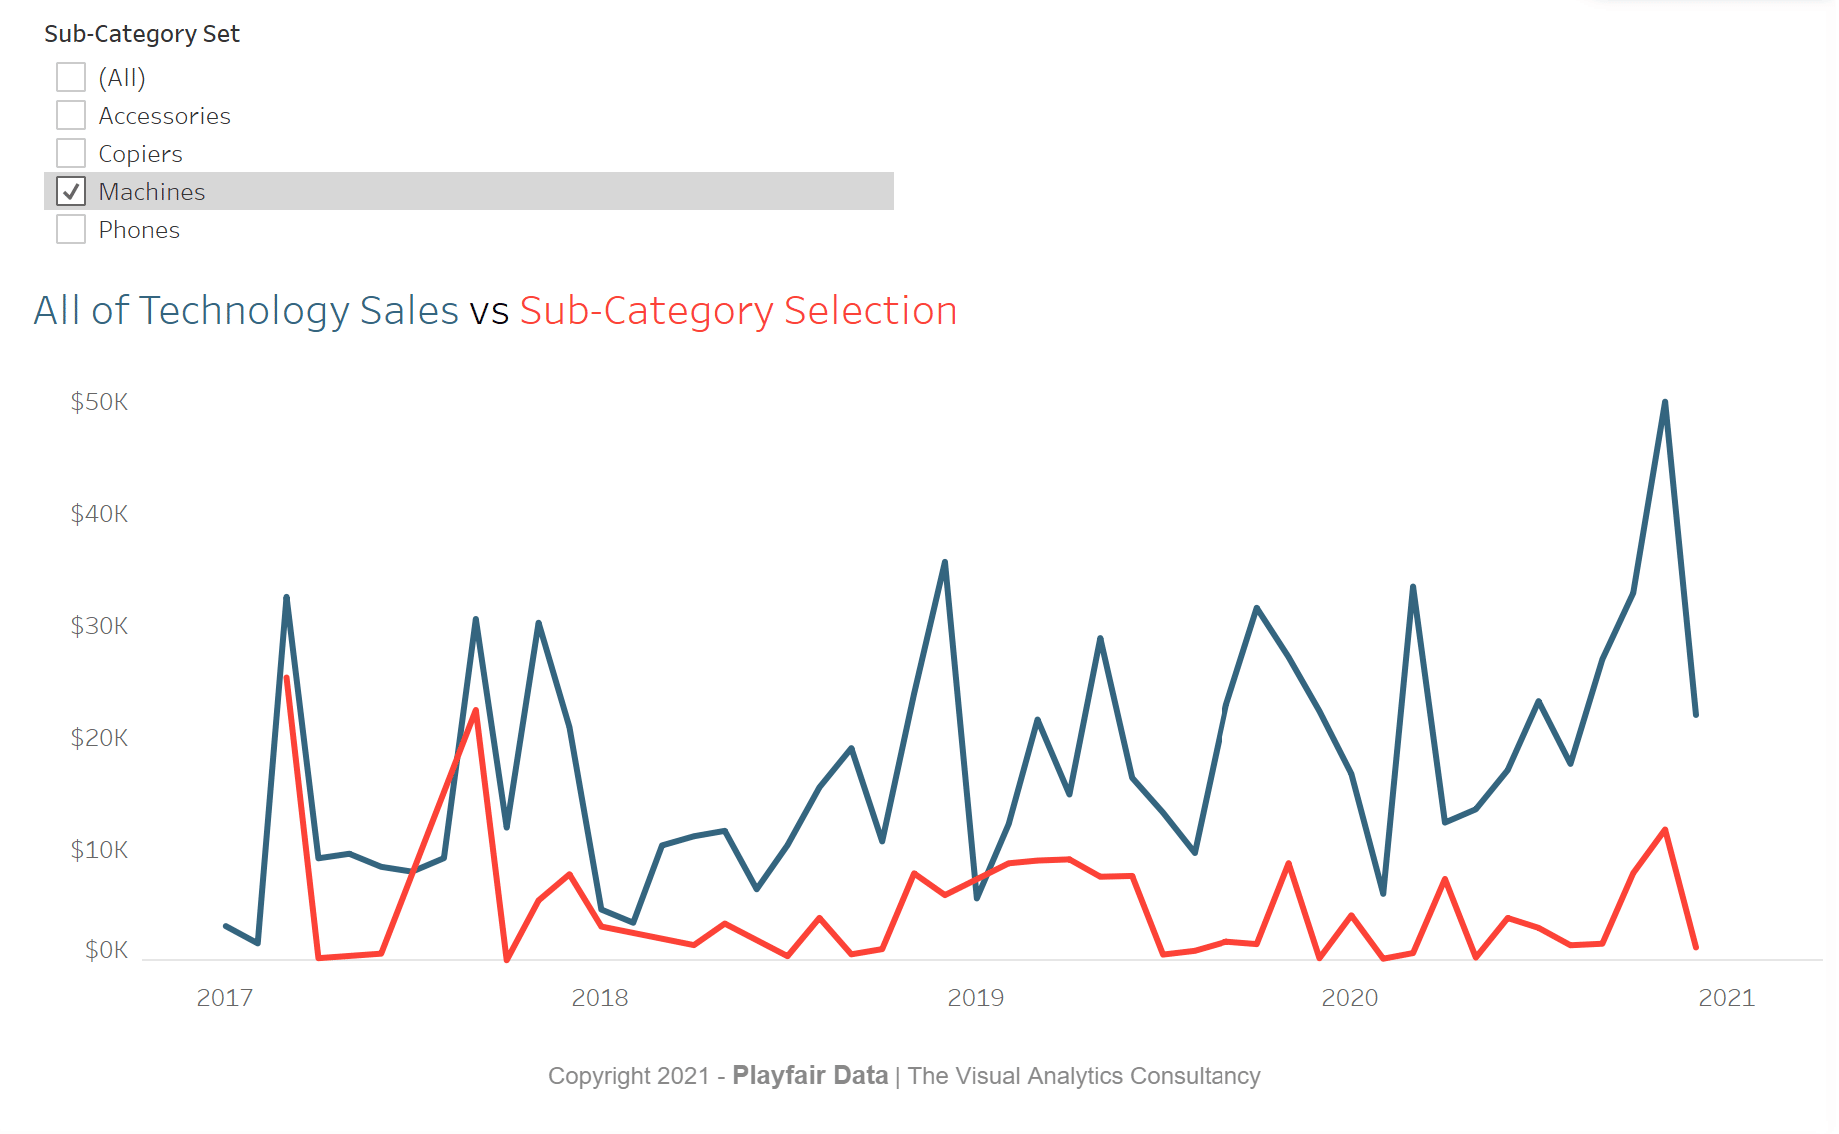
To demonstrate the set control, I am going to add some sub-categories into the set by selecting them from the set control. You can now see a second line appear that is the SUM of sales for sub-categories in the set.
Now that we have the view set up, I am going to add Category to the Filters shelf, select Furniture, then click OK. Next, I am going to right-click on the Category pill and choose Add to Context. Adding a filter to context moves it up in Tableau’s order of operations.
Tableau Filters and Order of Operations
With Category in context, I am going to click on the arrow in the top right of the set control and select All Values in Context. You can see that with Furniture selected from the Category dimension, we are limiting the Sub-Category set control to only values relevant to the context filter.
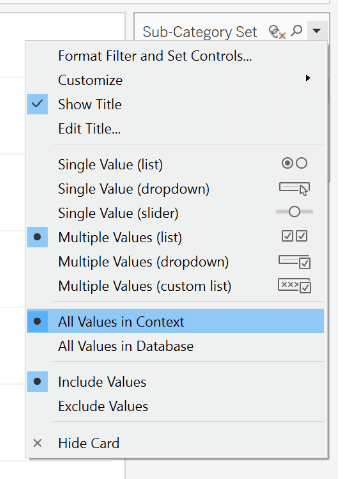
The advantage we gain from this change is decreasing our set control list from 17 to 4. We can also use sets to select multiple values at the same time allowing even more flexibility than parameters.
How to filter using control sheets
A control sheet is a sheet showing dimension members that can be used to override parameter values in Tableau. These selections can be paired with filters in your visualizations or calculations to display the user’s selection. The advantage of creating a control sheet is that it gives you a way to create a unique user experience and allows you to filter the list down to more relevant choices based on other user selections.
Let’s make a use case with the Sample-Superstore dataset. I will use a control sheet to override a parameter that I created that contains all sub-categories. Let’s assume I am the manager of the Technology department of the South region. I would like my selection of sub-categories to only show relevant options for my department and area of interest. I can do so by adding dimensions to the Filters shelf of the Control Sheet worksheet. That gives you additional functionality, if you make those filters that drive the list dynamic as well so when the manager for the east region wants to look at his list, he can personalize it for his/her wishes as well.
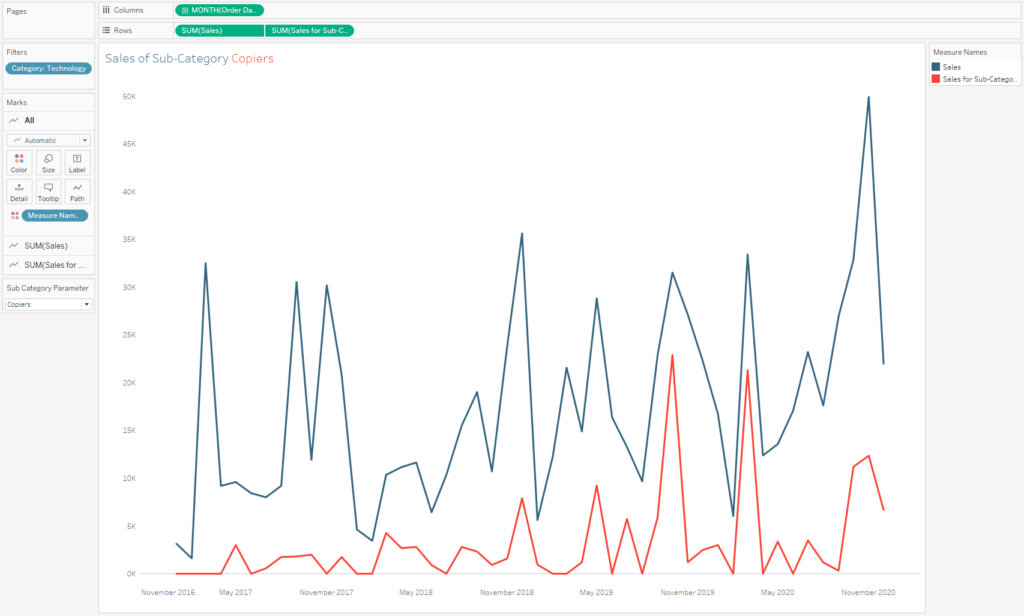
I know this has been a lot of theory so let’s get you an example of how we could use control sheets directly in the Sample-Superstore dataset. I am going to start by recreating the same line graph I used in the last section by dragging Sales to the Rows shelf and Continuous Month of Order Date onto the Columns shelf. Last but not least, to make it comparable to the previous line chart, I am going to drag Category into the Filters shelf and select Technology.
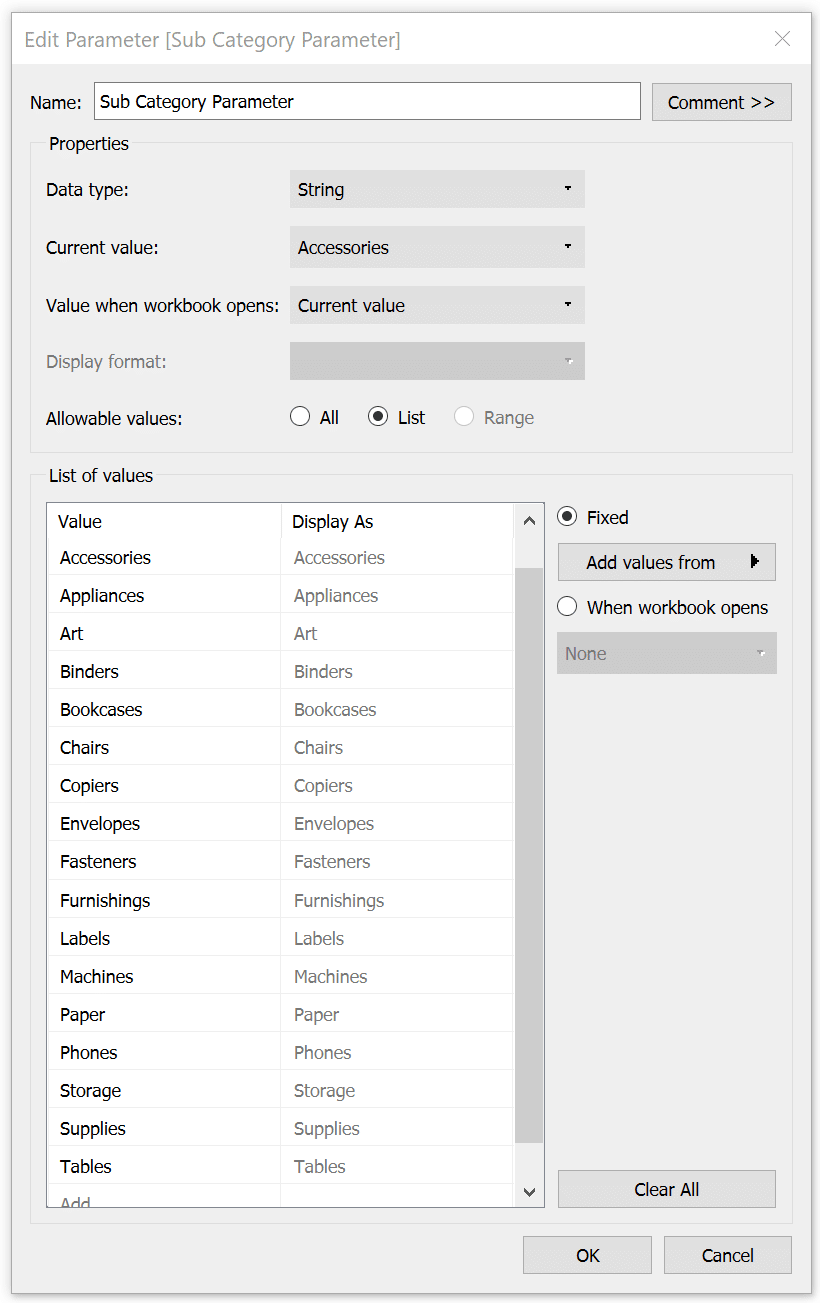
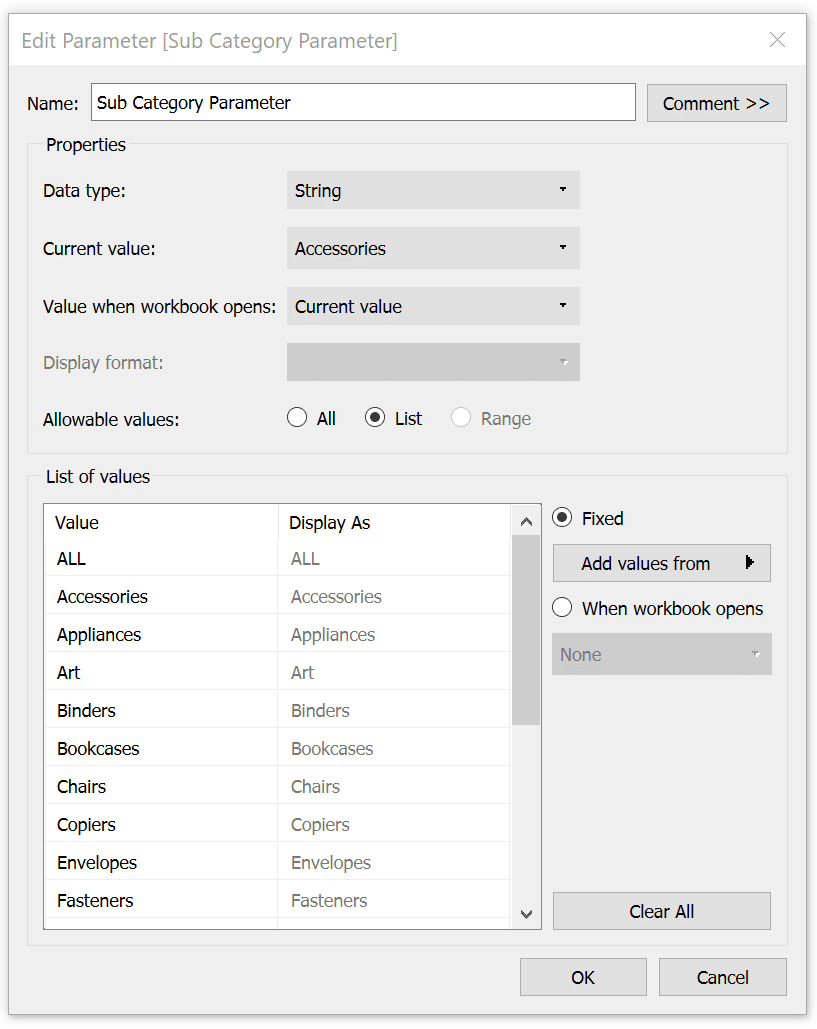
Next, I am going to create a Parameter called Sub-Category Parameter with a data type of String and a List containing all the sub-categories from our dataset. Rather than typing these in I am going to click on Add Values From to the right and select the Sub-Category dimension from the list.
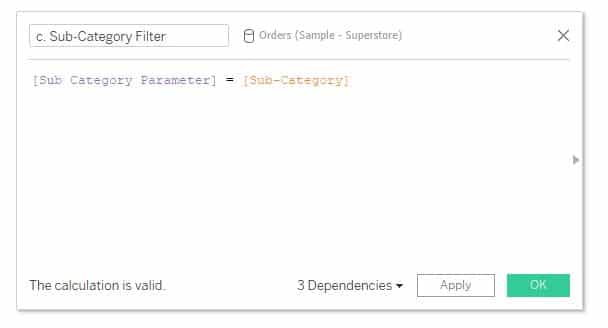
After that I will create a calculated field that will act as a filter for my line graph. I usually call fields like that “Sub-Category Filter”. By adding “Filter” in the title of the calculation I can search for it more easily in the Data pane or create a folder for my filter calculations. The calculation would be the following:
Sub-Category Filter
Sub-Category Parameter = Sub-Category
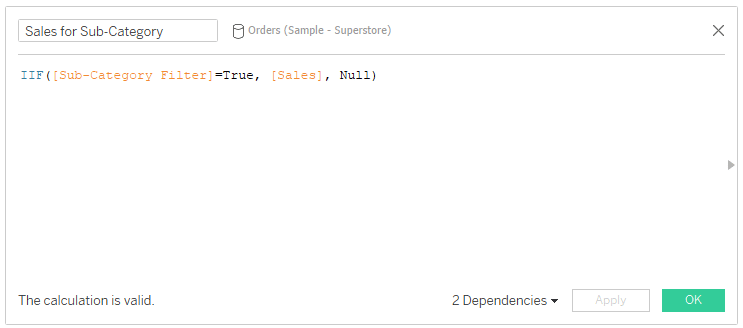
To show how our control sheet is overriding a parameter selection I will create a calculation similar to what we did for the set action to show our results on a dual-axis combination chart. The calculation for that is:
Sales for Sub-Category
IIF([Sub-Category Filter] = True, [Sales], Null)
I will drag this newly created calculated field next to the Sales pill on the Rows shelf, select Dual Axis and synchronize the axis. If Tableau didn’t put Measure Names on the Color property of the Marks card automatically, I will do so afterwards to differentiate between the static line of All Sales in Technology and the dynamic line that will react to my parameter selection.
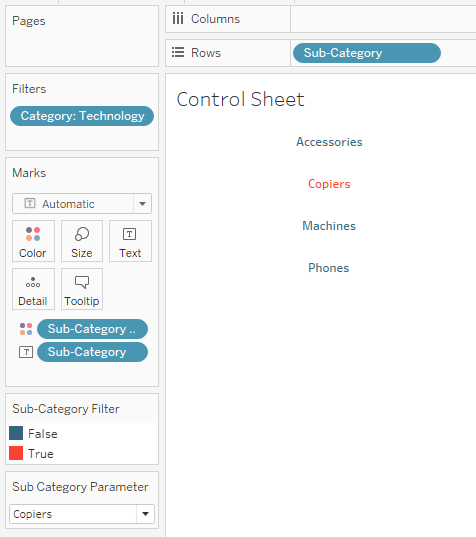
After this is done, I will create a separate worksheet that I am calling “Control Sheet”. Within the control sheet, I will drag the Sub-Category dimension to the Rows shelf and add any filters that I want to use to limit the list into the Filters shelf. For this example, I am going to recreate the same list that we had in the contextual set action section by dragging Category into the Filters shelf and selecting “Technology”. I also put the previously created “Sub-Category Filter” calculation on the Color property of the Marks card to highlight my currently selected sub-category.
How to Use Control Sheets for Better Parameter Actions
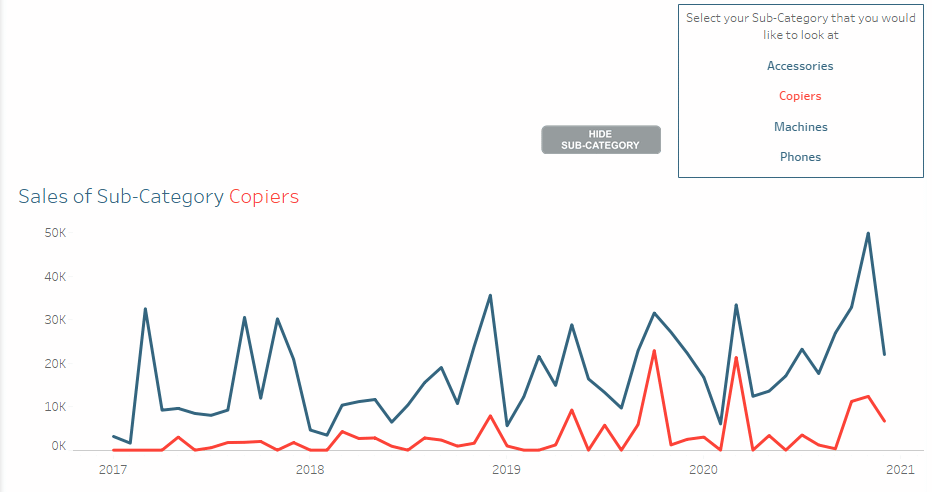
As a last step, I will pull both the line chart and the control sheet onto a dashboard. If I don’t want to show the control sheet all the time, I can use additional Show/Hide functionality by putting the control sheet into a vertical or horizontal container. To make it work in the end, you will need to set up a “Change parameter” dashboard action to allow the Control Sheet to override your parameter selection.
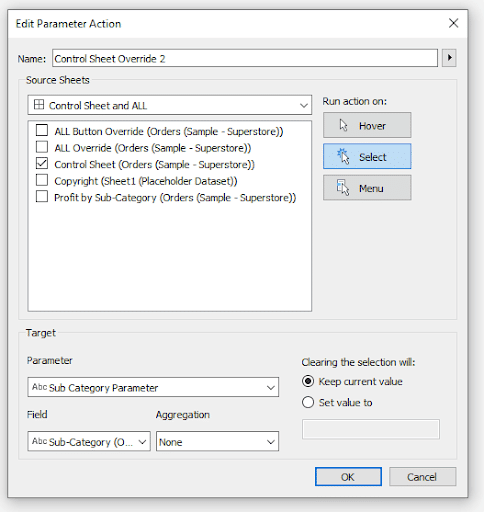
To do this, start by selecting Dashboard in the top navigation. Then choose Actions, Add Action, and Change Parameter. In the parameter action menu you will select the Control Sheet as your source sheet and the Sub-Category Parameter as the target. You will then use the Sub-Category dimension as the Field used to change the parameter.
All in all, control sheets open up a lot of additional flexibility to you as a Tableau engineer as well as usability to the end user. Plus you can even make them look like general parameters that open and close with one click ! 🙂
How to reset Tableau filters with an “ALL” values override
Last but not least, I would like to share another tip that I actually use in almost every visual that I create. It is adding an “ALL” value to a parameter list that will allow the user to not only drill down to one specific dimension member, but also choose to look at all of them at one time. Similar to how the All option in normal filters work, adding “ALL” to a parameter selection enhances the UX and opens up additional flexibility of our dashboard design in Tableau.
The advantage this gives to a control sheet is we are adding functionality similar to a filter or set action but we can create a unique design rather then using the out of the box look and feel.
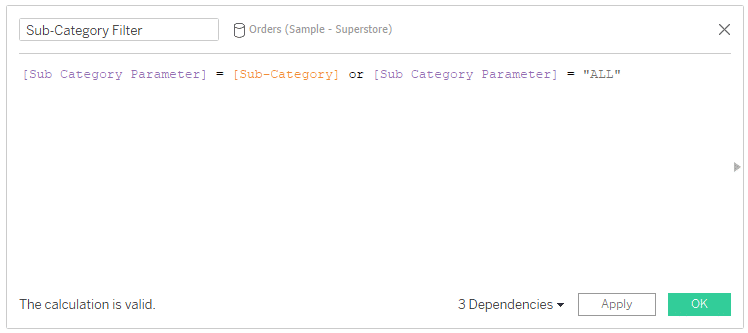
For this example, I will also re-use the calculated field that we previously created called “Sub-Category Filter”. I will modify that calculated field and add an OR statement that says OR the Sub Category Parameter = “ALL”. This will display all the sub-categories if ALL is selected from the parameter.
To that, we will need to add the possibility for an “ALL” selection in the parameter as well:
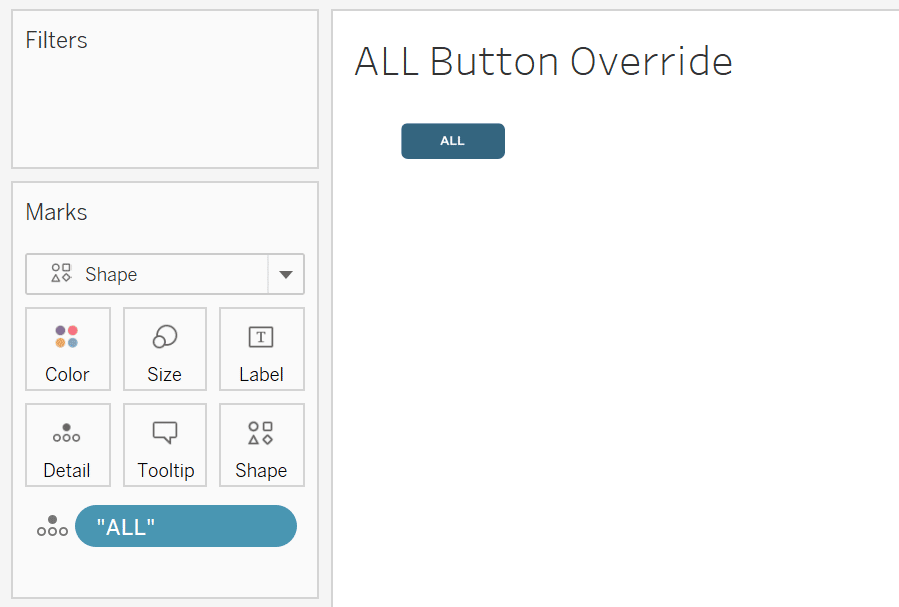
Now to create an All button, I will open a new sheet and title it ALL Override. Within this sheet I will change the Mark type to Shape and then I will double click into the blank section on the Marks Card. This will open a new pill where you can type. This is called adding something “in the flow”. I will enter “ALL” into the pill and press Enter. I will then drag the pill that is created from Detail to Text.
![]()
We will basically be using this new string to pass the “ALL” value into the Sub-Category Parameter. It is important to note that you will want to spell this value exactly like you did within the parameter. In my case, I used all caps but if you spelled it “all” or “All” in your parameter; this value will need to be spelled like that in the parameter as well.
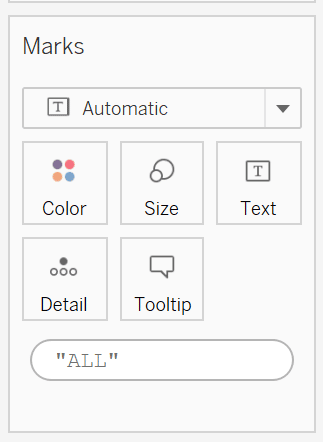
Once you have your “ALL” override on the Detail property of the Marks card, you can either select Shape or Circle as your mark type – both work just fine. I typically create a custom shape to use for the button, but for this example I will load a custom rounded rectangle to act as my button and select it from the shapes.
After all of that is done, I am positioning the newly created sheet either together with the visualization that I am using to override the values of the parameter or within the vertical or horizontal box of the show/hide button that I use for the control sheet. I have implemented it in both ways in the example below:
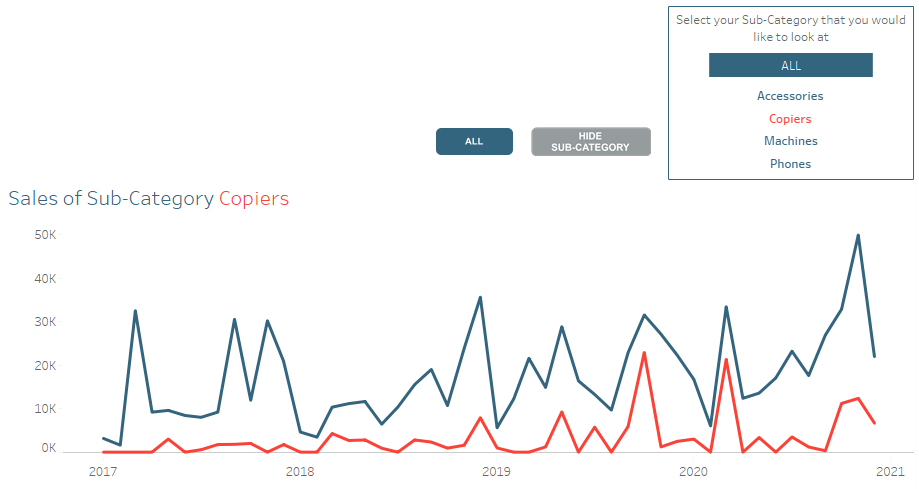
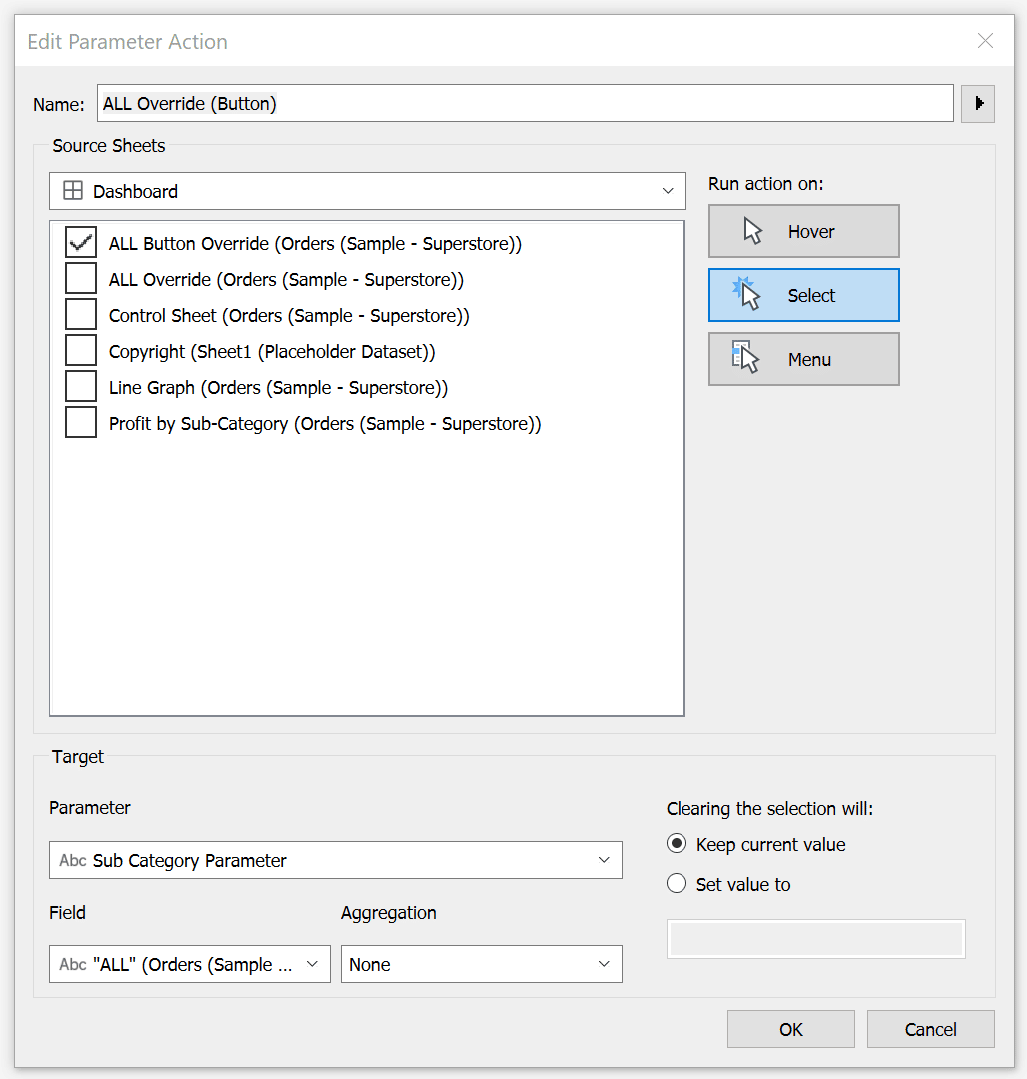
The last step is to set up a dashboard action specifically for the “ALL” override. I will use the exact same steps as before to create this new dashboard action. However; this time I am going to use the “ALL” value as my field. Once I have that setup I will click OK and test it out.
And that’s it! 3 innovative ways to use filters in Tableau that can make your life much easier and the UX so much better without a lot of engineering or drama to it 🙂
Stay hungry,
Maggy


Written By
Maggy Muellner
Related Content

Ryan Sleeper
Data source filters > context filters > dimension filters > measure filters See how the different types of Tableau filters…
How to Completely Customize Multi-Select Filters in Tableau

Filters play a crucial role in allowing users the flexibility to manipulate dashboards to their liking. Multi-select filters can be…
Ryan Sleeper
Control any parameter actions scenario with a second data source One drawback to parameter actions is the value you want…