How to Completely Customize Multi-Select Filters in Tableau

Filters play a crucial role in allowing users the flexibility to manipulate dashboards to their liking. Multi-select filters can be particularly useful when the stakeholder requires the flexibility to include or exclude certain values from the Tableau visualization. Utilizing filters has its own set of limitations, such as the inability to filter across data sources or customization of the user experience. Traditionally, relying on parameters allows you to both customize the UX and filter across multiple data sources but does not allow for a multi-select option. Alternatively, sets, and associated set controls, have been used to allow for multi-select, but this option does not allow you to deselect without resetting the entire experience.
At Playfair Data, we have developed a new approach that allows the engineer full flexibility and customization over their multi-select filter, including the use of shapes to indicate selection vs. de-selection, a UX workaround to automatically deselect a dimension member, Dynamic Zone Visibility to show and hide the drop-down menu, and the ability to filter across data sources. It may sound too good to be true, but keep reading to learn how to wow your stakeholders with this new innovative UX!
By the end of this tutorial, you will be able to make custom dropdown menus, using any shapes you want, allowing you to do a multi-select even with allowable parameter values, that work across data sources.
Tutorial overview
Before jumping into the tutorial, it is important that you understand the high-level explanation of what these step-by-step instructions aim to achieve–namely a customizable multi-select drop down menu using a parameter filter.
The traditional approach to parameter filters uses the List option for the allowable values within the parameter settings, which restrict the user to only have the ability to choose the specified options within that list. Furthermore, with the List option, the user can only choose one item from the list at a time, therefore restricting the possibility of multiple selections.
Continue reading with a free account, or login.
Unlock this tutorial and hundreds of other free visual analytics resources from our expert team.
Already have an account? Sign In
By continuing, you agree to our Terms of Use and Privacy Policy.
How to Make Custom Menus in Tableau
In this approach, instead of using the List option we are using the All option for allowable values in the parameter settings, which leaves the engineer with a blank string parameter. The first goal of this approach is to automatically populate the blank string parameter with dimension members based on the selection of a customized drop-down menu that we’ll create. This method effectively uses a blank string parameter to store data.
The second goal of this approach is to recall the data that has been stored in the string parameter. Recalling that data is achieved through code called ‘Regex’. Regex is a type of code that is optimized for reading, matching, and extracting string values. The Tableau function REGEXP_EXTRACT will be used in this tutorial to extract the values specified within the parentheses of the regex code. Regex code comes with its own set of rules and nuances, but teaching the ins and outs of the code is out of the scope of this blog. If you are curious to learn more about regex, then you can visit this Regex Quick-Start Guide.
To bring this high-level overview full circle, in this tutorial, we will build a drop-down menu, use parameter actions to append the selected menu options to the string parameter (storing the data), and then use regex code to recall the data stored in the string parameter, which will be used to populate the visualization.
Build the calculations for a multi select filter in Tableau
I want to note that the order of the instructions in this tutorial is somewhat counterintuitive. The way that I have explained this method is that the user makes selections from the drop-down menu, then the selected values from the menu are passed to and stored in a string parameter, and then those values are recalled using regex to feed the visualization. But because of the way the calculations build off each other and the complex UX features, this tutorial will be taught in the following order:
- Building a simple visualization
- Create the important calculations and parameters
- Build the drop-down selector and menu
- Assemble the dashboard
- Bring the dashboard and UX to life using dashboard actions
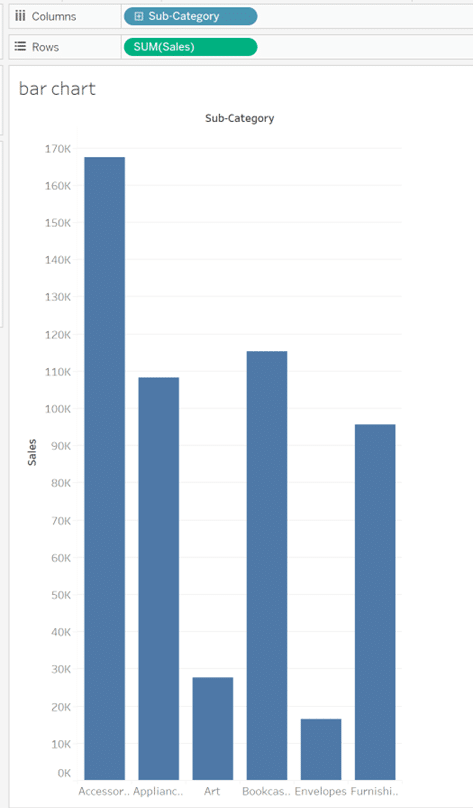
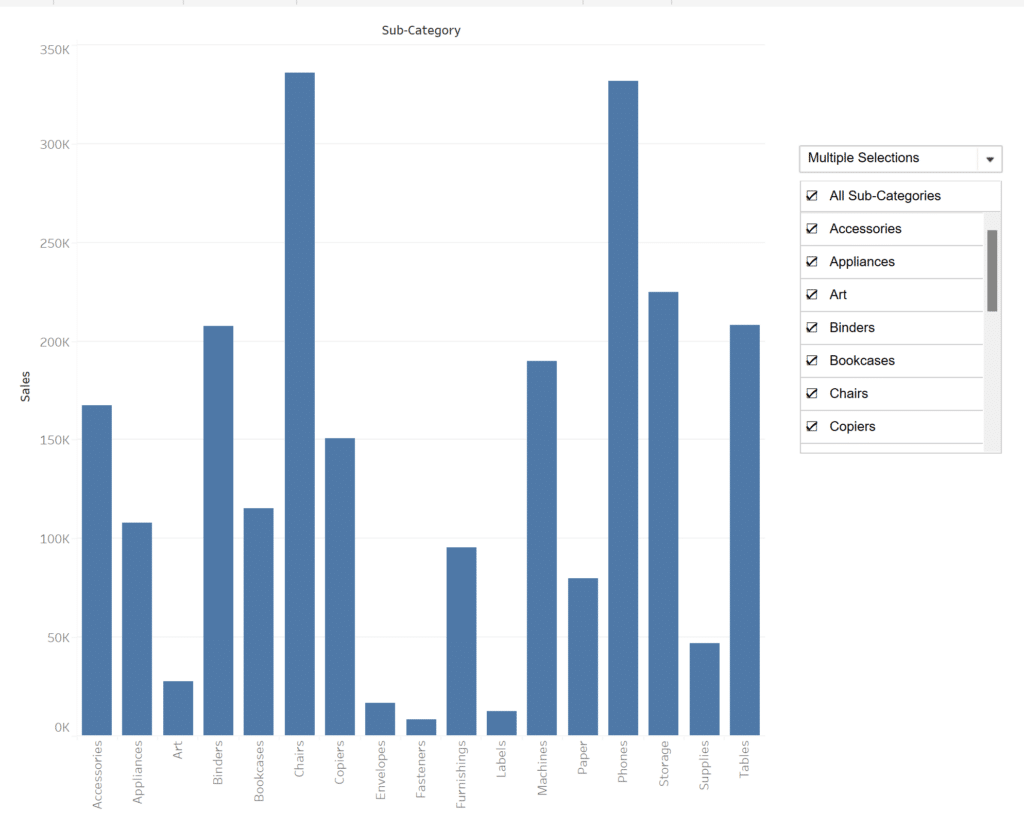
Start by connecting to the Sample Superstore dataset. Once connected, create a simple bar chart visualization by placing Sub-Category on the Columns shelf and SUM(Sales) on the Rows shelf.
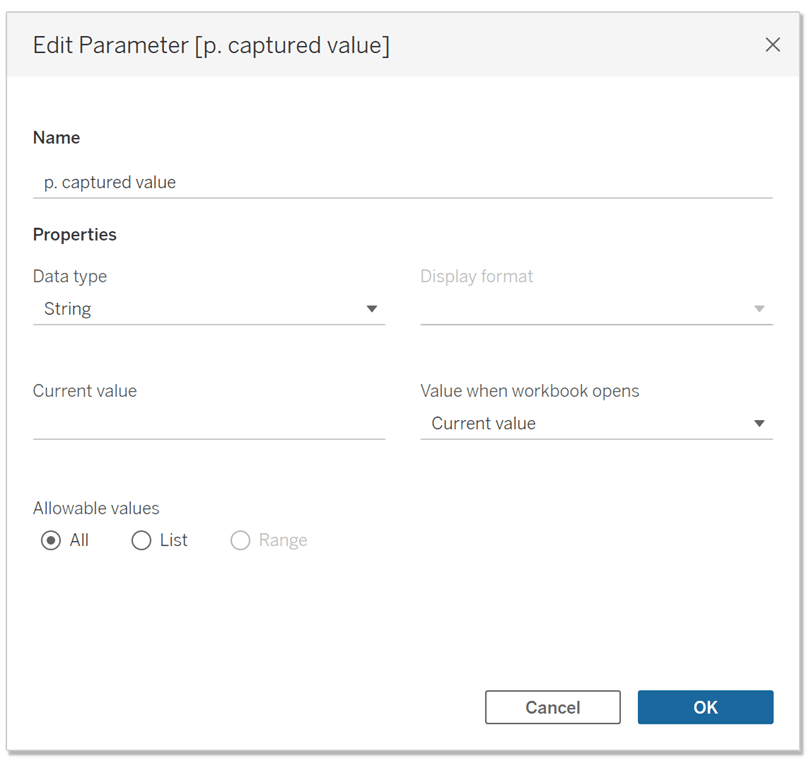
Create an empty string parameter called ‘p. captured value’ and make sure the ‘Current value’ is empty. This parameter will later store and feed the visualization dimension members based on the selection of a custom drop down menu that we’ll create later on.
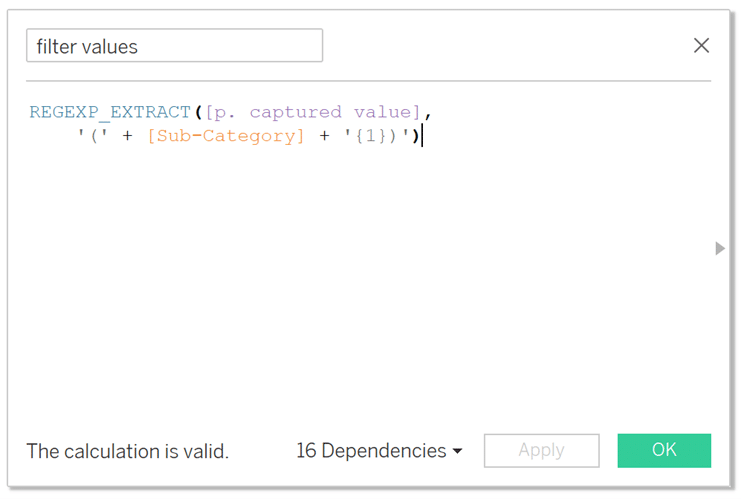
Next, create a calculation called ‘filter values’ using the function called “REGEXP_EXTRACT”, which will parse through the ‘p. captured values’ parameter we just created and extract any sub-category values.
REGEXP_EXTRACT([p. captured value],
‘(‘ + [Sub-Category] + ‘{1})’)
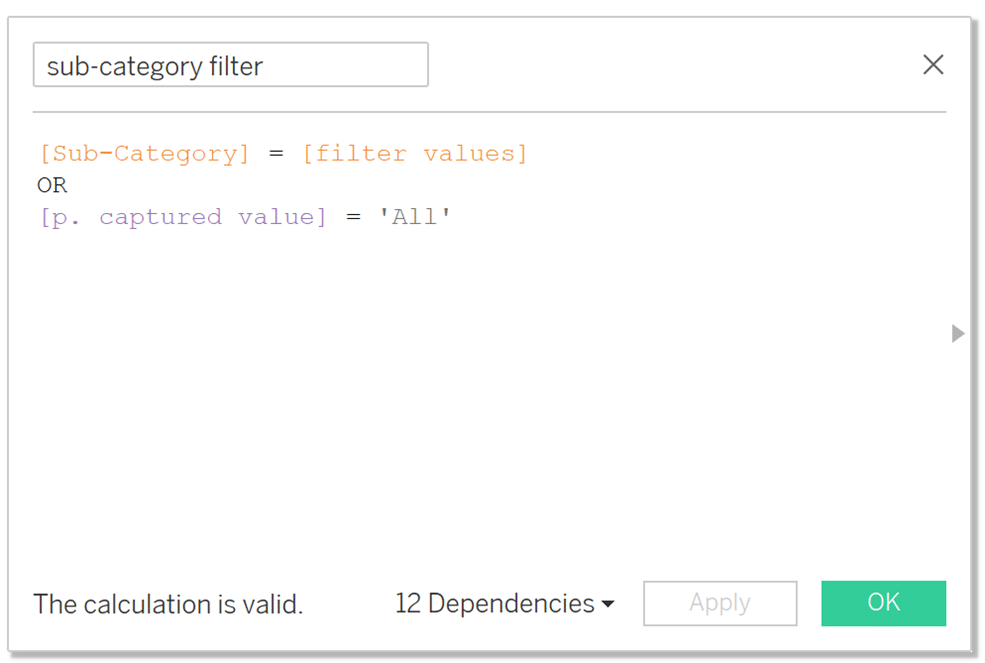
Create a calculation called ‘sub-category filter’, which will filter the visualization to only the sub-categories returned by the ‘filter values’ calculation.
[Sub-Category] = [filter values]
OR
[p. captured value] = ‘All’
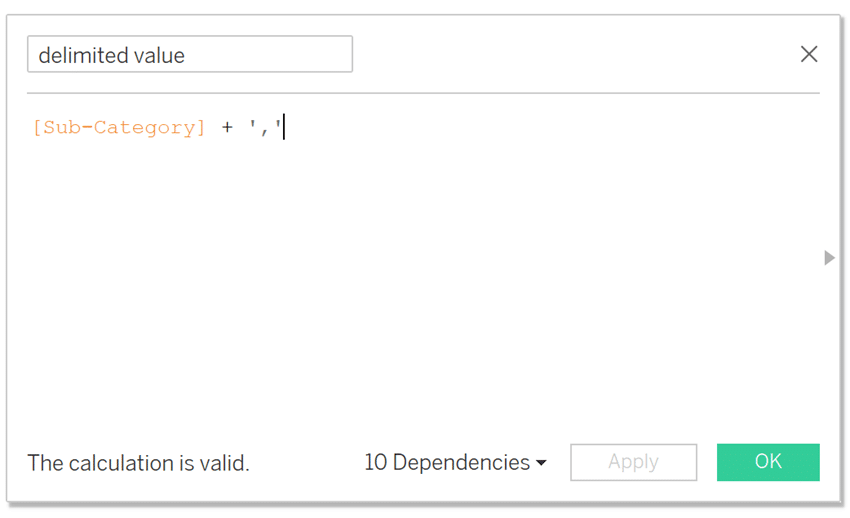
Create a calculation called ‘delimited value’, which combines Sub-Category with a delimiter. A delimiter is a character, such as a comma, which allows regex code to identify and separate out dimension members. It is important to note that the delimiter you choose should be a value that does not already exist in the dimension members. For example, do not use a comma as the delimiter if you are extracting street addresses and the addresses in the data already contain commas.
[Sub-Category] + ‘,’
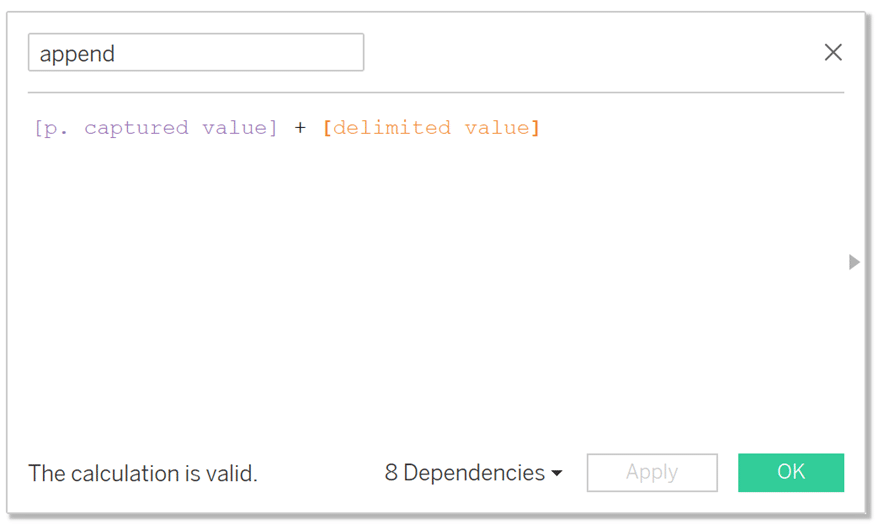
Create a calculation called ‘append’, which will be used to append a sub-category menu selection to the string parameter.
[p. captured value] + [delimited value]
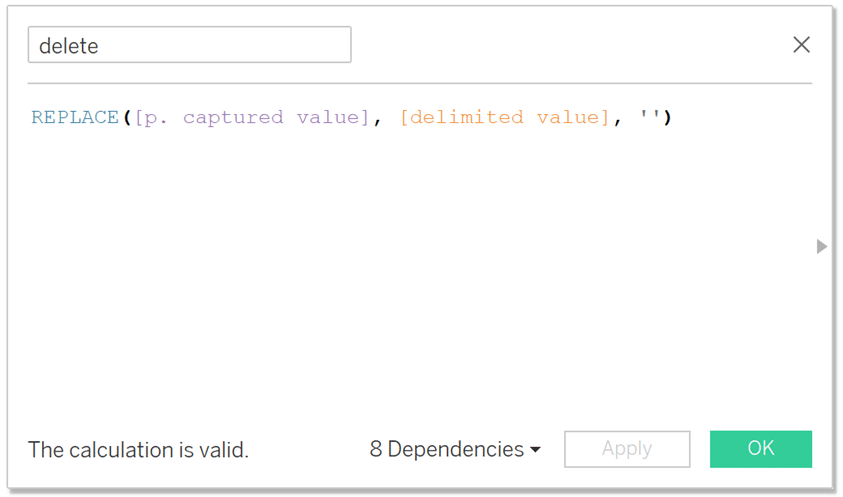
Create a ‘delete’ calculation which will be used to delete a sub-category selection from the string parameter.
REPLACE([p. captured value], [delimited value], ”)
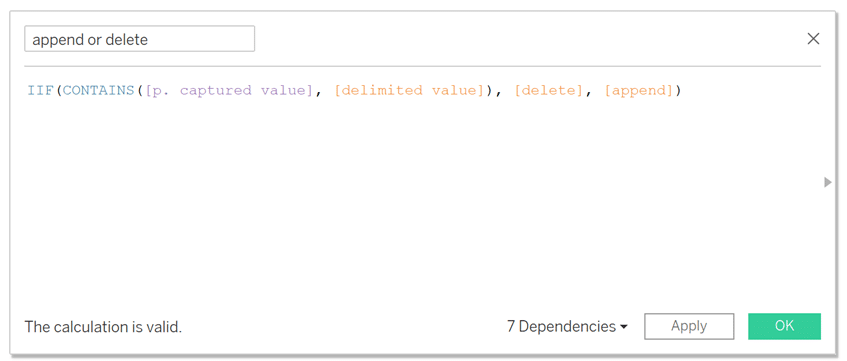
Create a calculation called ‘append or delete’, which will be used to either append or delete the sub-category selection to the string parameter depending on whether or not the string parameter already contains the value. If the value already exists in the parameter, then it will delete it but if the value does not exist in the parameter, then it will append the value.
IIF(CONTAINS([p. captured value], [delimited value]), [delete], [append])
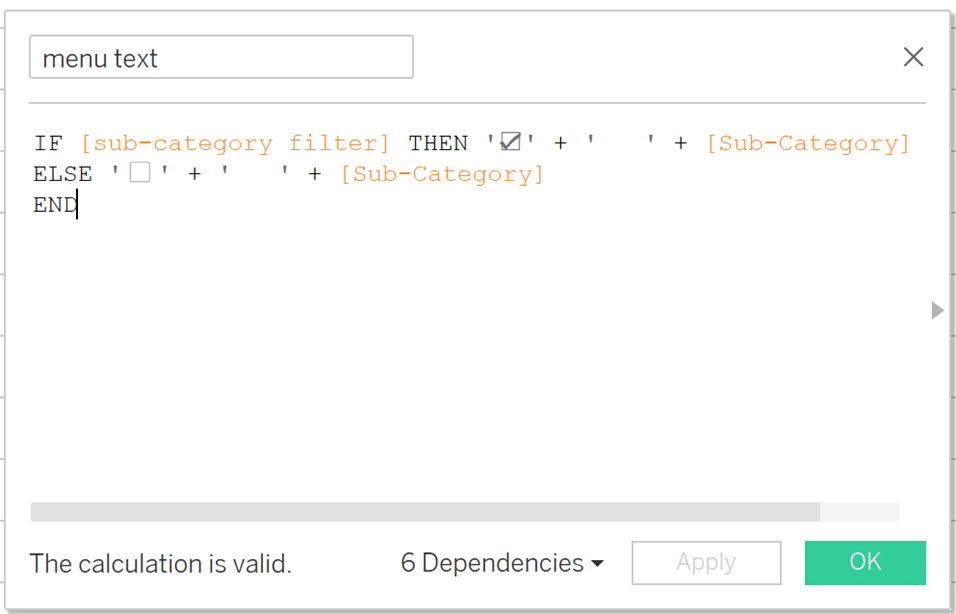
Next, we’ll build the dropdown menu, which will be used to make our filter selections. Start by creating a new calculation called ‘menu text’ which will return either a check marked sub-category name or an unchecked sub-category name (using unicode text for the check marks). If the calculation ‘sub-category filter’ returns True, then the Sub-Category will be check marked, but if ‘sub-category filter’ returns False, then the Sub-Category will be unchecked.
IF [sub-category filter] THEN ‘☑‘ + ‘ ‘ + [Sub-Category]
ELSE ‘◻‘ + ‘ ‘ + [Sub-Category]
END
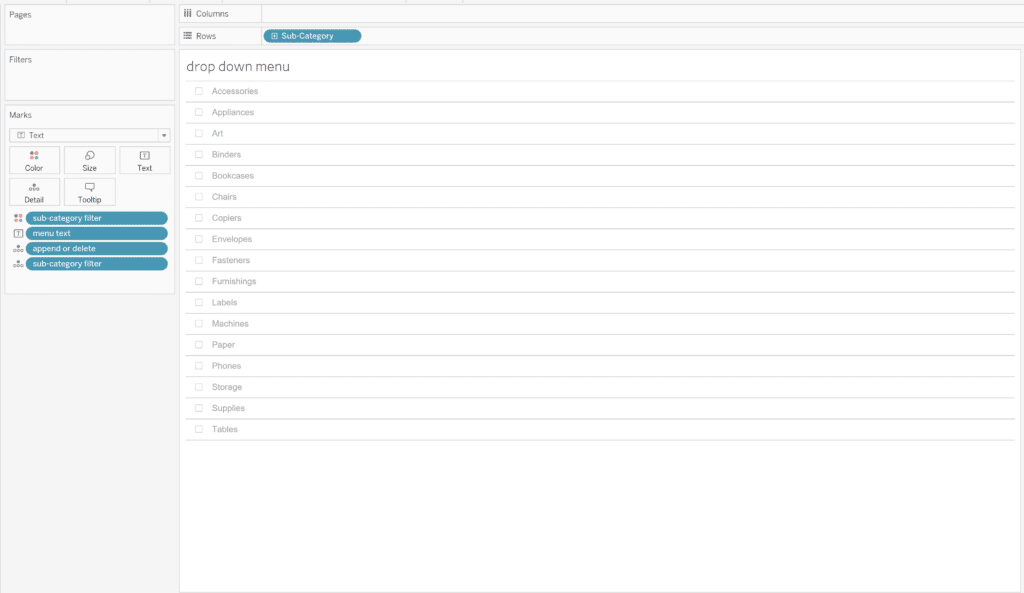
Place Sub-Category on the Rows shelf and the ‘menu text’ calculation on the Text property of the Marks card. Place the ‘sub-category filter’ calculation on the Color property of the Marks card and adjust the colors to make the selected state black and the unselected state gray. Add the ‘append or delete’ calculation to the Detail property. Hide the Sub-Category Header and fit the view to Width. Format lines & borders.
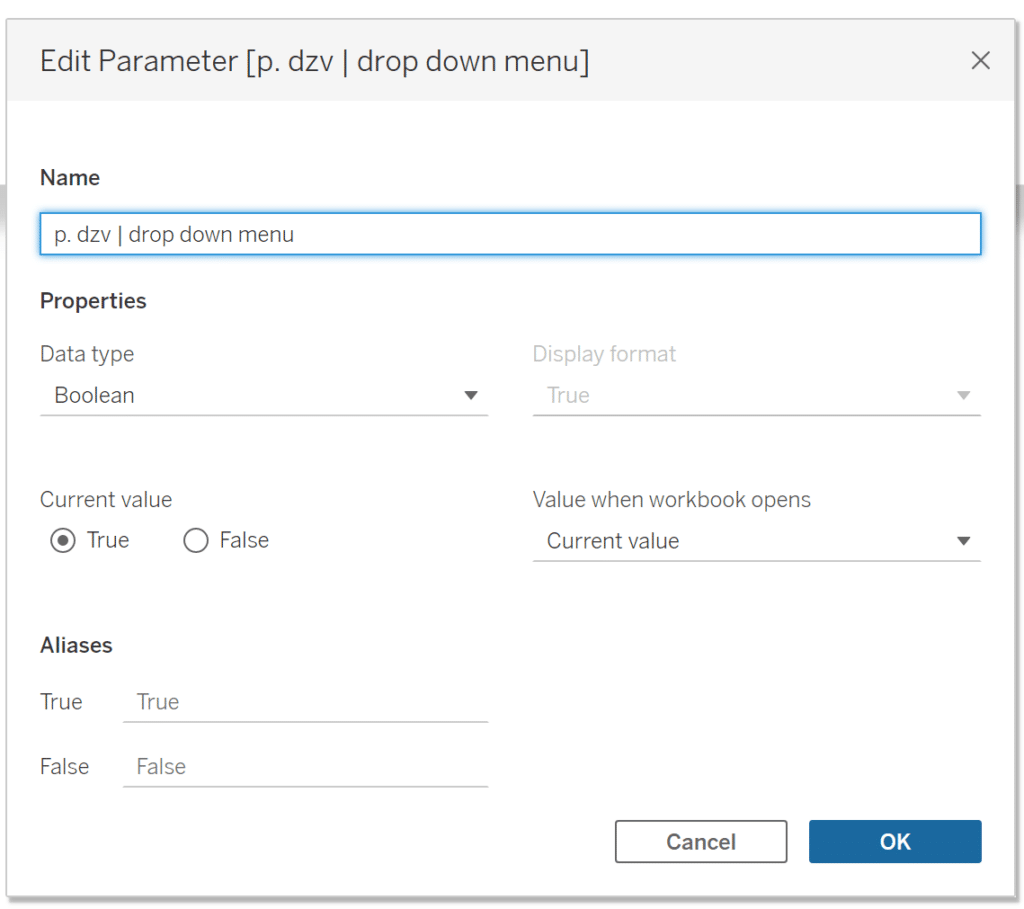
Now that our menu is built, we need to create the drop-down selector. Start by opening a new Sheet and name it ‘drop down selector’. Create a Boolean parameter named ‘p. dzv | drop down menu’, which will control whether the dropdown menu is shown or hidden using Dynamic Zone Visibility.
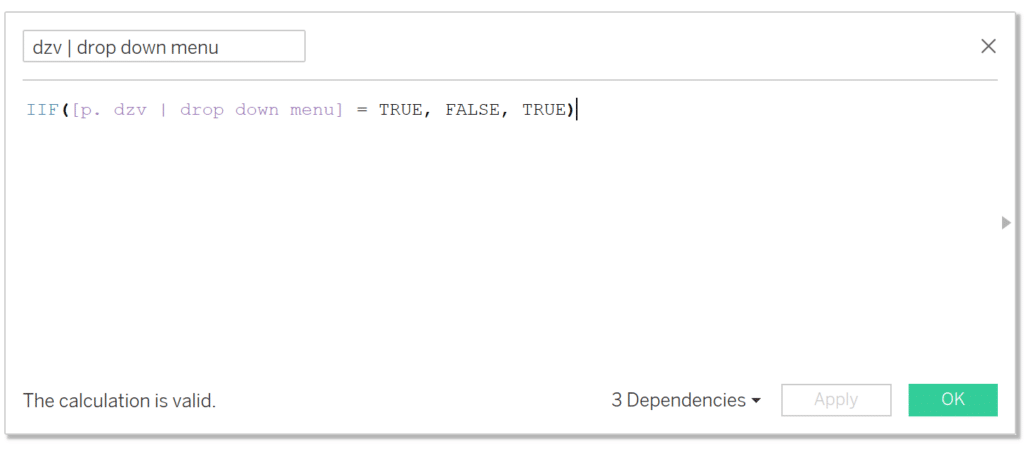
Create a calculation, which will be used in a parameter action to switch the value of the Boolean parameter between True and False when the drop-down selector is selected.
IIF([p. dzv | drop down menu] = TRUE, FALSE, TRUE)
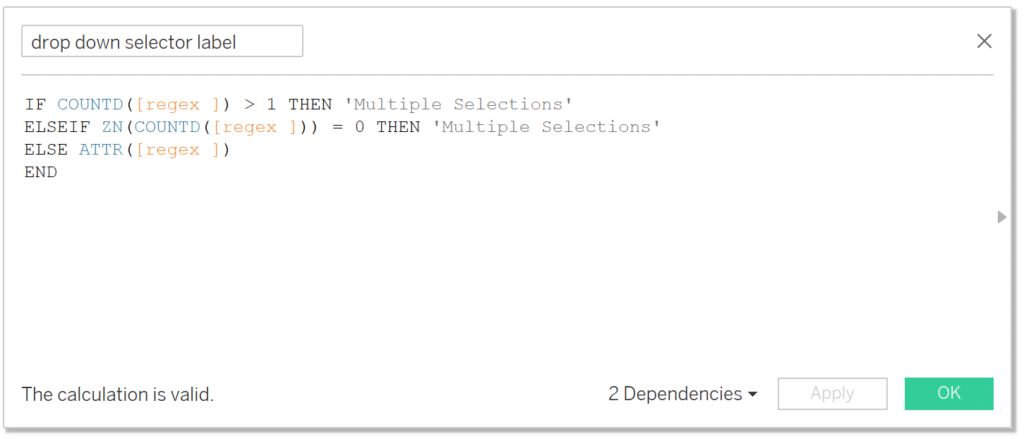
Create a new calculation which will create dynamic text for your dropdown selector label. The value will result in either ‘Multiple Selections’ if more than one selection is made from the menu, or a single Sub-Category value if only one selection has been made.
IF COUNTD([filter values]) > 1 THEN ‘Multiple Selections’
ELSEIF ZN(COUNTD([filter values])) = 0 THEN ‘Multiple Selections’
ELSE ATTR([filter values])
END
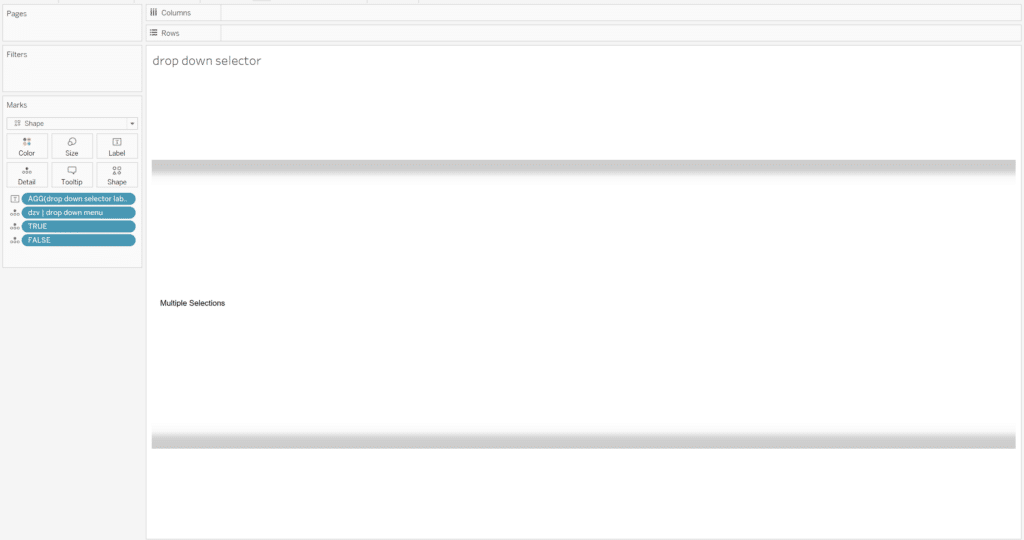
Place the calculation ‘dzv | drop down menu’ on the Detail property of the Marks card, the ‘drop down selector label’ calculation on the Text property, and then double click into the blank space at the bottom of the Marks card and create TRUE and FALSE calculations. Change the mark type to Shape and choose a dropdown menu shape from your Shapes folder. Change the size of the shape as necessary.
Create a new sheet called ‘all values’ which will be used as a menu option to either select all sub-categories or deselect all sub-categories.
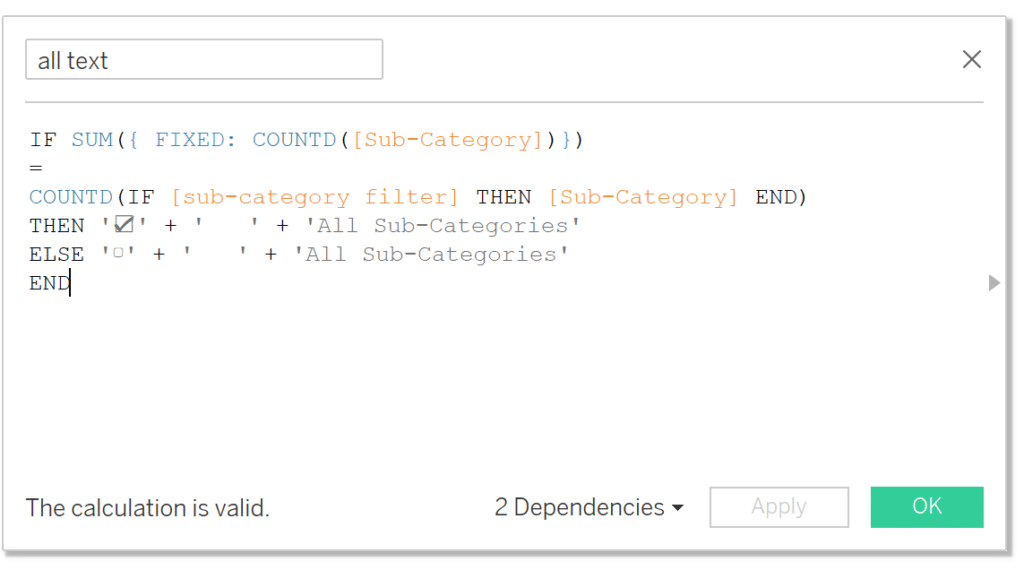
Next, create a calculation called ‘all text’, which will dynamically result in text to either show an uncheck marked box or a check marked box depending on whether or not all sub-categories have been selected.
IF SUM({ FIXED: COUNTD([Sub-Category])})
=
COUNTD(IF [sub-category filter] THEN [Sub-Category] END)
THEN ‘☑‘ + ‘ ‘ + ‘All Sub-Categories’
ELSE ‘◻‘ + ‘ ‘ + ‘All Sub-Categories’
END
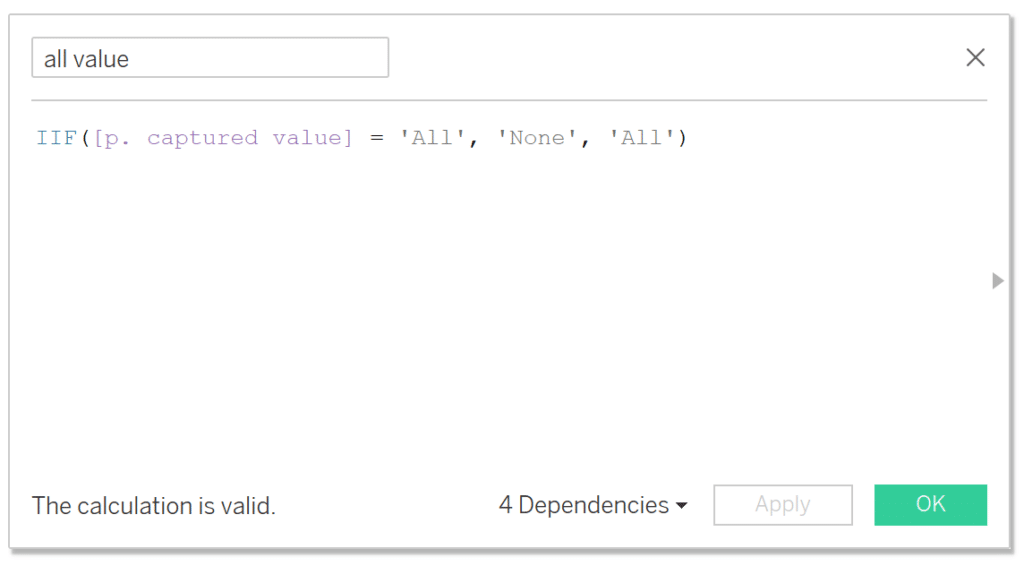
Create a new calculation called ‘all value’, which will pass either the value ‘All’ or ‘None’ to the string parameter to either show all values or none at all.
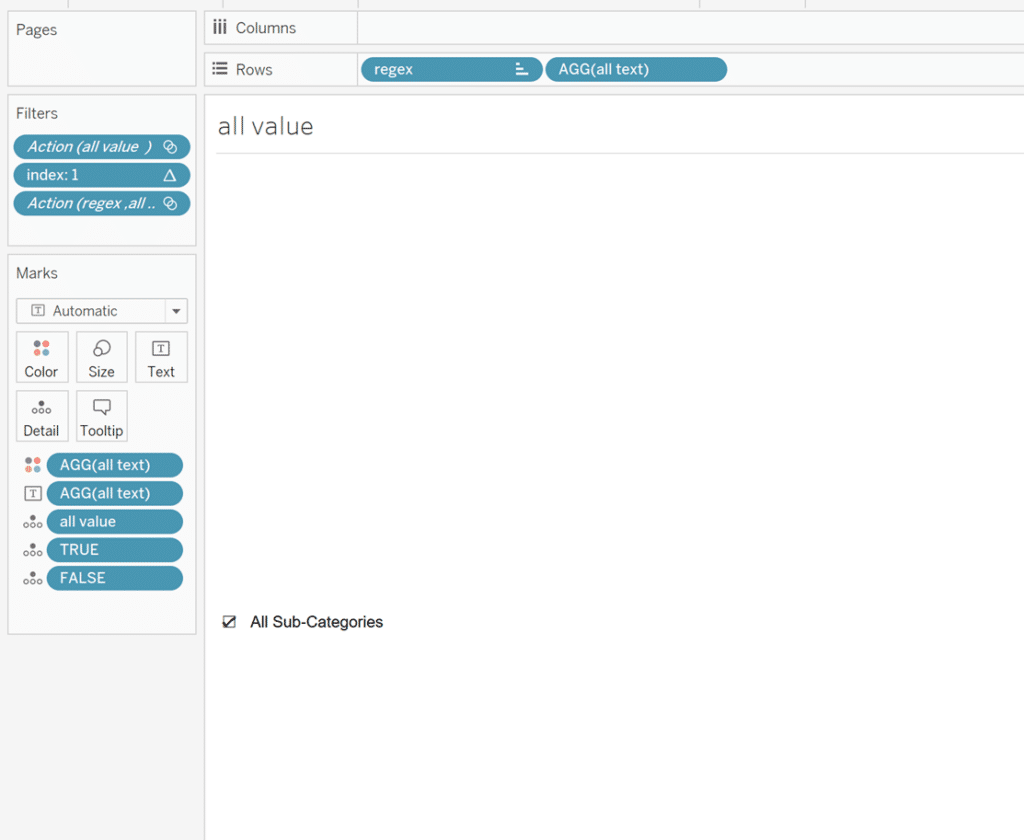
Place the ‘all value’ calculation, TRUE, and FALSE on the Detail property. Place ‘all text’ on the Text and Color properties of the Marks card. Place the ‘all text’ and ‘filter values’ calculations onto the Rows shelf and hide the headers. Sort the visualization in descending order. Create an INDEX() calculation and place it on the Filters shelf to filter the index to only 1.
Assemble the view
All of the pieces have now been built, so we just have to assemble the view, apply Dynamic Zone Visibility, and create the necessary dashboard actions. Drag all of your sheets into the dashboard view and size them appropriately as seen in the image below.
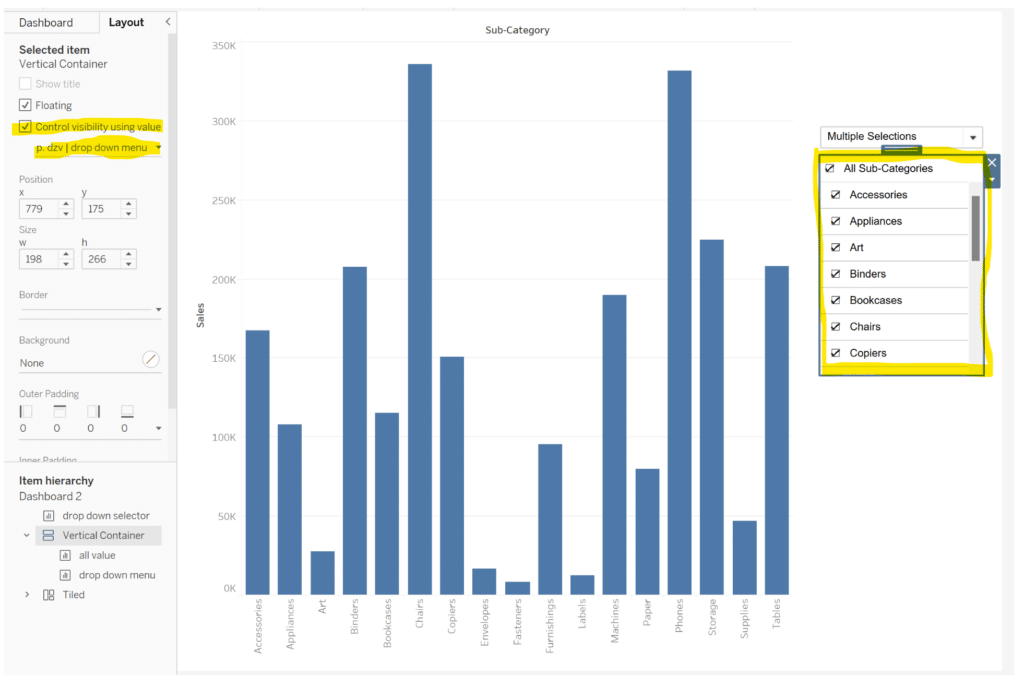
Float a vertical container onto the dashboard and stack the ‘all value’ and ‘drop down menu’ sheets inside it as seen in the image below. Select the vertical container, navigate to the Layout pane, checkmark ‘Control visibility using value’, and choose ‘p. dzv | drop down menu’. This will apply Dynamic Zone Visibility to your dropdown menu, which is being controlled by the Boolean parameter selected. When the parameter is True, the menu will be shown, but when it is False, the menu will disappear.
How do Do Advanced Dynamic Zone Visibility in Tableau
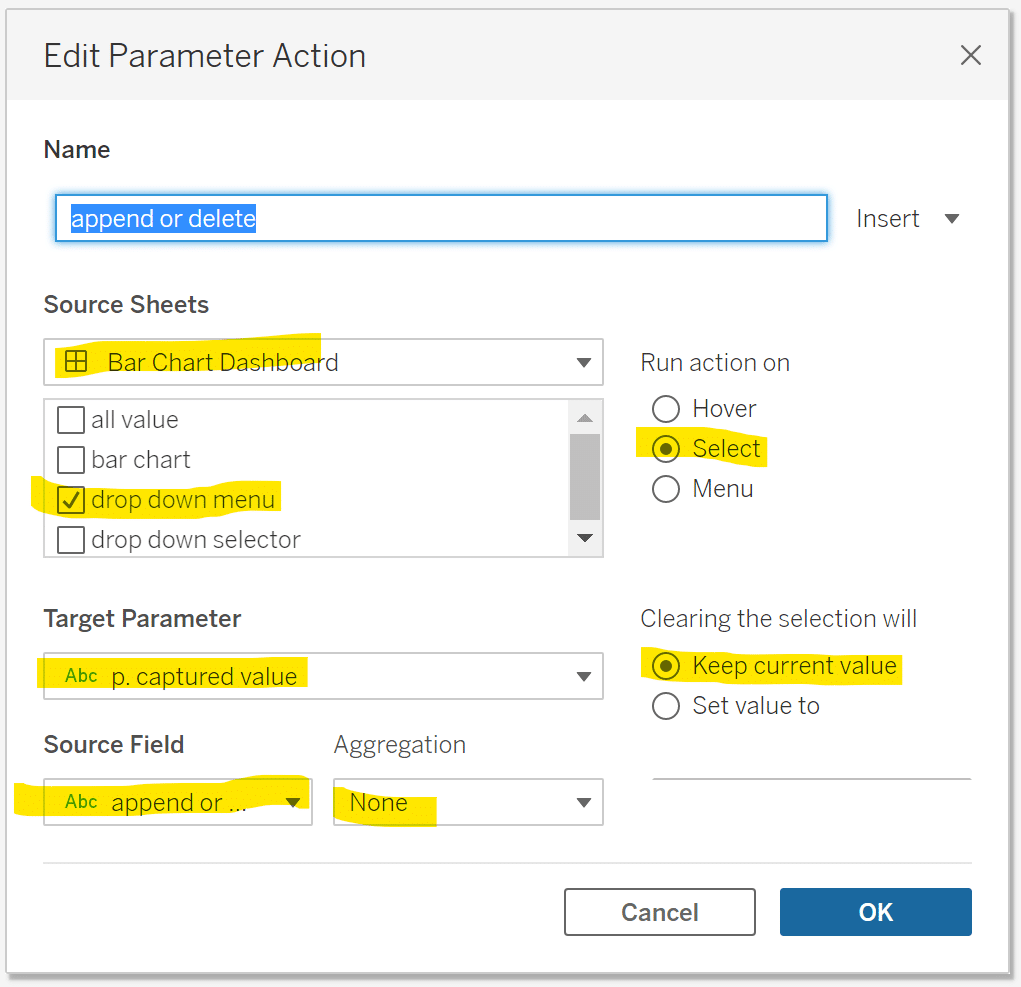
Now we need to create dashboard actions to bring this visualization to life! The first parameter action will append or delete the selection made from the dropdown menu to the string parameter. At the top navigation, select Dashboard, select Actions…, select Add Action, then choose Change Parameter. Name the parameter action ‘append or delete’, choose ‘drop down menu’ under Source Sheets, Run action on ‘Select’, choose ‘p. captured value’ under Target Parameter, choose ‘append or delete’ under Source Field, then choose ‘None’ for Aggregation, select OK.
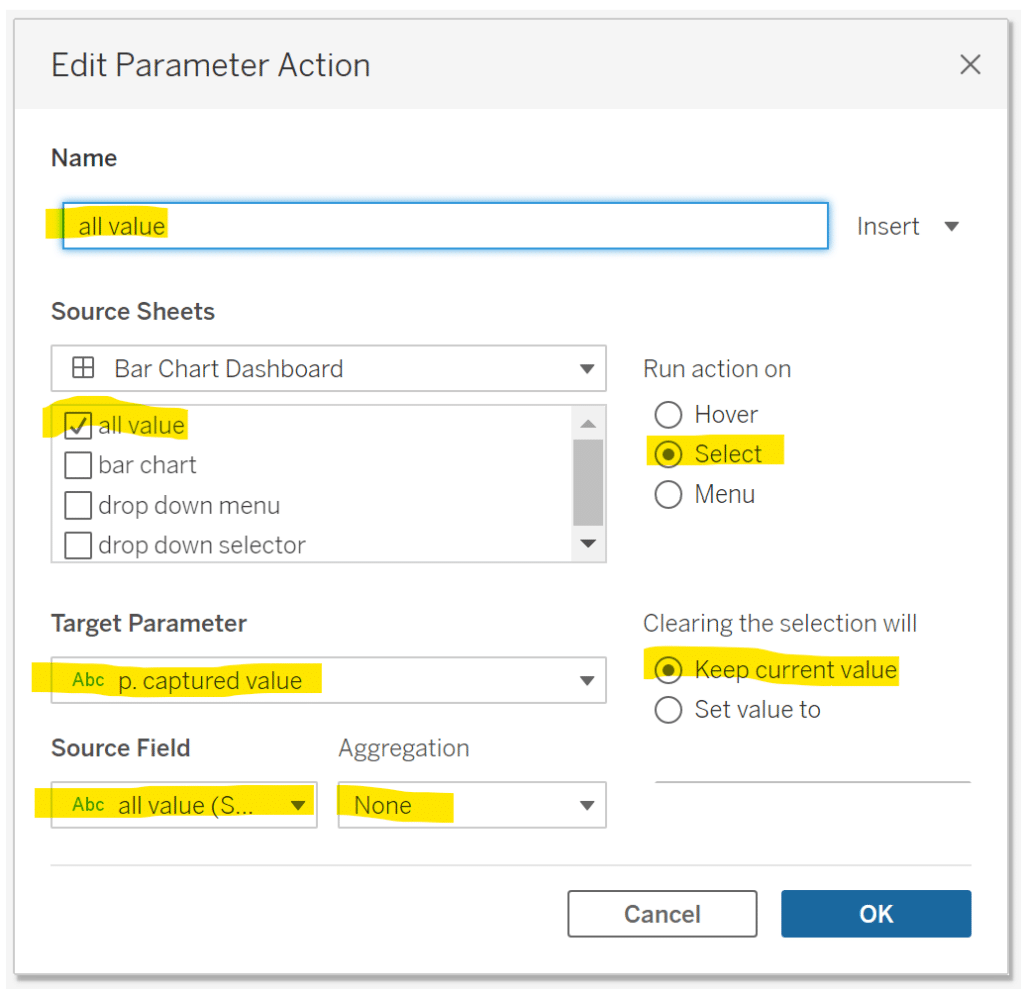
Create a new parameter action called ‘all value’, which will change the ‘p. captured value’ parameter to ‘All’ or ‘None’. Follow the highlighted instructions in the image below.
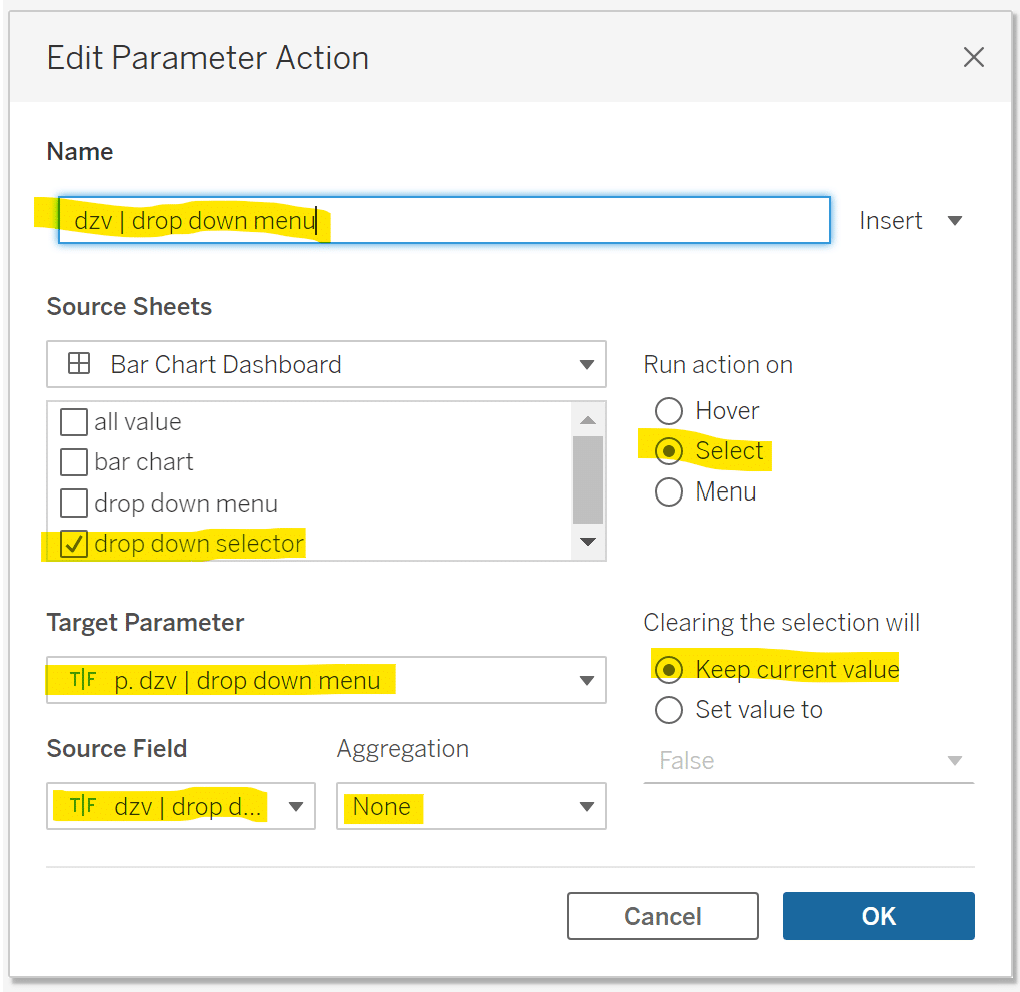
Create a new parameter action called ‘dzv | drop down menu’, which will be used to switch the Dynamic Zone Visibility value between True and False when the ‘drop down selector’ sheet is selected. Follow the instructions highlighted in the image below.
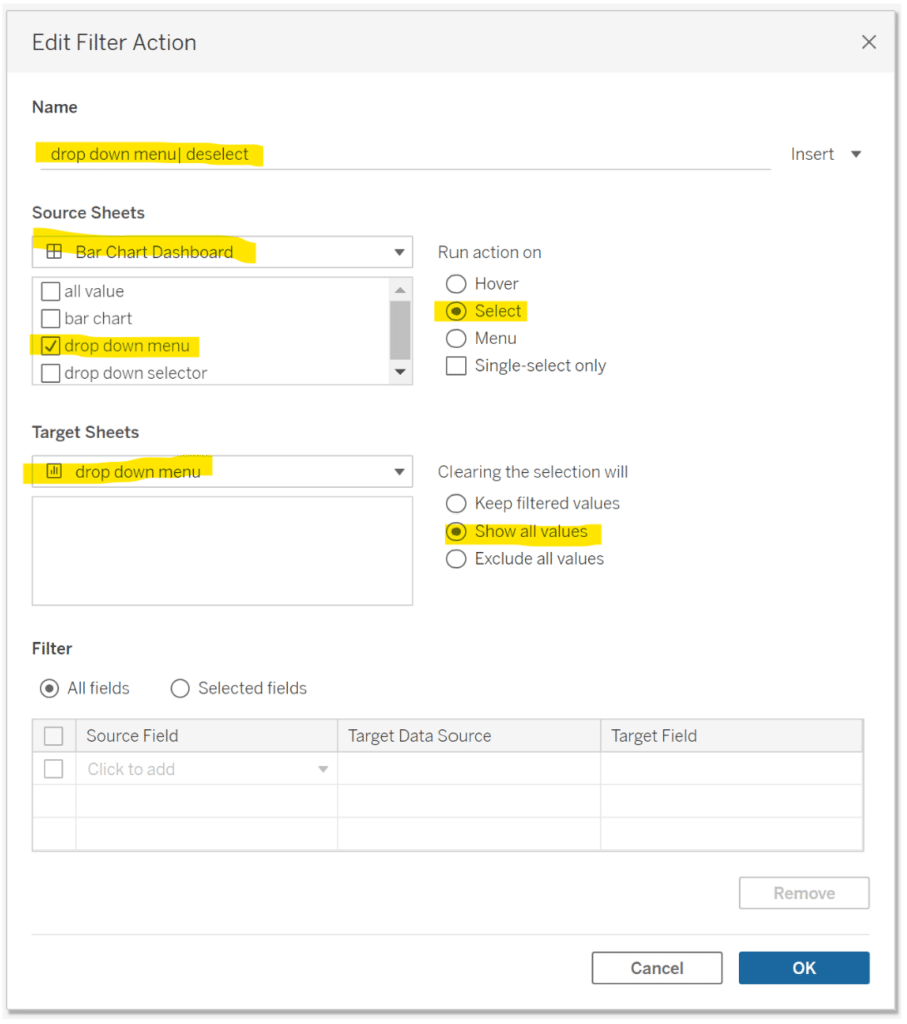
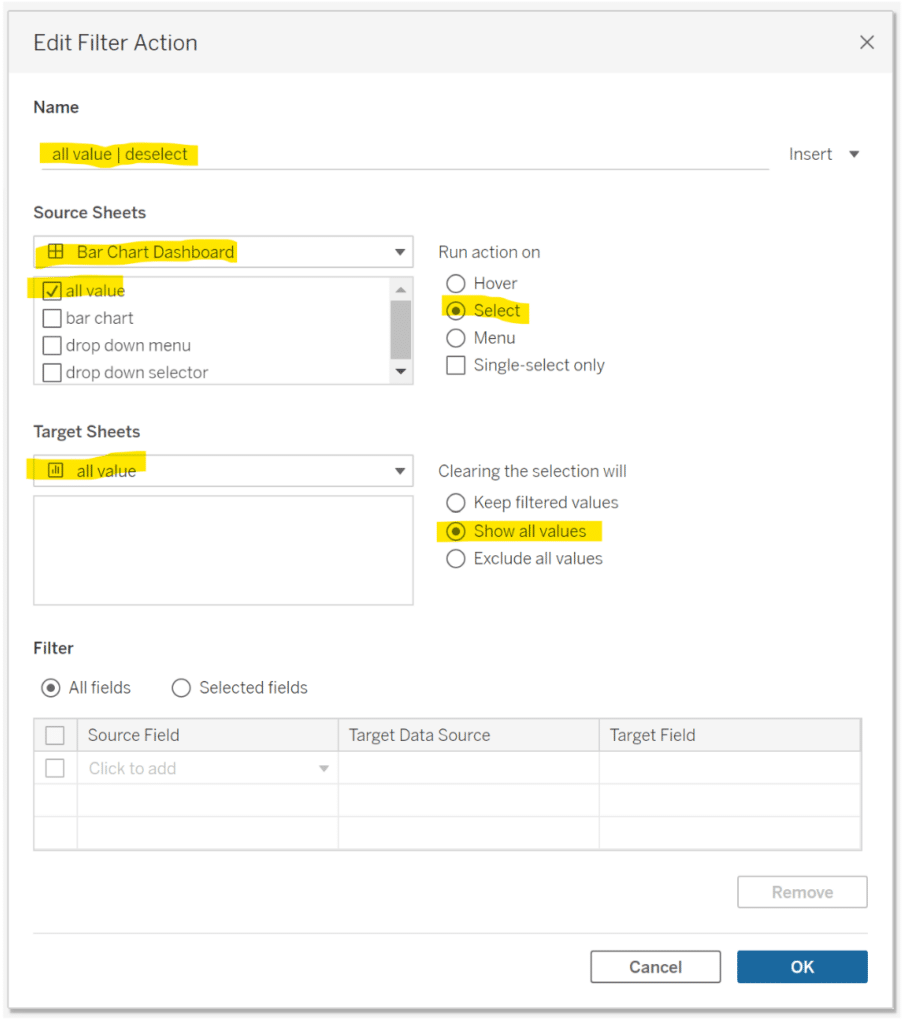
We will next create three filter actions, which will be used to automatically deselect the ‘drop down selector’, ‘drop down menu’, and ‘all values’ sheets. Let’s start with the dropdown selector and name this filter action ‘dzv | drop down menu’. Follow the steps highlighted below.
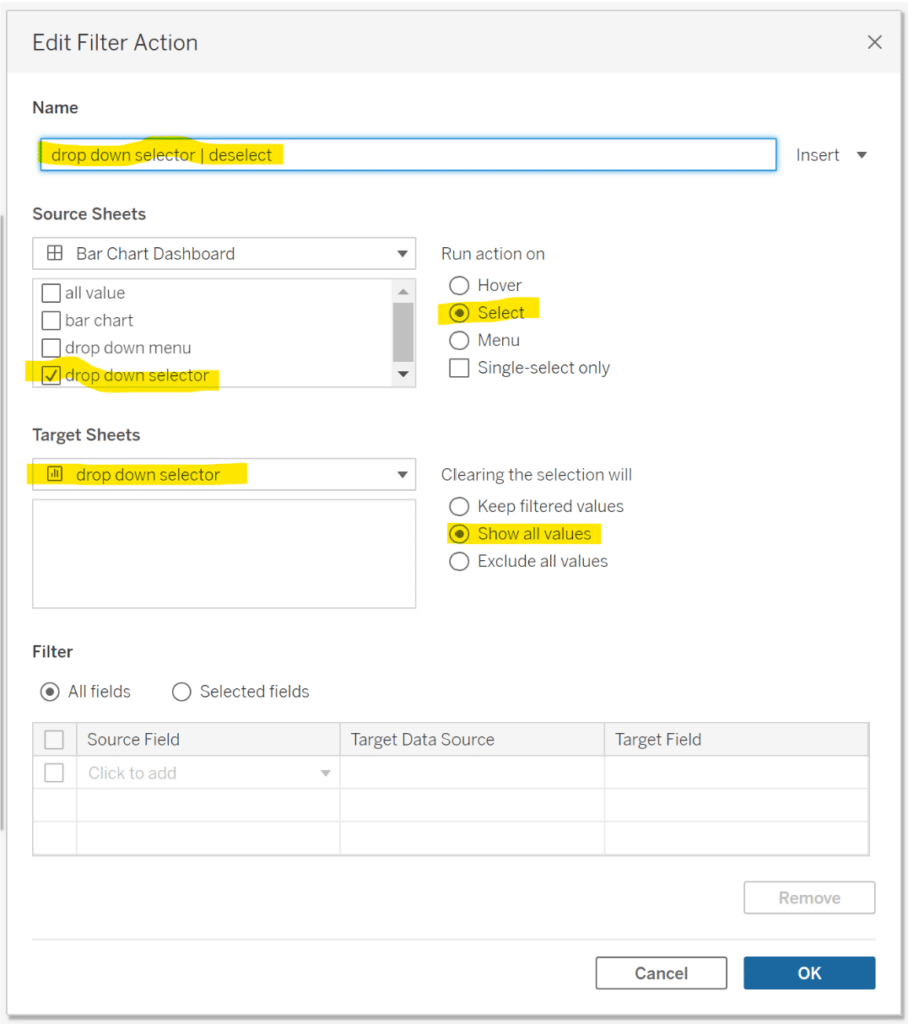
Repeat the same steps to create filter actions for the ‘drop down menu’ and ‘all values’ sheets. See the two following screenshots below for instructions on these filter actions.
![]()
Conclusion
Once the dashboard actions have been completed, all that is left to do is test it out and make sure the multiple values dropdown menu is working as expected. And that’s it; I hope you enjoyed and learned something new from this tutorial. As always, feel free to reach out to me if you have any questions or comments about this tutorial.
Happy Vizzing,
Dan Bunker
[email protected]


Written By
Dan Bunker

Peer Review
Maddie Dierkes
Manager, Decision Science

Peer Review
Matt Snively
Sr. Manager, Analytics Engineering
Related Content
How to Make Better Drop-Down Menus in Tableau

A Tableau drop-down menu is nothing new. Tableau has this capability built in for filters, set controls, and parameters which…

Ryan Sleeper
Create custom row-level calculations from text using string functions Learn how to access all the different string functions from within…
Ryan Sleeper
Make filter results more predictable by basing them on row number Do your filters ever return a result you weren’t…