How to Do Advanced Dynamic Zone Visibility in Tableau

Released with version 2022.3, Dynamic Zone Visibility is a relatively new feature in Tableau. In a previous post, Playfair Data Founder, Ryan Sleeper, shared how to use Dynamic Zone Visibility to do better sheet swapping in Tableau. Sheet swapping is just one of many ways to utilize the Dynamic Zone Visibility feature, so in this post, I will explore two additional ways to improve UX and wow users with dashboard interactivity. Specifically, I will show you how to create custom annotations that can be hidden with a single click and how to create a slide-out detail card.
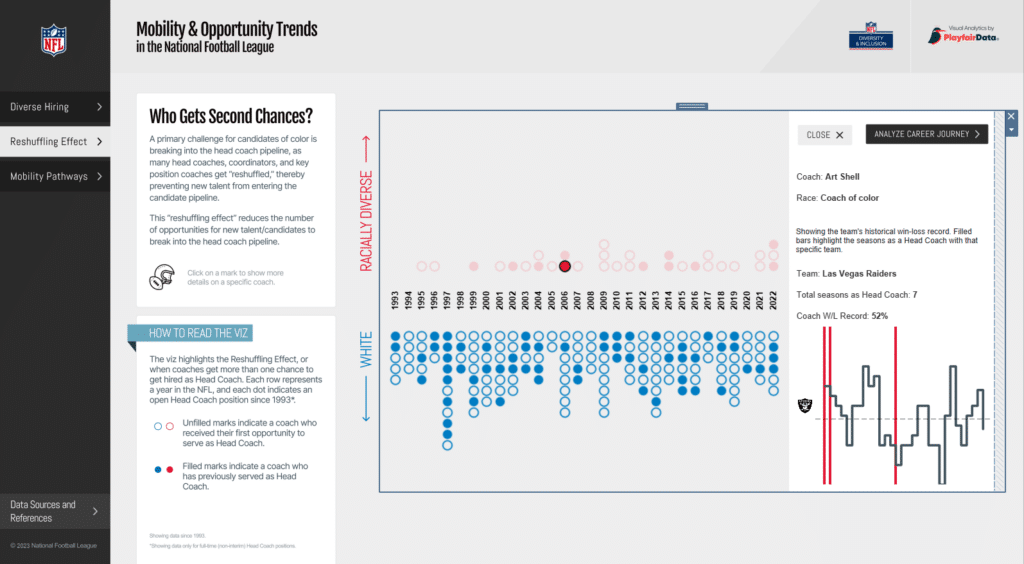
This post will be unique in that we are going to use a real-world example from one of Playfair’s recent projects – the Mobility & Opportunity Trends Report for the NFL. This dashboard is available on Tableau Public, so I encourage you to go check it out.
2023 NFL Diversity and Inclusion Report Visualizations
A quick refresher on dynamic zone visibility
Before we get started, let’s walk through the basics of how dynamic zone visibility works in Tableau. First, any object or “zone” on a dashboard can be controlled with dynamic zone visibility. This includes but is not limited to images, individual sheets, navigation objects, or containers. This allows for an almost endless amount of flexibility in what is shown on your dashboard.
An Introduction to Dynamic Zone Visibility in Tableau
Dynamic zone visibility can be controlled by either a field or a parameter. Tableau states that these must be Boolean, single value, and/or independent of a visual. In other words, you can think of dynamic zone visibility as a switch that’s either “On” or “Off”.
Parameters can be used in conjunction with dashboard parameter actions to control an object’s visibility. For example, a user clicking on a mark that opens a hidden container with more details about that mark. A field can be used if a view is only relevant for a certain user group or category of data. Since dynamic zone visibility is controlled automatically, users won’t need to customize the dashboard for their use case.
![]()
Dynamic zone visibility really is an exciting feature in Tableau. Let’s jump into some advanced tactics that can take your dashboards to the next level.
Continue reading with a free account, or login.
Unlock this tutorial and hundreds of other free visual analytics resources from our expert team.
Already have an account? Sign In
By continuing, you agree to our Terms of Use and Privacy Policy.
How to create custom annotations
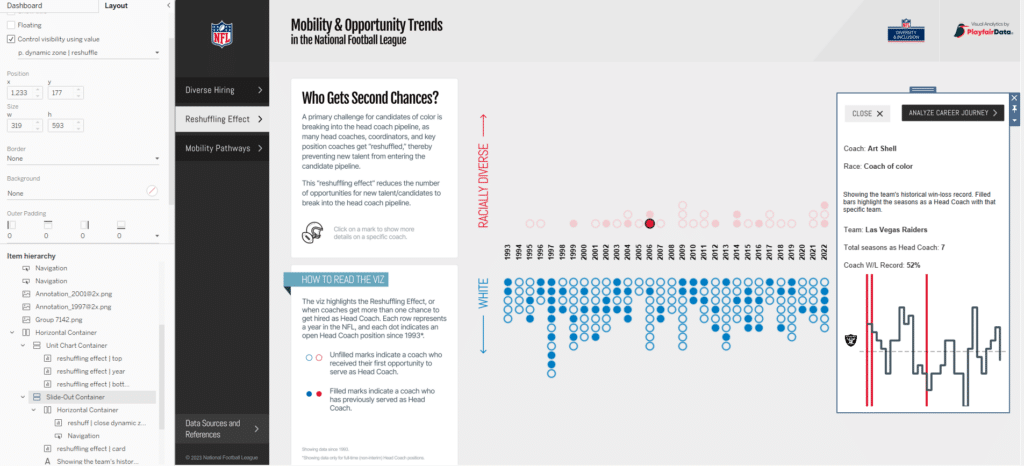
First, I’ll walk through how to create custom annotations that can be hidden using dynamic zone visibility. We used this tactic on the Reshuffling Effect dashboard to achieve custom annotations that turn off if a slide-out view is activated, and turn back on when the slide-out is closed. While Tableau does have built-in annotations, we wanted something with a more customized look and feel that could be “turned off” when the user viewed the slide-out.
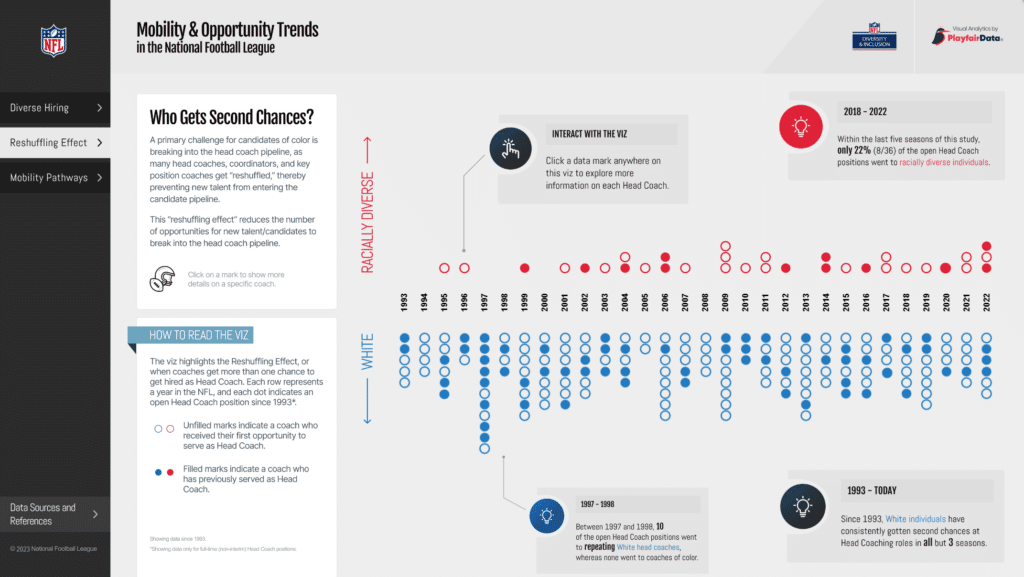
At first glance, it appears the annotations are part of the background image, but each annotation is actually an individual image file. We created these custom annotations in Figma, but you could also use PowerPoint or any image creation software you’d like.
3 Ways to Wow Stakeholders with Figma
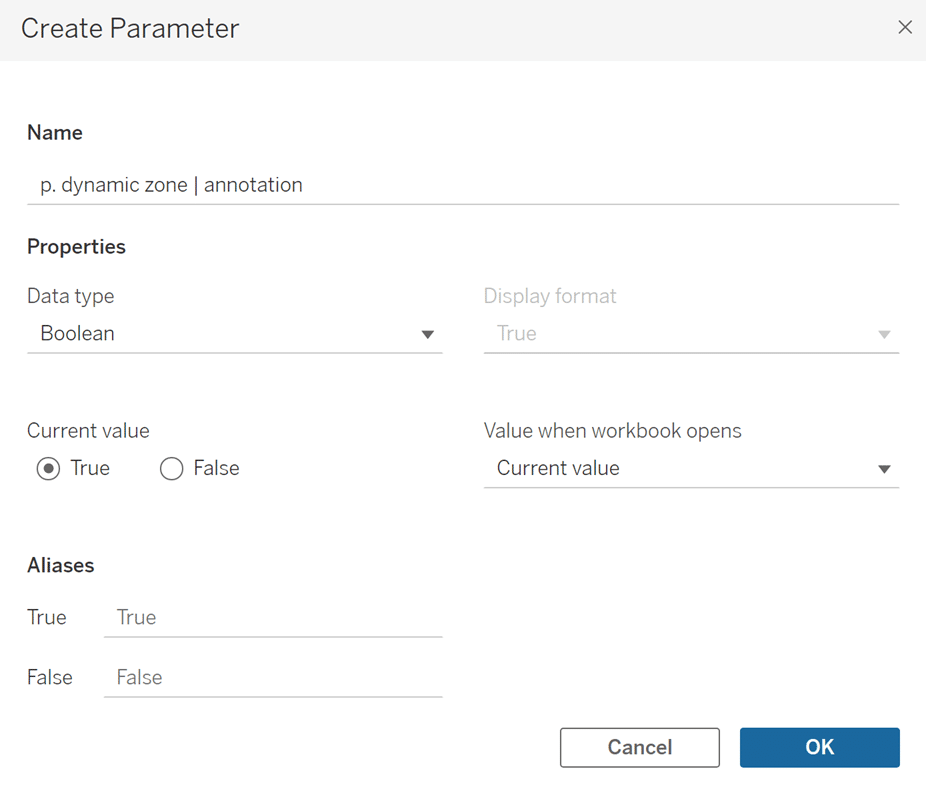
To replicate the disappearing annotation effect, you will need your annotation images and a single parameter. Once you’ve added your background and the visual(s) you will be annotating to your dashboard, add the annotation images as floating objects on the dashboard. Next, we need to create a Boolean parameter that will tell Tableau when to show or hide the annotations, set up like the image below:
Here’s where it gets a little complicated, so bear with me. In order for the annotations to show/hide properly, we need a parameter action associated with each object on the dashboard that can trigger the visibility of the annotations.
In the case of the Reshuffling Effect dashboard, there are three objects that are associated with the annotation visibility:
-
- Top unit chart sheet: Clicking on any mark will result in the annotations being hidden and the slide-out appearing.
- Bottom unit chart sheet: Again, clicking on any mark will result in the annotations being hidden and the slide-out appearing.
- Close button sheet: Clicking this button will close the slide-out and cause the annotations to reappear on the view.
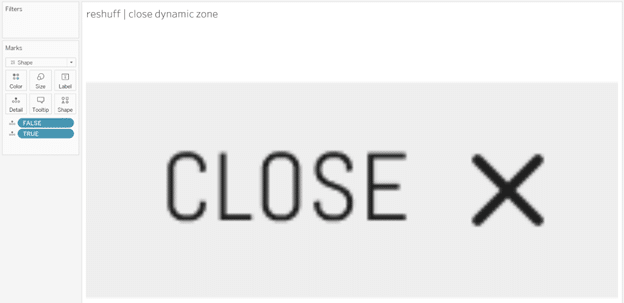
Remember our Boolean parameter from earlier? Each of these dashboard objects needs to be able to switch that parameter from true to false, or vice versa, thus showing or hiding the annotations. This part is actually quite simple. First, double-click the white space at the bottom of the Marks card and type TRUE. Double-click again and type FALSE. Now add these functions to each sheet. This will allow us to pass the true or false value to change the parameter with our parameter action. Here’s a screenshot of what the close button sheet looks like:
💡 Tip: The TRUE and FALSE values created by double-clicking in the white space of the Marks card must be the function TRUE and the function FALSE. Do not wrap TRUE or FALSE in quotations as this will cause them to become String values, not Boolean functions.
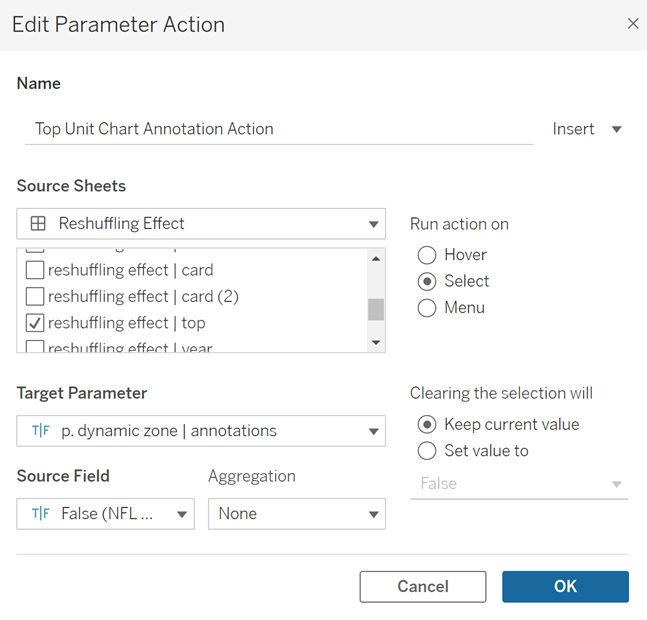
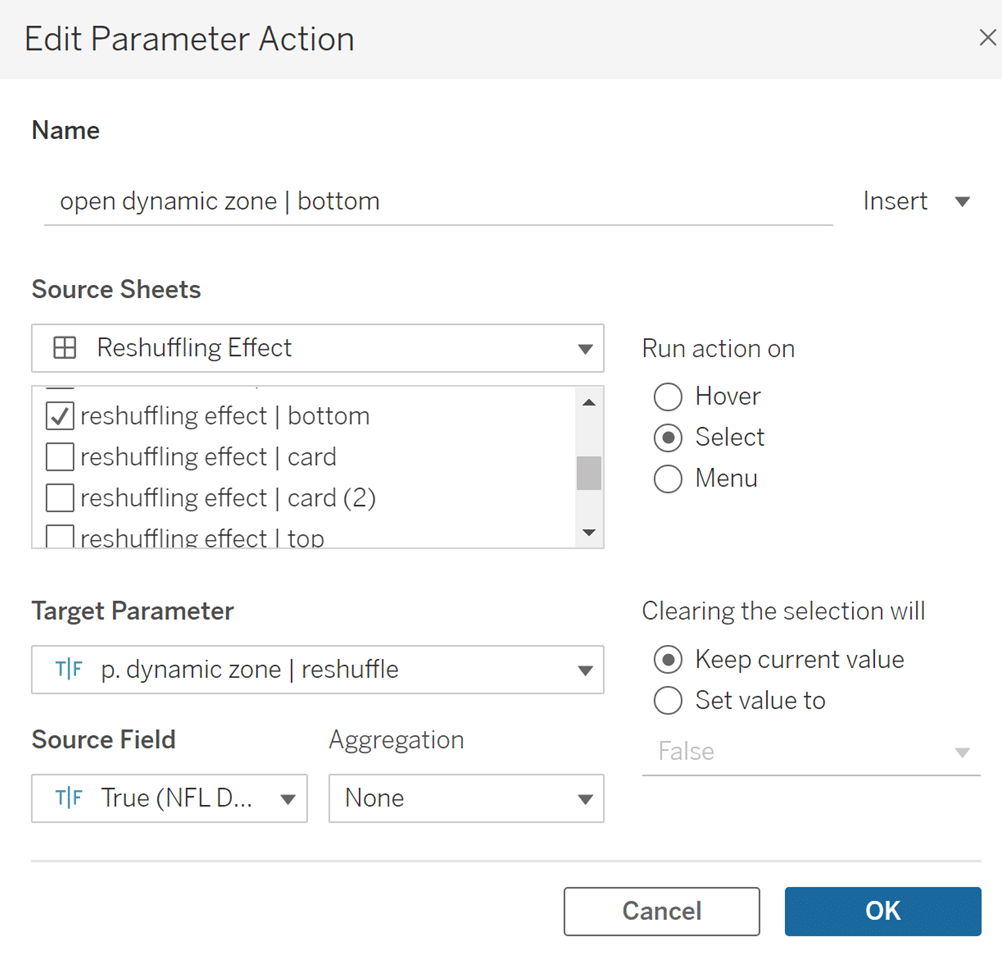
Next, create a parameter action for each object on your dashboard that will show or hide your images. The Target Parameter will be the parameter created earlier, and the source field will be either the true or false function. In the case of the unit chart sheets, my parameter actions look like this, and note that the Source Field selected is False:
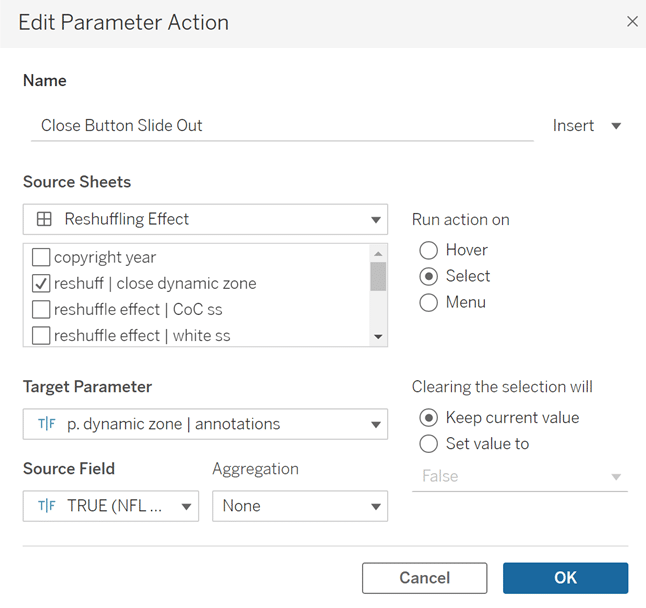
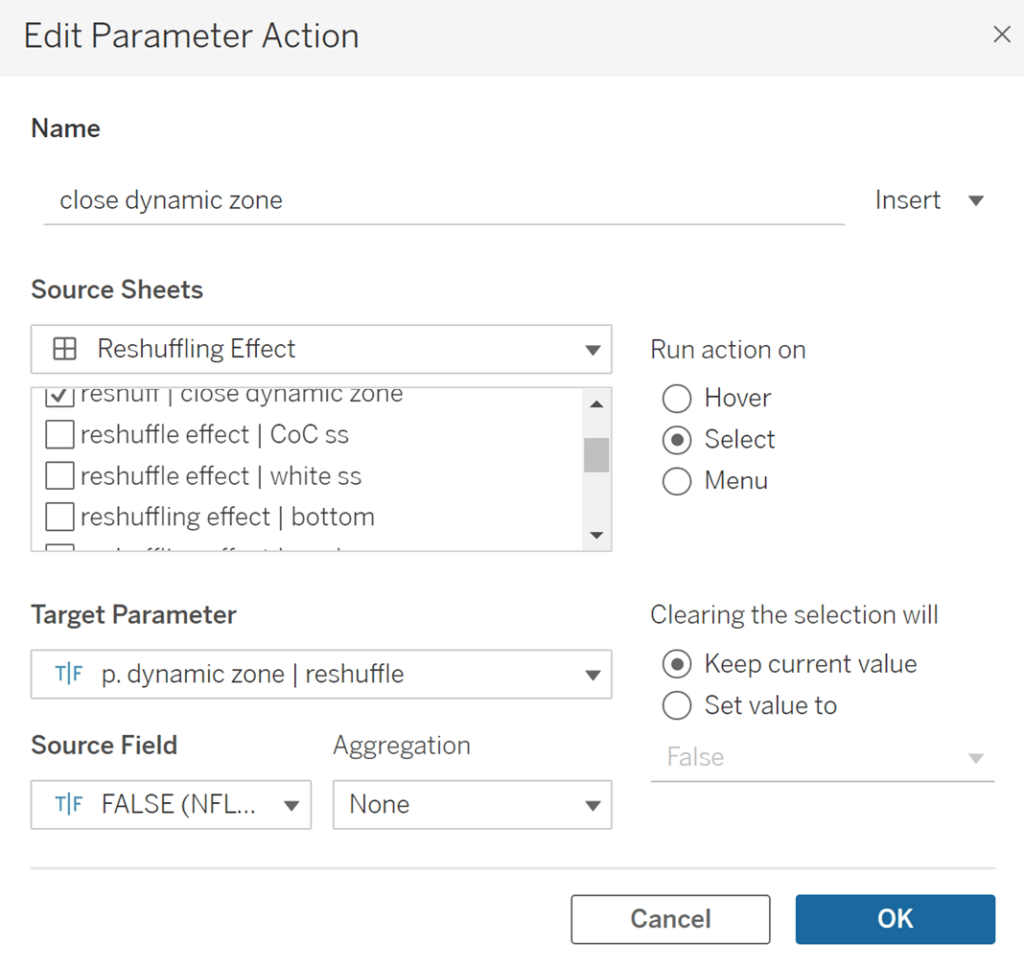
The setup for the Close button is the same, but we need to choose True for the Source Field to tell Tableau to close the slide-out and show the annotations.
We have one last step to make our annotation magic work with dynamic zone visibility. Once you’ve placed your images on the dashboard, click each image and then navigate to the Layout pane. Check the box next to “Control visibility using value”, and in the dropdown under Parameters choose “p. Dynamic zone | annotations”. Voila! Now you have custom images on your dashboard that disappear and reappear with user interaction.
How to create a slide-out
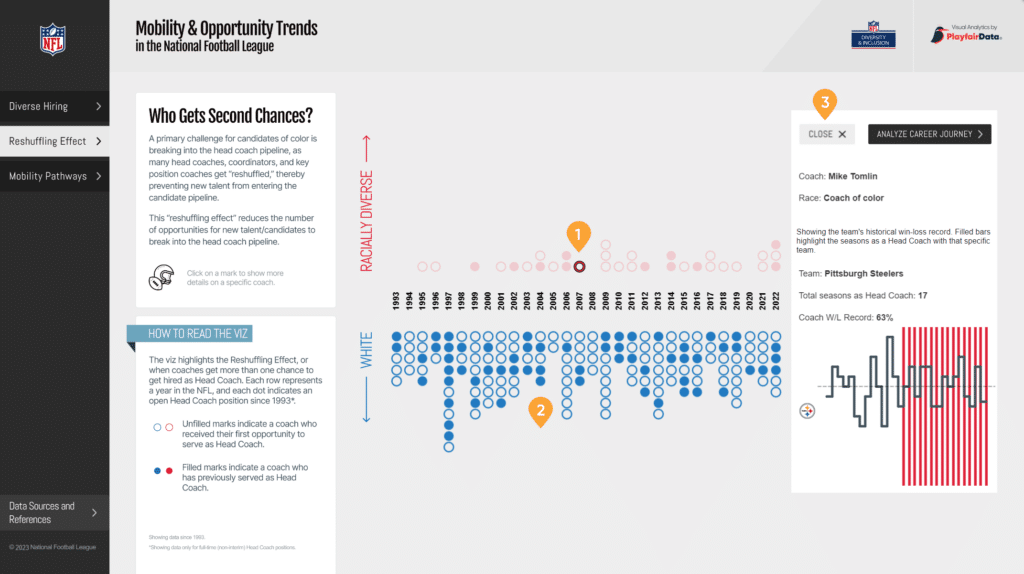
Next, I’ll walk you through the steps we used to create the slide-out functionality on the Reshuffling Effect dashboard.
First, place a horizontal container onto your view. This container will hold two additional containers: one for your main visual and one for your slide-out. In the case of the Reshuffling Effect dashboard, there’s one vertical container with the unit chart sheets and a second vertical container with the slide-out components. The image below shows a red box around these containers in the Item Hierarchy of the Layout Pane.
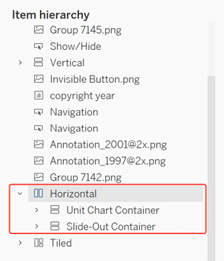
The image below shows the horizontal container with both the unit charts and the slide-out visible.
Once you’ve arranged your containers and their nested visuals on your view, we’ll create a parameter that will control the slide-out user experience. Again, we’ll use a Boolean parameter:

The next step is to set up the dashboard actions that will open the slide-out. Clicking on either the top unit chart or the bottom unit chart will open the slide-out, so we will need one dashboard action for each of these sheets, set up like so:
Here we will reuse the True/False functions that were added to the Detail property of the Marks card for the annotations and set the Source Field as True for both the top and bottom unit chart sheets. This will open the slide-out. Make sure to apply this parameter action to all sheets in your dashboard that will be used to show the slide-out.
![]()
To close the slide-out, we will add a parameter action to the close button sheet, this time with the Source Field set as False:
Lastly, we need to tell Tableau which container will be controlled by dynamic zone visibility. Select your slide-out container, and under the Layout Pane check “Control visibility using value”. Choose the Boolean parameter you created for the slide-out. In my case, it’s called “p. dynamic zone | reshuffle”.
Conclusion
And that’s it! Now, you have a slide-out that shows additional information about the marks on your view.
I hope you’ve enjoyed this dive into some advanced dynamic zone visibility tactics in Tableau. Custom annotations and slide-outs have so many use cases, and can be easily customized or tweaked to match the user experience you’re trying to create on your own dashboard. I’m looking forward to seeing what else the Tableau community comes up with!
Happy vizzing,
Alyssa


Written By
Alyssa Huff

Peer Review
Megan Spengler
Manager, Decision Intelligence

Peer Review
Dan Bunker
Manager, Decision Engineering
Related Content
Enhancing UX with Interactive User Guides in Tableau
An effective user guide is a powerful tool when it comes to helping any user get the most out of…

Ethan Lang
Six Components of Layered Graphics Layering graphics is a technique found everywhere in data visualization. From coding in R to…
5 Lessons Learned from Designing Executive Dashboards: the Financial Analysis Swift

Creating a great executive dashboard for finance takes careful attention to design principles and a solid understanding of user needs.…