3 Innovative Ways to Use Image Role in Tableau
In version 2022.4, Tableau Desktop introduced us to a brand new feature: Image Role. This UX-enhancing tool allows users to display images as dimensions by including image URLs in datasets. While this is a very versatile feature and has many practical applications, today we’ll be highlighting and demonstrating three use cases for Image Role. I’ll then show you how to apply this technique to your own projects and how to avoid common pitfalls when using this tool. Let’s get started!
How to Make Indicators with Custom Shape Palettes in Tableau
By the end of this tutorial, you will be able to use the Image Role feature in Tableau Desktop to map flags, custom branding, and/or avatars.
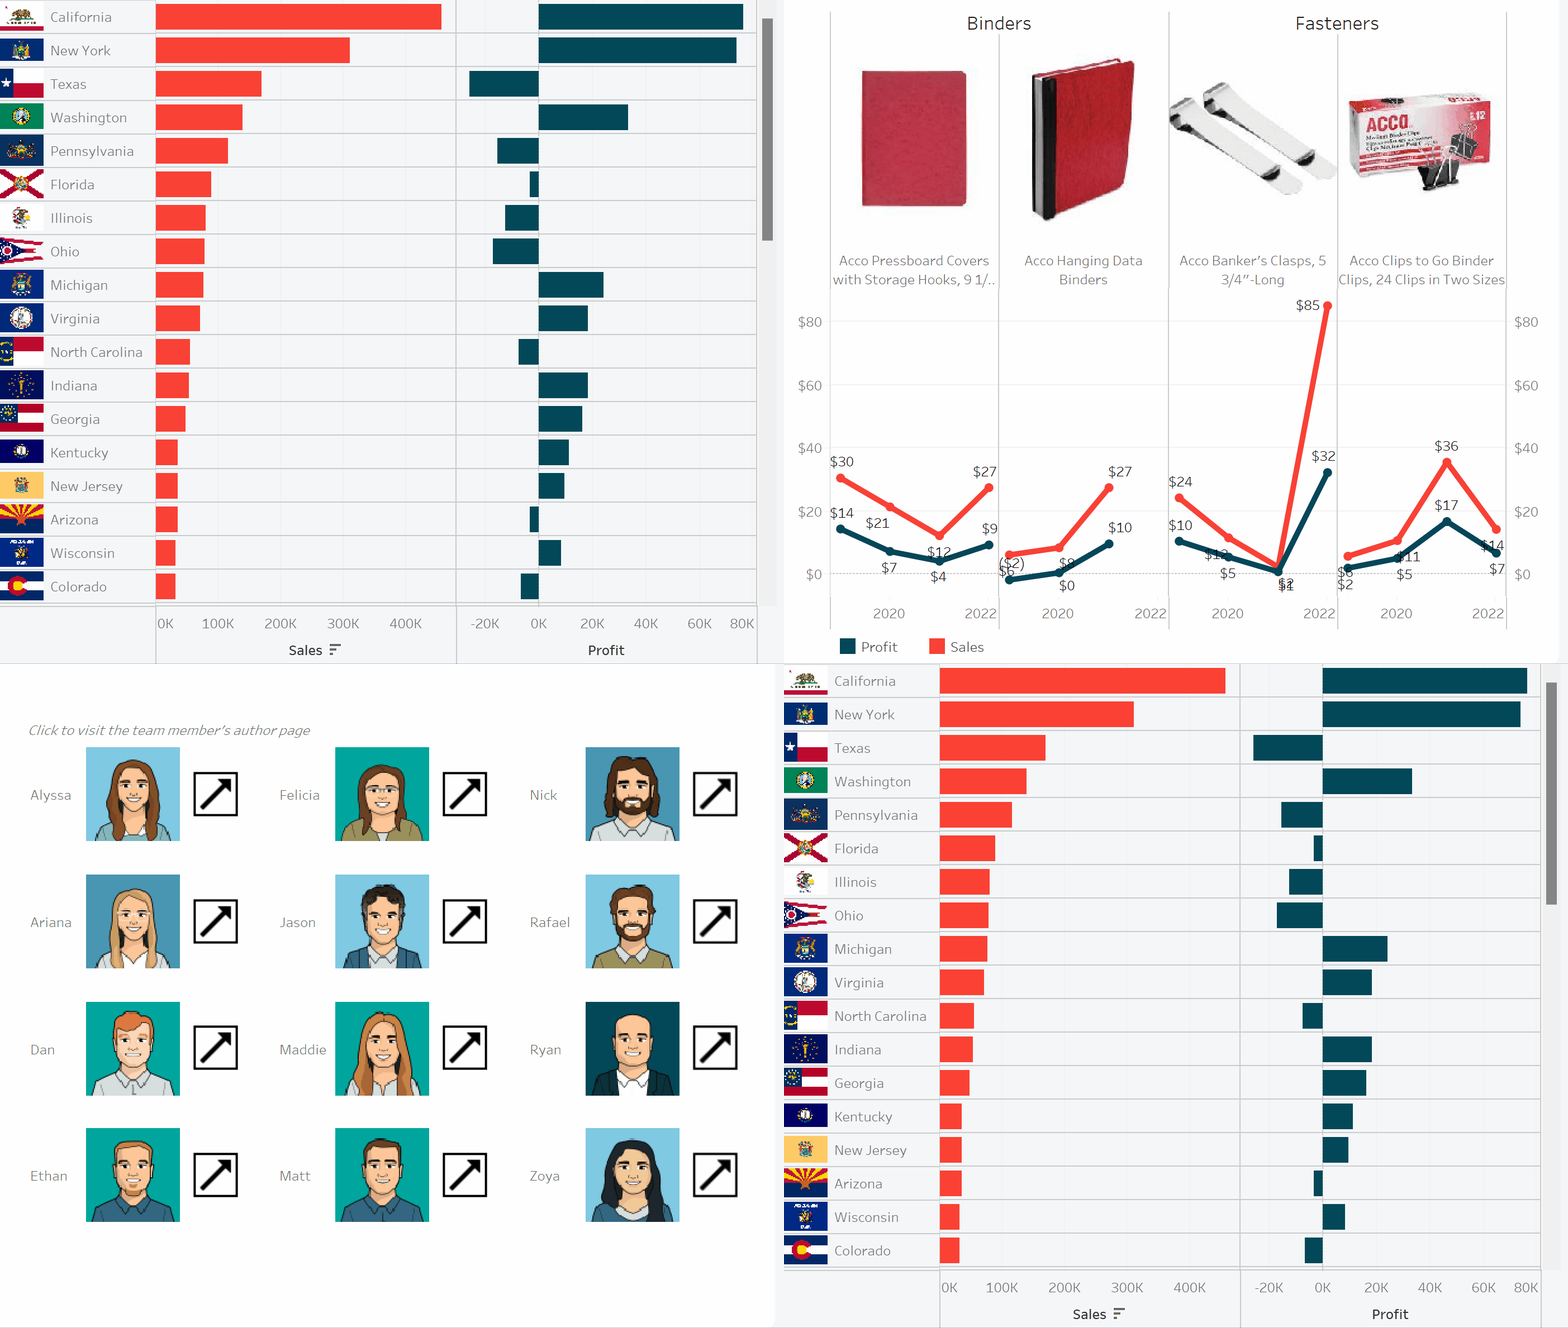
Three image role use cases explained
Use case #1: Flags
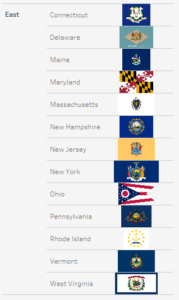
Flags and regional data are a natural pairing. Here, I’ve used flag images from the Wikipedia Commons to add state flags to the Superstore data.

@LunarModule7 on Twitter has a similar list compiled for country flags. Image Role can only display a flag as a row or column header, so displaying flags in the chart body (or on a map) still requires custom shapes.
Create a free account, or login.
Unlock this tutorial and hundreds of other free visual analytics resources from our expert team.
Already have an account? Sign In
Use case #2: Products, brands, and logos
Using images instead of cryptic product names or item codes is an easy way to improve the user experience and decrease the time to insight. Here I’ve added product images for some of the Superstore product names.

With the superstore dataset, I could have also added manufacturer logos. Using images to represent a cohort of data is impactful for other kinds of data too. For example, a marketing dashboard could use the logos of different advertising platforms or icons indicating different email campaigns.
Use case #3: Avatars
Avatars are a great way to put a face on the data literally. This adds value to datasets about people, including team members, actors, athletes, politicians, etc. In the example below, I’ve brought our team’s avatars together with their author pages to create a quick navigation tool.

Our classic Blockbuster visualization uses avatars in a similar way.

More complex use cases pair avatars with the USERNAME() function to personalize a dashboard. The USERNAME() function returns the viewer’s username according to their Tableau Cloud (or Server) login. With this information, the dashboard could detect who is viewing the dashboard and display a ‘logged in’ avatar in the corner, just like Tableau Cloud, Google, and other platforms. A similar approach could display the avatars of the user’s direct reports, support team, or client profiles.
How to use Tableau Image Role
Image Role is pretty picky about the images it will display. It took me at least five attempts to get our avatars to appear! I recommend focusing on a few images to start. Start the process with just those URLs, get the image data for them into your workbook, and make sure that everything works as expected with your sample images. This way, if you need to change the URLs or joining keys there will be less rework required.
Find URLs for the images
To retrieve the URLs for our team avatars, I first navigated to the Playfair Data blog page, right-clicked an avatar, and selected ‘Open image in new tab’. On the new tab I deleted the first question mark and all of the characters after it. Then I added the suffix .png to the url.
https://secure.gravatar.com/avatar/b04c3af34c1a4c0683b138e0684af89a?s=96&d=mm&r=g
https://secure.gravatar.com/avatar/b04c3af34c1a4c0683b138e0684af89a
https://secure.gravatar.com/avatar/b04c3af34c1a4c0683b138e0684af89a.png
Image Role requirements include:
- File Size under 128 kb
- URL must be Publicly Accessible
- PNG or JPG file type
- URL must end in .png .jpg or .jpeg
For the size requirement, images smaller than a business card almost always work. Tableau cannot log in to your internal sites, so ensure the images aren’t in password-protected spaces. This means proprietary images should not be used with Image Role. Generally, URLs for small images that already have the correct suffixes are the easiest to get working. If you have the choice between two image resolutions or sizes, choose the one closest to the desired size on the dashboard.
Add URLs to your Data
When you have a few URLs, save them in a lookup table along with a key to join on. In the example below, my joining key is the state name.

Then bring your image lookup table into your data model with a join or relationship. In the image below, you can see that I’ve added both Product Images and State Flags into the Superstore data source using relationships.
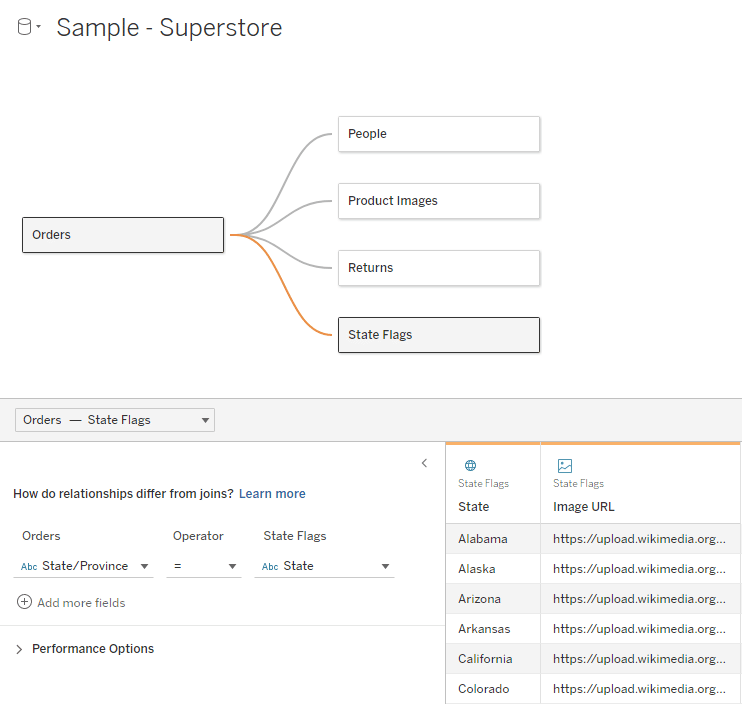
Once the lookup table is created it can be reused in any relevant dataset!
Assign Image Role
Now that the URL is in your dataset, go to the field and click on the Data Type icon and update the Image Role setting from None to URL.
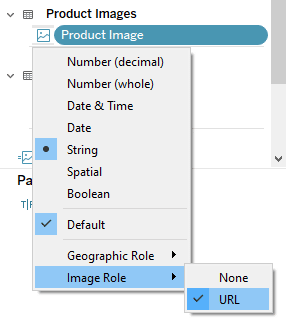
If you want to use the URL as both a string and an image you can copy the field and set the image role on one, and leave the other as a string data type.
Add images to the worksheet
Add your field to the Rows or Columns shelf. Currently, we can only use Image Role in the headers section of the dashboard. Any images inside the pane need to be added as custom shapes or as image objects as a separate layer on the dashboard.
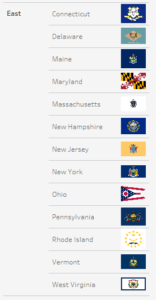
Unfortunately, the image alignment and fit cannot be adjusted. The image will be centered in the space allotted and will fill the space until limited by width or height. Images (especially flags) may not share the same dimensions. For example, each flag in this column appears to have a different width. To fix this, we can shrink the column width. This limits each flag by width instead of height and forces them into alignment. A similar approach can be used to vertically align images on the Columns shelf.
What if the images don’t appear?
Here are some troubleshooting tips:
- Filter your view to show 30 or fewer images.
- Turn off Image Role and check that the URLs are appearing as expected. If they aren’t, then review your join.
- Make sure the URL ends in .png .jpg or .jpeg
- Make sure the URL is accurate and publicly accessible
- Check your image size
Additional tips for using Image Role
To get the best image resolution try to match the original image size.
Watch out for varying row counts. Images will expand to fit the size allotted and are always centered. You may wind up with a lot of variation in image size or with tiny images floating in the middle of a sea of rows.
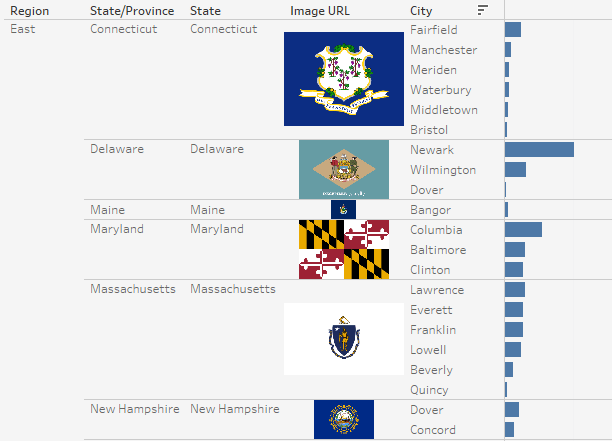
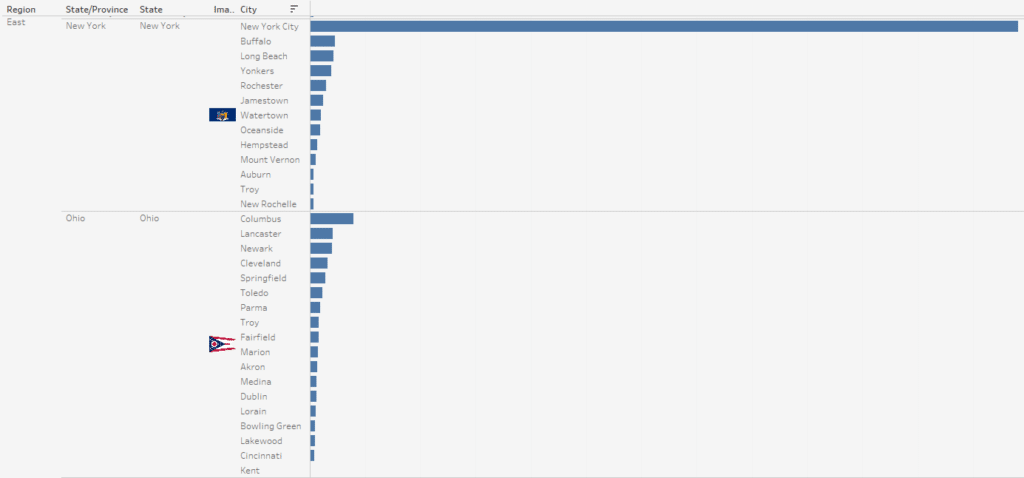
The URL will appear when the user hovers over the image, so make sure the URL is safe for work! I tried aliasing the URL to act as alt text for a screen reader, but this does not work. Aliasing the URL currently prevents images from loading.
Fields with image roles can be referenced in calculations and are treated as strings. If the calculation output is an image, the calculation itself must be assigned an image role. We can use a calculation with two image outputs but can’t toggle between an image and non-image. Below I was able to toggle between product and state flag images using a parameter.
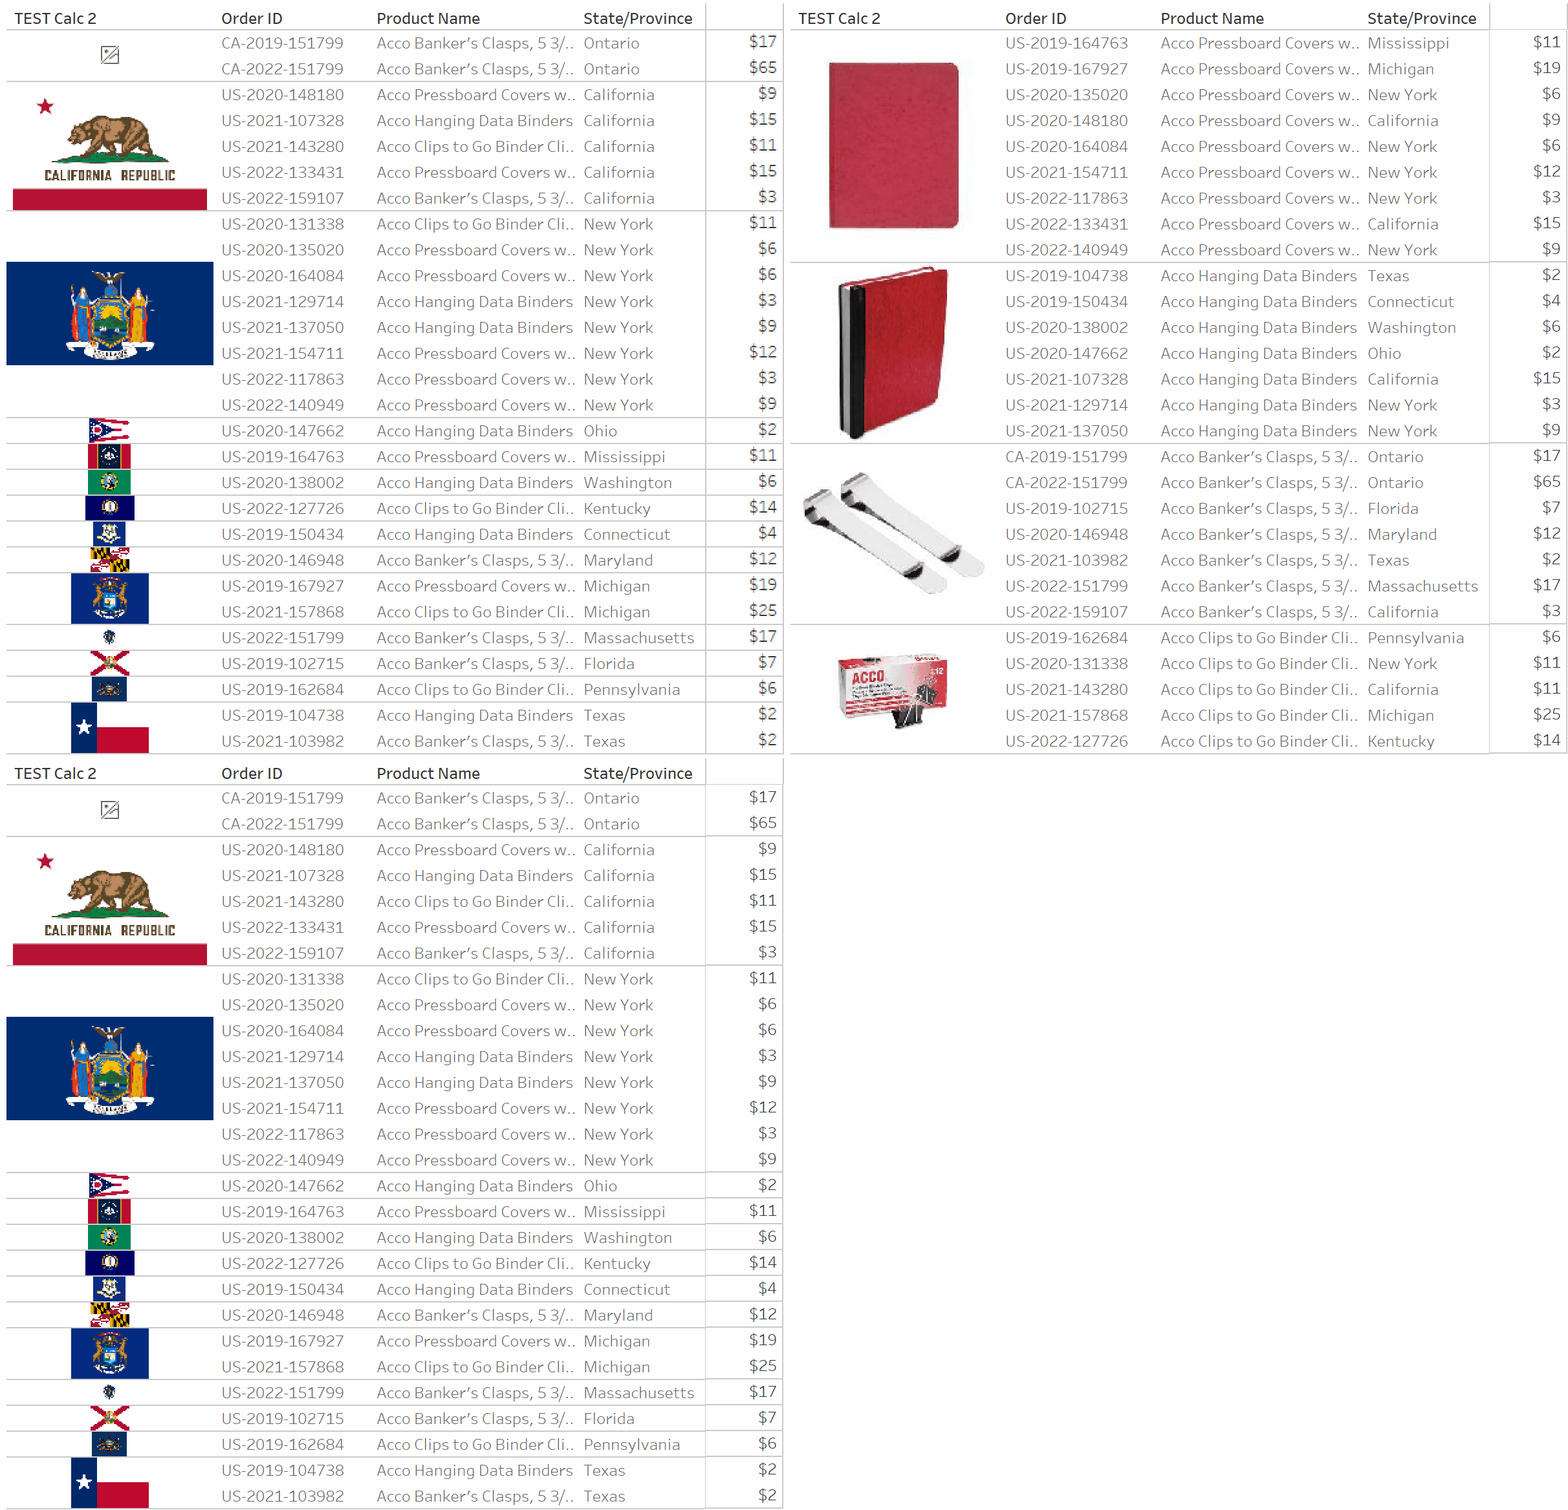
As you can see, Image Role is one tool to take advantage of when jumping into this new year! When it comes to UX enhancement, it’s the seemingly sub-conscious details that will really help your project shine and ensure effortless functionality for your end-users. While it may be a bit tricky to nail down at first, a little bit of practice can go a long way in the overall user experience provided within your project dashboard.
– Felicia Styer
Related Content
3 Ways to Optimize Tableau Workbook File Size
Are you running into file size issues when you attach Tableau workbooks to emails? Has IT asked your team to…
Bringing Tables Together: Tableau’s Physical Layer
Welcome to our series on bringing tables together! This first article is all about the physical layer in Tableau, including…
Ryan Sleeper
Make tooltips more engaging and branded with custom shapes Maximize dashboard real estate by adding any image you want to…


