3 Ways to Optimize Tableau Workbook File Size


Are you running into file size issues when you attach Tableau workbooks to emails? Has IT asked your team to delete files or buy another server? Is your personal computer running out of storage?
Images and data are major contributors to Tableau workbook size. The easiest ways to reduce workbook size are minimizing images stored in the workbook and eliminating or reducing the data extract. In this post, we’ll share our tips and tricks for doing just that.
Reduce or consolidate dashboard images
First, let’s talk about how to optimize your workbook size by reducing or consolidating the images in your dashboard(s). Image files from both custom shapes and images added to a dashboard can increase the final file size. This isn’t to say that you should never use custom shapes or images in your workbooks, but by thinking strategically, we can reduce the total number of images used.
![]()
Here at Playfair, we use software called Figma to design and create the background images and other image assets for our dashboards. You can use Figma, or any other design tool you like to create your dashboard design assets (e.g., a background, icons, or a logo). Once you’re ready to export your design assets, aim to include as many of the dashboard elements as possible in the background image itself. Some examples of this include:
Continue reading with a free account, or login.
Unlock this tutorial and hundreds of other free visual analytics resources from our expert team.
Already have an account? Sign In
By continuing, you agree to our Terms of Use and Privacy Policy.
-
- Buttons that don’t change state when clicked (e.g., a navigation button)
- Titles, headers, and other static text
- Legends and explainer text that adds context for the user
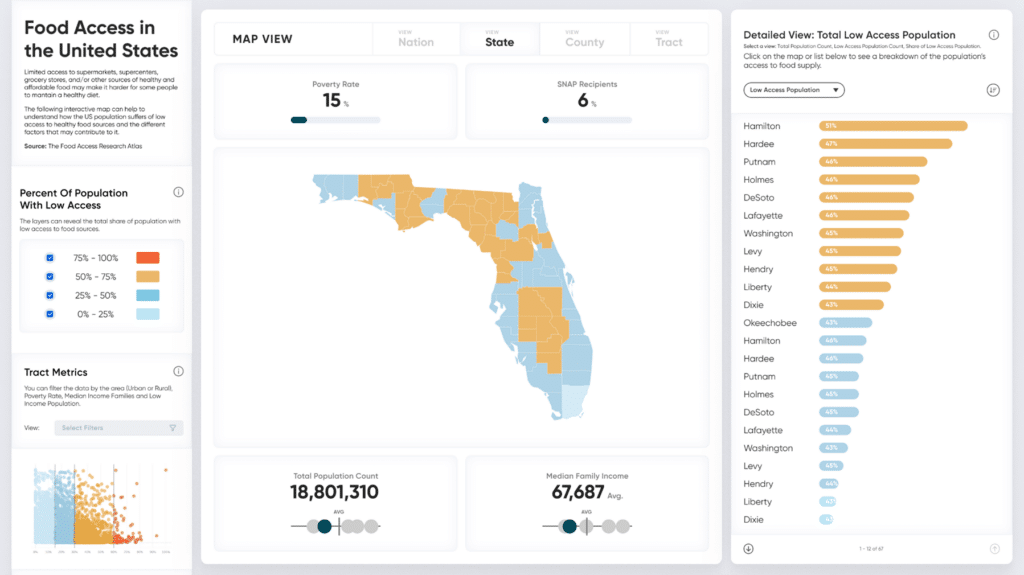
Let’s take a look at this workbook on Food Access in the United States so I can show you what this looks like in practice. Here’s a wireframe, or mockup, of what the dashboard will look like once it’s been engineered in Tableau. There are lots of text elements, buttons, and filters.
Here’s what the background image looks like when it’s added to Tableau. By including as much as we can in the background, we’ve reduced the number of objects on our dashboard as follows:
-
- 21 text boxes for titles, headers, descriptions, legends, and explainer text
- 16 images, including containers, color legends, and info buttons
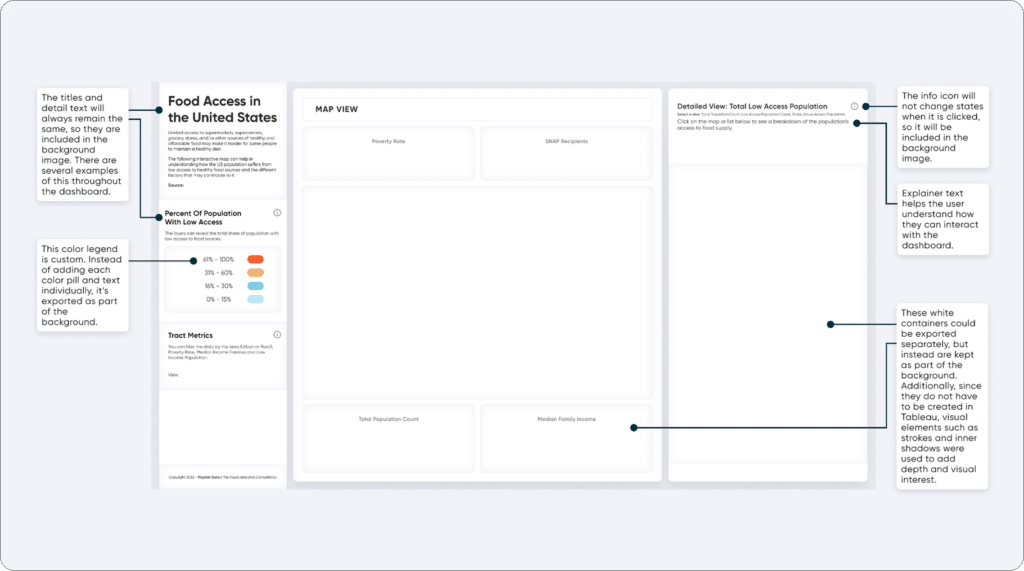
That’s 37 potential dashboard objects that we’ve reduced to a single object! (Bonus: It’s easier to align and resize elements in Figma, saving you time and effort there too.) I hope this example illustrates how straightforward it can be to reduce the number of images on a dashboard and help you reduce the file size on your packaged workbooks going forward.
Replace custom shapes with Image Role
When it comes to custom shapes, I recommend using the following criterion to determine whether or not to use them: Does Tableau have a default shape palette that meets my needs and fits with the design aesthetic? If the answer is yes, I can skip taking the time to create and add a custom shape palette, thus preventing an increase in the number of image files included in a packaged workbook. If the answer is no, there’s one more workaround: Image Role.
Image role uses URLs in the dataset to pull online pictures into views. This reduces workbook size because the images are stored online instead of inside the .twbx file. The images don’t work exactly like custom shapes, so consider these factors when deciding which method to use:
-
- Number of Images – replacing custom shapes with Image Role has a larger impact as the number of images increases.
- Image Usage in Workbook – Image Role can only be used in headers. If you want to use images in the body of a chart (e.g., as labels on a map) or you want to control their color or size through the marks card, then you’ll need custom shapes.
- Are the Images Online – Image Role requires the images to be saved online. There are a lot of great online sources for icons and flags, but if you’re working with local image files, then custom shapes will be easier.
A good application of Image Role would be adding Flag icons to a table of countries. It has a lot of images, the images are used as headers, and the icons are easy to find online.
3 Innovative Ways to Use Image Role in Tableau
Eliminate the data extract or reduce data size
Often the largest part of a workbook is the data. With local files, we can control whether an extract is generated and then whether it is saved inside or outside of the larger workbook.
On the Data Source window, we can choose a Live or Extract connection.
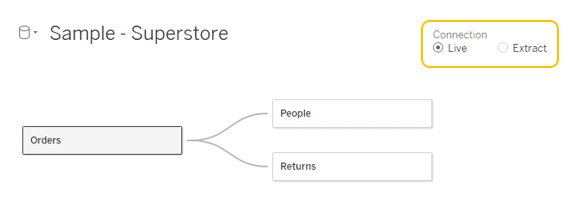
With extract connections, a local extract is generated, and that extract is referenced as the user interacts with the data. This improves performance but creates an extract outside of the database. If the file is saved as a packaged workbook, this could dramatically increase the file size. With extract connections, the extract must be refreshed before changes to the data source will appear in the workbook. By default, Tableau stores these in the Datasources folder of your Tableau Repository. Make sure to check this folder if you’re trying to free up space on your computer.
![]()
A live connection does the opposite – each time the user changes the view it re-pulls the data directly from the source of the data connection.
One way to transform extracts into live connections without constantly hitting the database is to publish the extract. Then the extracted data is saved to Tableau Cloud or Server instead of locally. The local workbook can have a live or extract connection to the published data source.
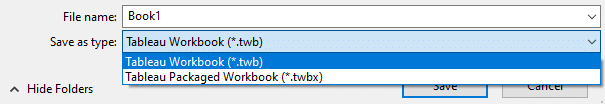
When we save workbooks, we can choose to include or exclude the data in the saved file. If you save as a .twb file, no extracts will be included in the workbook. Saving as a .twbx creates a packaged workbook which includes data extracts.
With live connections and .twb files, when you share the workbook with others, they’ll be prompted to connect to the data source by logging into Tableau Server / Cloud, logging into the data source, or locating a local extract file.
If an extract is necessary, we can reduce its size by cleaning and restructuring the data. When you finish creating your views, hide the unused fields. The next time the extract is generated, those fields will be excluded. To reduce rows, consider filtering and aggregating your data. This could be done in the database, in Tableau Desktop’s Data Source window, or with a data preparation tool like Tableau Prep or Alteryx. One common change is limiting the extract to just the relevant time period by applying a Data Source filter.
9 Quick Alteryx Tips to Optimize Your Data Workflows
Conclusion
Thanks for joining us! We hope these tips help to optimize your workbook size in the future!
Felicia Styer & Alyssa Huff


Written By
Felicia Styer

Written By
Alyssa Huff

Peer Review
Maddie Dierkes
Manager, Decision Science
Related Content
9 Quick Alteryx Tips to Optimize Your Data Workflows

When beginning to develop an Alteryx workflow, sometimes I find myself asking, where should I start? What happens next? How…
How to Run and Interpret the Tableau Workbook Optimizer

Imagine you’ve just spent days, weeks, or maybe months creating the perfect dashboard. It has an eye-catching design, cutting-edge UX,…
3 Innovative Ways to Use Figma in Your Visual Analytics Projects


What does design software have to do with visual analytics software like Tableau? At Playfair Data, we approach our visual…