How to Run and Interpret the Tableau Workbook Optimizer

Imagine you’ve just spent days, weeks, or maybe months creating the perfect dashboard. It has an eye-catching design, cutting-edge UX, and features every data insight you desire. Now it’s time to demo your sparkly new tool… but a single click takes 60+ seconds to load. Maybe it’s a passion project you are showing to friends or an analytical dashboard for a client; either way, the awkward silence while you wait for a filter action to run can distract from everything else you have accomplished. This is where performance optimization comes in! Tableau’s handy Workbook Optimizer tool highlights issues affecting performance speed and provides solutions to fix them. In this blog I will discuss how and why to use the Tableau Optimizer, ways to keep optimization in mind when building your dashboard from the start, and common errors to avoid.
Keep in mind this feature was introduced with Tableau 2022.1, and the Workbook Optimizer does not exist in older versions. In this tutorial, I am using 2023.1, so some features may be different depending on which version you have.
How to run the Tableau Optimizer
If you have never used the Workbook Optimizer before, you can find it by clicking “Server” from the top menu bar, and selecting “Run Optimizer.”
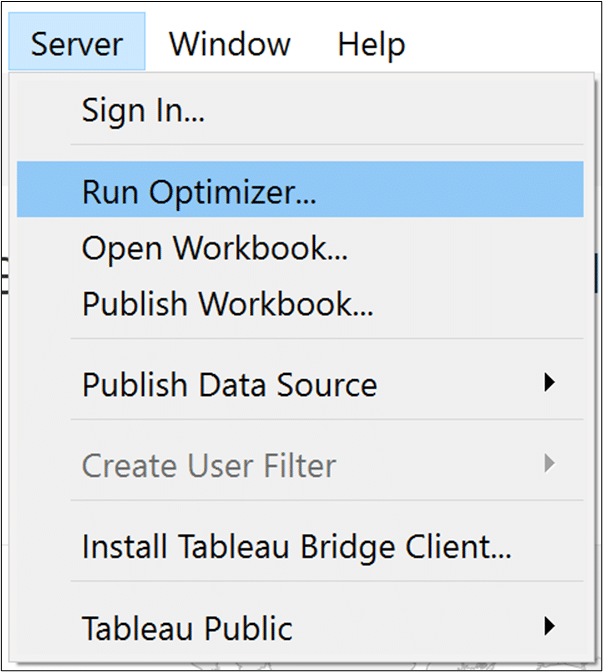
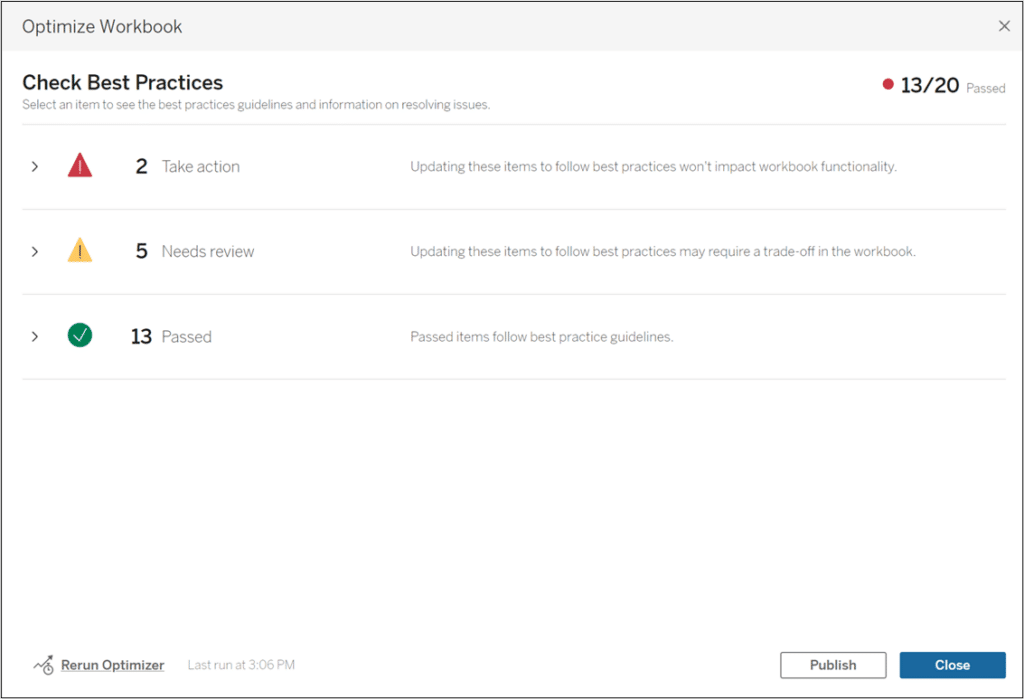
Tableau has established 20 best practice guidelines for speed optimization, and your score breaks down each of these guidelines into three categories: Take Action, Needs Review, and Passed. The issues under “Take Action” are quick fixes, but the issues under “Needs Review” may not be possible with your data or could take time and effort to correct.
Continue reading with a free account, or login.
Unlock this tutorial and hundreds of other free visual analytics resources from our expert team.
Already have an account? Sign In
By continuing, you agree to our Terms of Use and Privacy Policy.
With version 2022.4 or later, you have the option to “Ignore this rule” if a best practice does not apply to your workbook. Some guidelines also give you the option to “Fix the rule” automatically, like hiding unused fields.
Each guideline has a short blurb explaining how the rule affects your workbook performance, as well as a link to additional information.
Optimize from the start
I highly recommend reviewing Tableau’s 20 guidelines to make a plan before building your dashboard and will share what I have found to be helpful tips to consider.
![]()
First, make sure to practice good data prep! Don’t use more data than you need. Optimize your data by including calculations in your data source, and use an extract if possible.
9 Quick Alteryx Tips to Optimize Your Data Workflows
Nested calculations
If you know you will be using a lot of calculated fields, try to map them out before jumping in and building views, especially if the calculated fields will be dependent on each other. Nested calculations add an additional layer of processing, which can negatively affect speed optimization. I’m not saying to avoid nested calculations altogether, but if you plan on writing any complicated calculations, especially conditional statements, brainstorming different ways to write your calc can save you time in the long run.
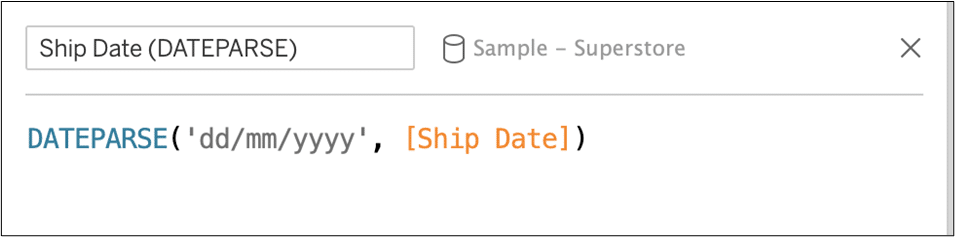
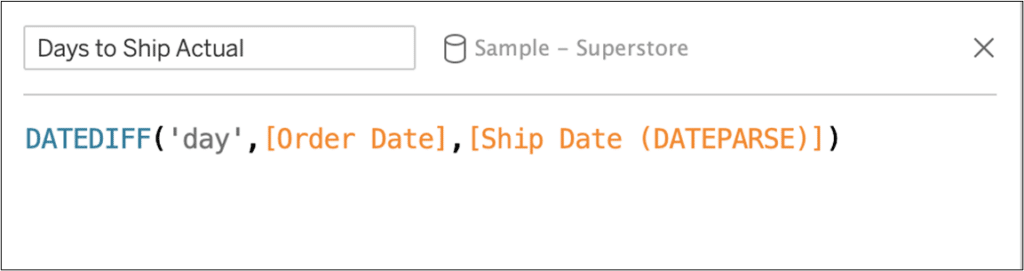
Date calculations
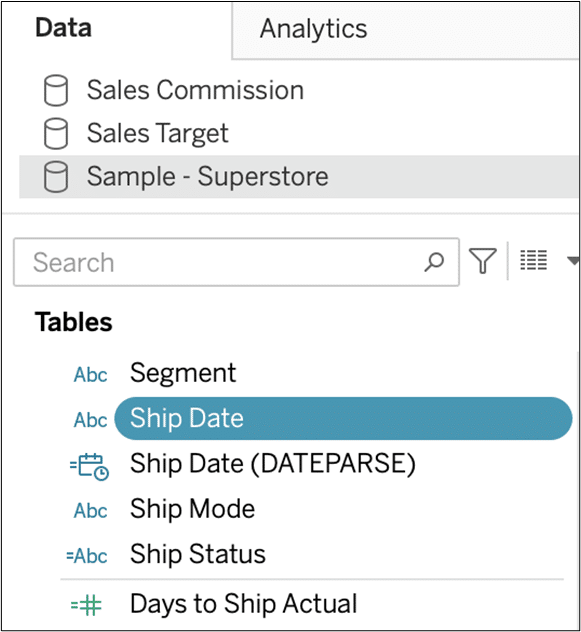
Always minimize date conversions and calculations when possible. Date calculations typically take longer to process than other data types, so make sure your data is in the desired format before loading. For example, see the below image of the Data pane where the field “Ship Date” is a string, and DATEPARSE was used to convert it from string to Datetime format. Now the calculated field “Days to Ship Actual” is considered a nested calculation using “Ship Date (DATEPARSE)”, which could be avoided if Ship Date had Date or Datetime format in the data source.
Expression performance hierarchy
Not all calculations are created equal!
- When writing a conditional statement, try using CASE/WHEN over IF/THEN as it typically performs better, and always write the most common outcome first. When conditional statements are processed, Tableau stops as soon as a condition is met, and you will save computing time.
- Next, if you are writing an IF/THEN statement, use ELSEIF over ELSE IF. Tableau processes ELSE IF as two separate logical statements, whereas ELSEIF is viewed as a single statement.
For example, this version of a calculated field…
IF [First Name] = “William” THEN “Playfair” ELSEIF [First Name] = “Megan” THEN “Spengler” END
…will process faster than this version:
IF [First Name] = “William” THEN “Playfair” ELSE IF [First Name] = “Megan” THEN “Spengler” END END
- Immediate If (IIF) statements are another option that stop once a condition is met, but there is no major difference in performance when compared to IF/THEN.
- Table calculations typically execute quicker than LOD expressions, but the performance really depends on your data source. If possible, I would recommend comparing dashboard performance with and without a specific table calculation or LOD expression to determine which works best for you.
The Beginner’s Guide to Tableau Table Calculations
Text formatting
If you need static text elements on your dashboard, try adding them to your background image or using text boxes instead of creating additional sheets. The fewer dashboard elements you have the better, but sheets take longer to render than text boxes.
![]()
Takeaway
Now that we have reviewed Tableau’s best practices, I hope you can see why it’s efficient to think about optimization before building out your dashboard rather than trying to optimize your dashboard retroactively. And don’t forget, you can run the Tableau Optimizer on your workbooks as many times as you want, so checking your optimization score as you work is always a great idea.
Thanks for reading, and happy optimizing!
-Megan

Written By
Megan Spengler

Peer Review
Matt Snively
Sr. Manager, Analytics Engineering
Related Content
3 Ways to Optimize Tableau Workbook File Size


Are you running into file size issues when you attach Tableau workbooks to emails? Has IT asked your team to…
9 Quick Alteryx Tips to Optimize Your Data Workflows

When beginning to develop an Alteryx workflow, sometimes I find myself asking, where should I start? What happens next? How…

Ryan Sleeper
“You can’t have data visualization without data.” Ryan shares tips around this critical pillar of data analytics and visualization. Hear…