9 Quick Alteryx Tips to Optimize Your Data Workflows

When beginning to develop an Alteryx workflow, sometimes I find myself asking, where should I start? What happens next? How do I take this data and turn it into the end goal of my project? Alteryx has so much functionality, but that can make it difficult to organize and visualize your workflow at conception. To aid in your Alteryx journey, I’ve compiled 9 Quick Alteryx Tips on how to build out a workflow from start to finish.
These are the tips that I’ve found to work best, discovering many of them through training and even trial and error. This quick start list is in the sequential order of my general workflow development process. My process includes: developing with the end in mind, QA as you go, and keeping the workflow optimized. I hope you find these tips to be a helpful guideline or checklist that you can refer back to during your workflow development.
Develop with the end in mind
Input data
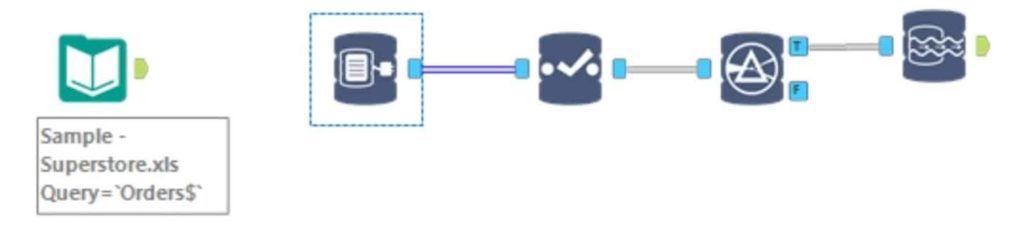
Green “Input Data” – Use this if connecting to any data source that is not housed in a database, data lake, etc.
“Connect In-DB” – Use this set of tools to build out a query connecting into a housed data source (ex. SQL server database, Redshift, etc.) then use “Data Stream Out” to download the data into your workflow. Query language will be specific to database.
![]()
💡 TIP – Why use In Database when you can just use a green Input Data? Alteryx uses your computer resources to process data. With a green Input Data, it will download the entire table to push that data through to the rest of your workflow. By using In Database tools, you will be able to parse the data down to just what you need from the table via a query within the housed system. This means less data will be downloaded to process, resulting in a faster workflow.
For example – you are pulling a table that contains every sale for the last 10 years (20 million sales/rows of data). If you pull in a green Input Data, your computer will download all 10 years of sales. By using In Database tools, you can filter to something like just sales from the last year before Data Stream Out. So instead of starting with and trying to process 20 million rows of data, you will only start with and process 1 million rows of the last year of sales.
💡 TIP – If your input is taking a long time to load due to a large dataset, you have some options while you develop:
Continue reading with a free account, or login.
Unlock this tutorial and hundreds of other free visual analytics resources from our expert team.
Already have an account? Sign In
By continuing, you agree to our Terms of Use and Privacy Policy.
Try caching the input; this will take a while to load initially, but could be much faster each run thereafter.
Use In Database or the Sample tool to query a smaller subset of data just for development (example – just 1 year, etc.), then remove the filter once you have completed the workflow. You also have the option to write this smaller subset to a file to use as an input while you develop. That way you will not need to hit the housed data each run (if you choose not to cache).
Select
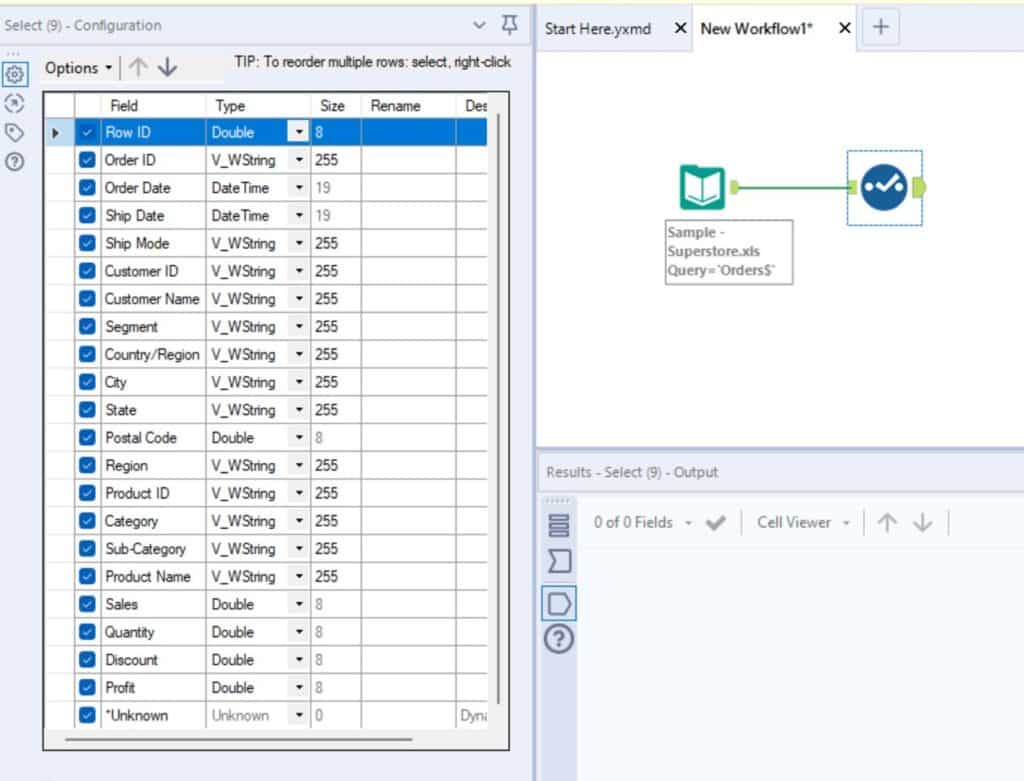
Use a “Select” tool and keep only what columns you need. You can also rename or change any data types at this time as well within the tool configuration.
💡 TIP – For the “*Unknown” field at the bottom of your list of columns – if checked, this will pull in any new fields. For example, you’ve input an Excel report that is sent from another team. Next month, when they send you the report, they’ve added three new columns to the report. Having “*Unknown” checked will pull all three new columns in automatically. If you were to uncheck “*Unknown”, the new columns would get dropped at this instance of the tool and you would not see them in the rest of your workflow. My suggestion is to not uncheck “*Unknown” until the very last Select tool in your workflow.
💡 TIP – Options -> Select -> Deselect All
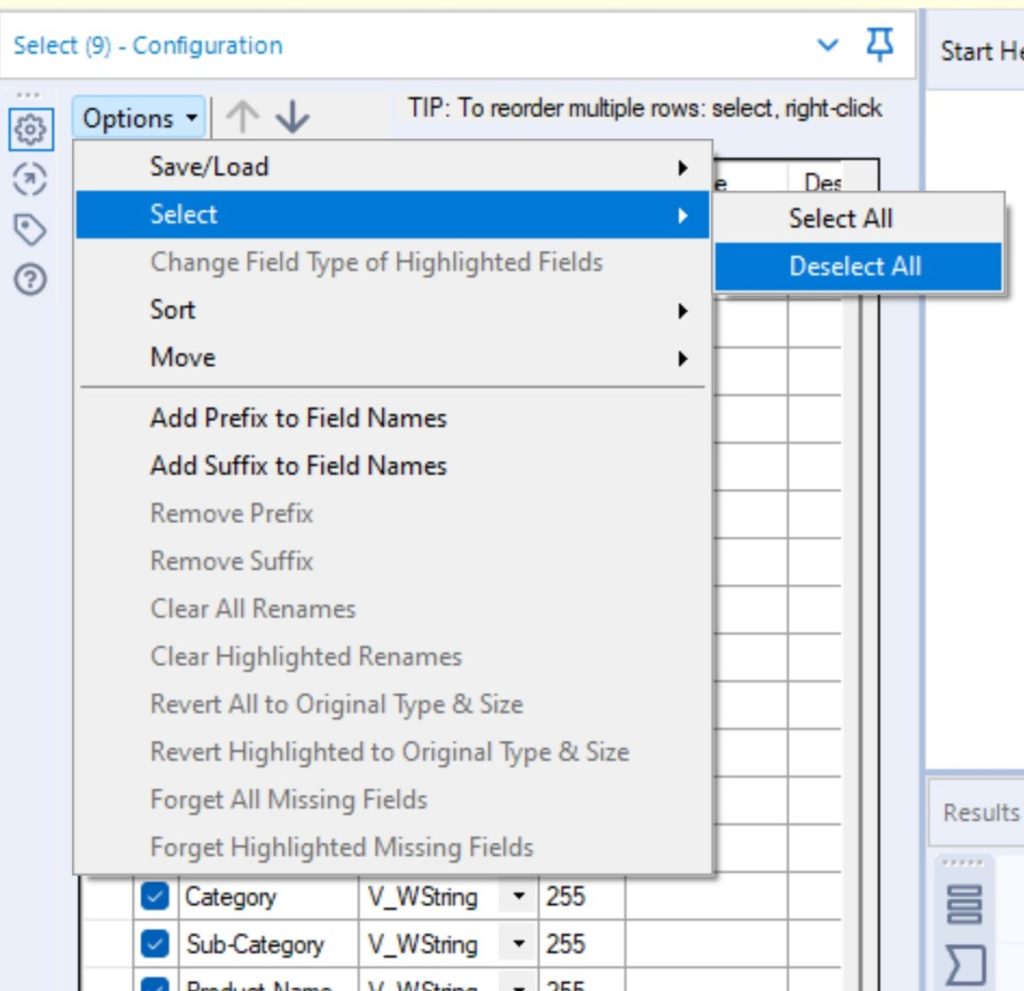
If I know I will only be keeping around a handful of columns, I deselect all of the columns first and then just select the handful that I need. You can also highlight a few field names (showing as rows in the tool) and deselect/select those fields all at once using the same Options -> Select menu.
💡 TIP – Options -> Sort -> Revert to Incoming Field Order – Say you’ve sorted your field names alphabetically because you were looking for a specific field. Well, most other developers, analysts, and potentially clients will be familiar with the table and fields in the order that they appear. To keep things consistent and familiar for everyone, I recommend sorting back to the original order using the Revert to Incoming Field Order option.
Filter
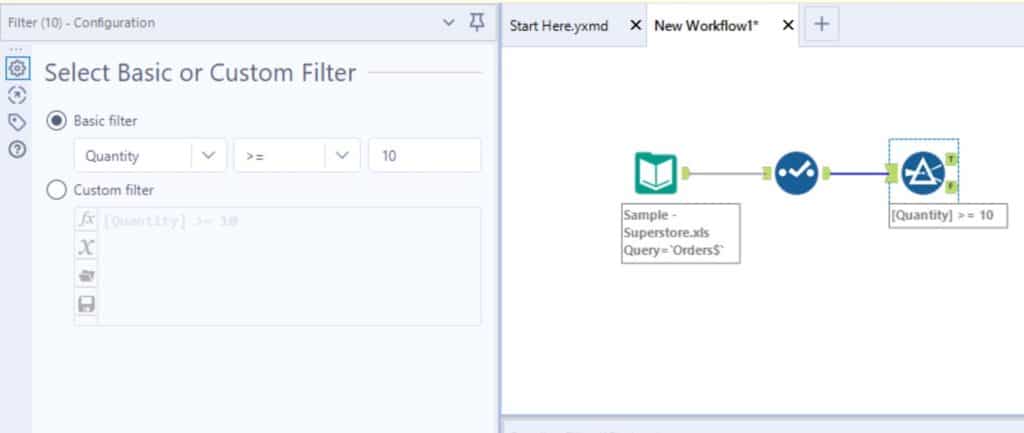
Use one or more “Filter” tools to filter the data down to just what you need. Filter opportunities could be a time period, specific product/category/region, etc.
Level of detail
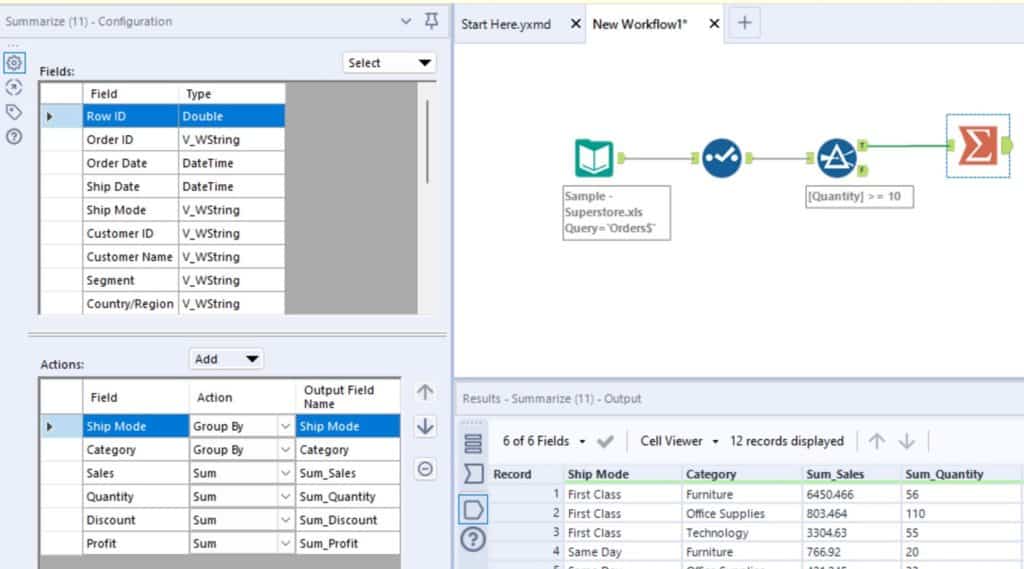
Aggregate data to a level of detail that is appropriate for each step in development. Consider the formulas/flags you will need to apply and the end goal, use a summarize to aggregate the data to a higher level of detail to reduce excess rows. You may not need to do this step yet, but it is good to start thinking about it at this point.
Explore Tips for Earning Your Alteryx Designer Core Certification
Example: You need a final dataset that details how many items were sold in each item category and their sale amount/quantity. You could group the dataset by item category and sum on quantity and sales. This would make it so you are only processing item categories instead of each individual item, reducing the number of rows, resulting in a faster run time.
Formulas
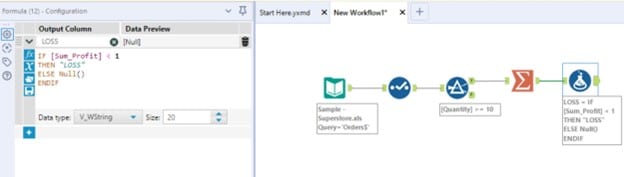
Alteryx provides a wide range of built-in formulas and tools. Within the Formula tool itself, Alteryx provides a menu of built-in formulas (like date time, string, math, etc.) using the fx button within the tool configuration pane. The Formula tool also allows you to either create a new field or column or update an existing one all within the same tool instance. Also, consider and explore the additional tools Alteryx provides, as they may streamline what you are trying to do with a formula (ex. Data cleansing tool, DateTime tool, etc.)
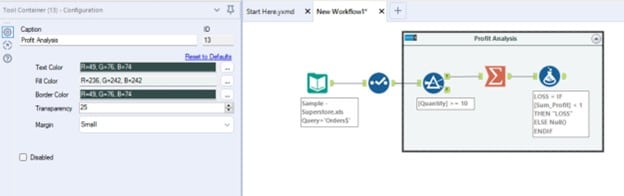
💡 TIP – Tool Containers – utilize Tool Containers to group tools together that complete one function, then label the tool container to explain what the section is for. You can apply a tool container by highlighting the tools in the section, right-click and select “Add to New Container.” Edit the container’s title/caption in the configuration window.
Essential Alteryx tip: QA as you go
Perform high-level checks
Take time to do quick checks after implementing a few changes. Alteryx provides a few ways you can do some high-level checks as you develop to make sure everything is moving as expected. If anything pops up during the quick checks, do a deeper dive now instead of waiting until the end, it will be less to untangle if you do it at each step.
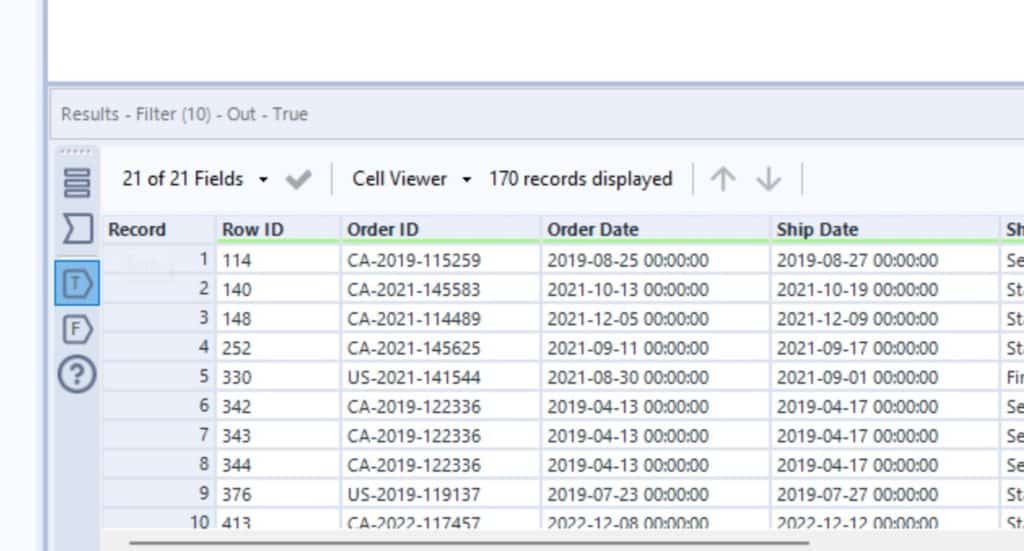
💡 TIP – Utilize the ability to view the data coming in and out of each tool using the buttons in the results window. Check that everything looks right and also remember to check counts to make sure you did not add or lose any data unexpectedly.
💡 TIP – Add in Summarize tools off of the workflow at various spots checking a KPI you expect to be consistent throughout the workflow
Final level of detail
Determine the final level of detail needed for the dataset and aggregate the data to that level, typically using the Summarize tool. The final level of detail will be based on the end goal of the project.
![]()
Example 1: The Tableau engineers say they need the ability to filter on “Item”, so we need to provide data at the “Item” level. I would not aggregate the data up to “Item Category” level and instead provide the additional rows that detail out each “Item” within an “Item Category”
Example 2: the Tableau engineers do not need to filter at the “Item” level and they have concerns about performance due to complex formulas or a large data set. In this example we should aggregate the data up to “Item Category” to reduce the number of rows.
Keep your workflow optimized
Final QA and cleanup
💡 TIP – If you have been doing QA checks as you develop, you should only need to do final spot checks to make sure everything’s adding up.
- Make sure only columns needed for the output are included and consider unselecting the “*Unknown” option.
- Make sure all column names are intuitive and in a format that is ingestible by the data’s next destination
- Check KPIs – do final checks on any KPIs
- Check counts – do a quick check on the number of rows. Example: make sure the counts for each item category match the input’s counts for item category
Output data
Choose the output type that fits the project (Tableau hyper, excel, write to database, etc.)
Ariana

Written By
Ariana Cukier

Peer Review
Nick Cassara
Manager, Data Engineering
Related Content
3 Tips for Data Quality Assurance (QA) in Alteryx
Anyone who works with data would probably say that ensuring accuracy is half the battle. While a final Quality Assurance…
An Introduction to Alteryx Generate Rows
The Generate Rows tool in Alteryx is a great tool to explore when you need to expand your dataset. When…
How to Run and Interpret the Tableau Workbook Optimizer

Imagine you’ve just spent days, weeks, or maybe months creating the perfect dashboard. It has an eye-catching design, cutting-edge UX,…