3 Tips for Data Quality Assurance (QA) in Alteryx

Anyone who works with data would probably say that ensuring accuracy is half the battle. While a final Quality Assurance (“QA”) check is always best practice, you can also implement QA checkpoints into your development process. QA checks allow you to catch more issues in the moment, giving you the opportunity to fix them as you go. I’ve gathered three of my favorite Alteryx QA techniques and how I incorporated them into the development of the dataset for our dashboard in collaboration with the NFL’s 2023 Diversity and Inclusion Report.
Check KPIs
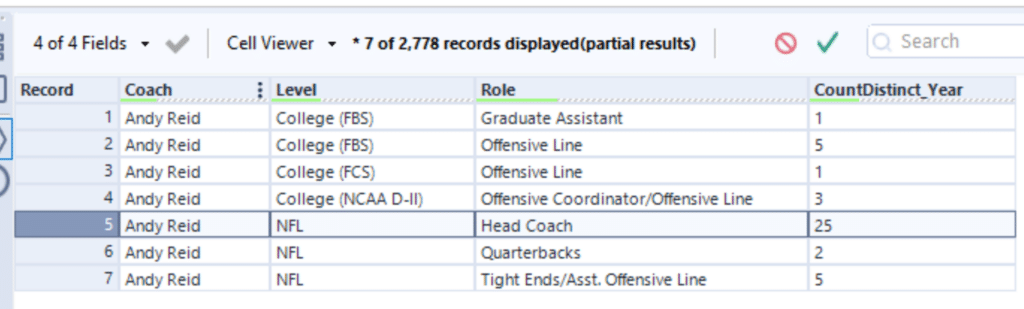
Each project has an overall user goal, and as a data engineer, I can begin to establish and check some of the key KPIs. These KPIs will become the foundation for QA and should reflect some of the main objectives of the project. For example, in our NFL Mobility & Opportunity Trends dashboard, one of the KPIs of interest was “How many total years as head coach did each coach have in the NFL?”
For this particular KPI, I chose to select a few coaches to keep an eye on, but for this exercise, we can focus on Andy Reid. Using either the source data and/or an external report, I was able to check that Andy Reid should show 25 years as a head coach.
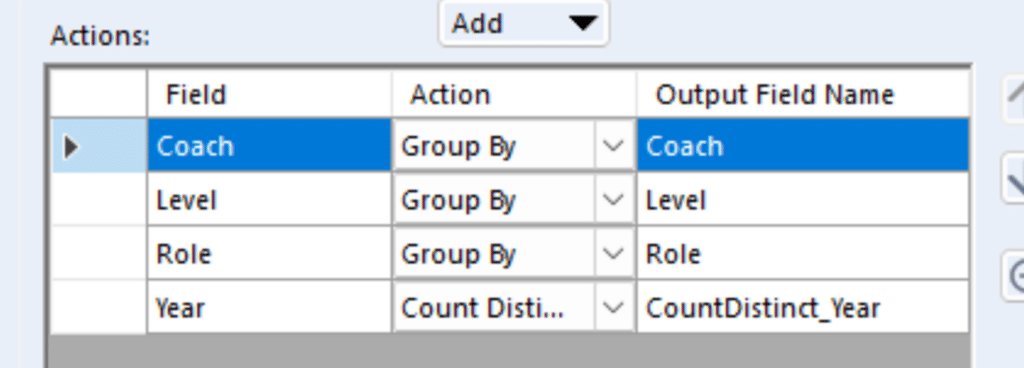
Moving into my Alteryx workflow, I will use a Summarize tool to track this number throughout the workflow. Let’s start by pulling a summarize tool onto the canvas connected off of your source file. Utilize the Group By option along with a form of measurement (Sum, Count Distinct, etc.) to calculate your KPI. I have my Summarize tool set up to Group By on Coach, Level (NFL, etc.), Role and a Count Distinct of Years.
Continue reading with a free account, or login.
Unlock this tutorial and hundreds of other free visual analytics resources from our expert team.
Already have an account? Sign In
By continuing, you agree to our Terms of Use and Privacy Policy.
My output displays how many years (CountDistinct_Year) each Coach had in each of their roles.
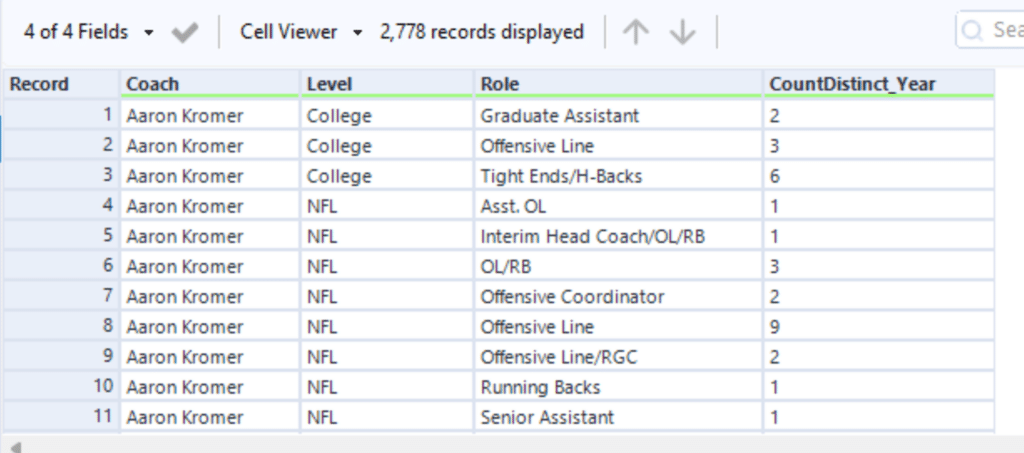
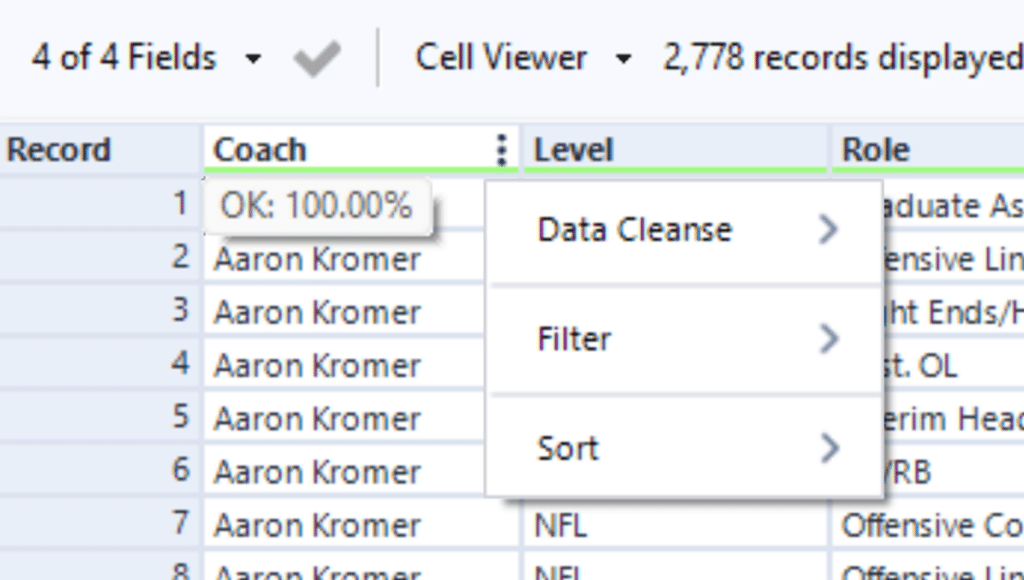
To find our coach of interest, Andy Reid, you can use the ellipses next to “Coach” in the results window to get the option to filter the results.
Tip: If your results are too large to fully display in the results window, add a browse tool after the Summarize to use this option
Once I have filtered to Andy Reid, I can verify that I have 25 years of NFL Head Coach experience in my source data.
Now that I have my Summarize tool set up and my KPIs established for my source data, I will copy and paste this Summarize tool throughout my workflow, especially at the end, to track that Andy Reid remains at 25 years throughout the workflow.
It’s common to have many small QA offshoots coming off of my workflow while I develop. To keep organized, I like to place them outside of my tool containers and go back through to delete them once the workflow is complete.
Tips for Earning Your Alteryx Designer Core Certification
Keep an eye on row counts
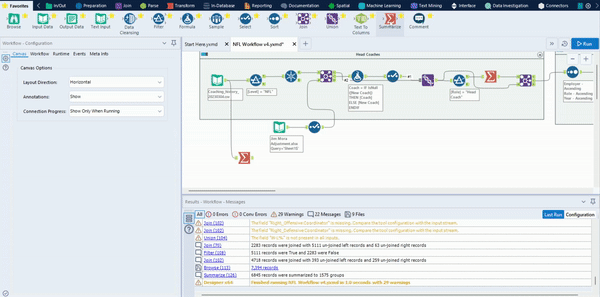
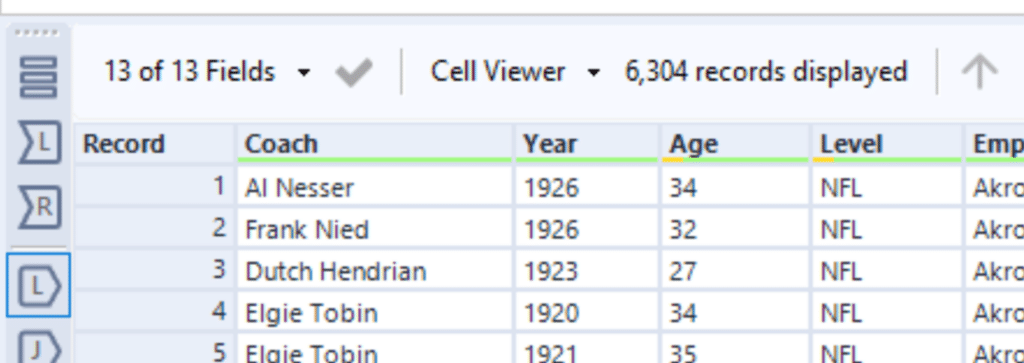
One of my favorite features of Alteryx is the ability to see row counts after each tool on the canvas. Row counts, or record counts, can be found in the results window (for example, the row count for the picture below is 6,866).
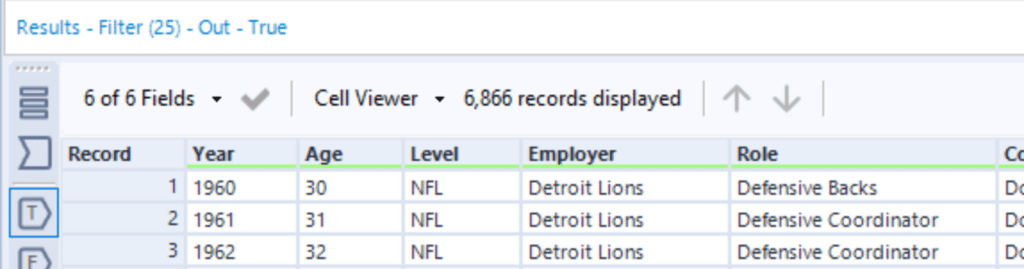
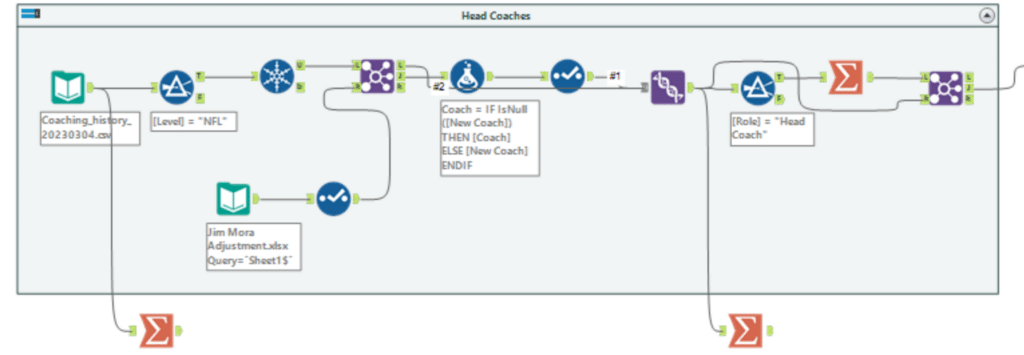
I’ve found row counts to be especially useful when checking the success of my Joins. Let’s look at the NFL process again. We have a section in the workflow that utilizes a file to replace outdated team names with the most current team name (ex. New York Titans is now the New York Jets) through a Join on team name.
Using the input stream, or left input, as my baseline, I have 7,394 records in my data. I can see this by clicking on the Join tool and making sure the “L” input button is selected in the results tab.
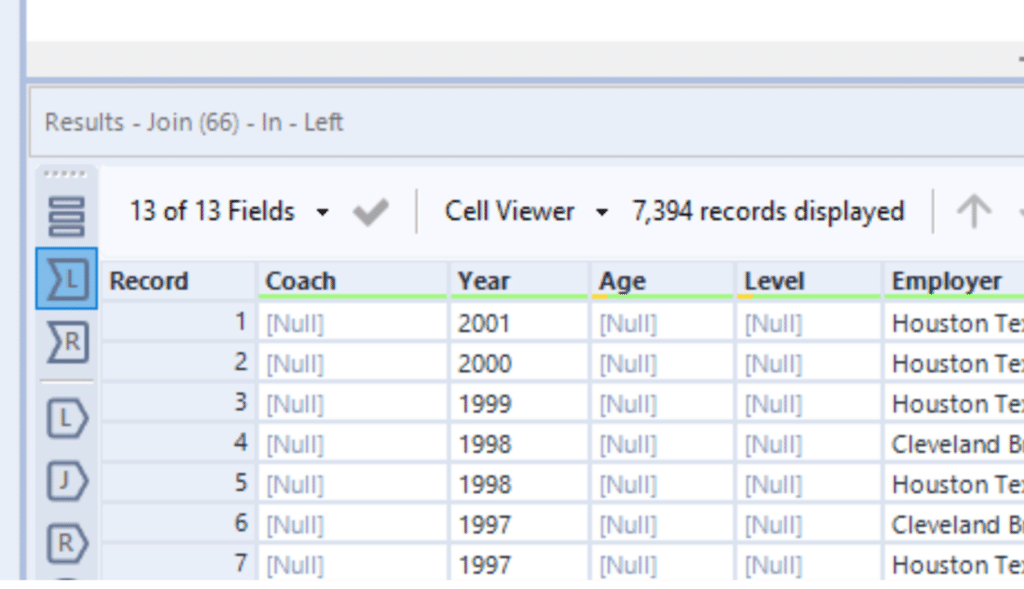
After joining in my outdated team names file on team name, I can check my output row counts by adding together the “L” and “J” output record counts. (This should produce the same results as a Union tool)
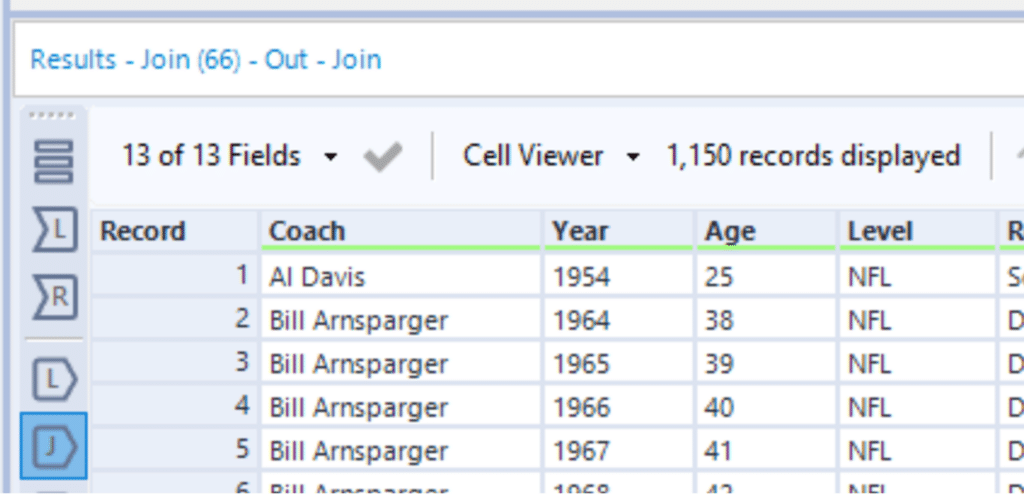
This totals to a record count of 6,304 + 1,150 = 7,454. I was looking for a record count of 7,394 so this is an additional 60 records than I was expecting. At this point, I will pause development to do an investigation of the duplicate records (the Unique tool helped on this one). I was able to find that there were some duplicate rows in the outdated team names file. Once those were removed, I ran the workflow again and was able to produce the 7,394 records that I was looking for.
Utilize the results window to check formulas
The results window is also a great place to check formulas as you write them. Because you can check your data as it comes into and out of a tool, you can see the impact that your formulas are having on the data after each one.
One of the more complicated use cases of the NFL workflow process was to assign the coach’s previous position to the row of their new position. After some data prep to sort and format the data, I opted to use a Multi-Row Formula tool to complete the use case. Because the Multi-Row Formula tool is on the more complex side, I wanted to be sure that the options and formula written were producing the correct response.
Let’s look at the results for Andy Reid (again utilizing the filter option in the results window).
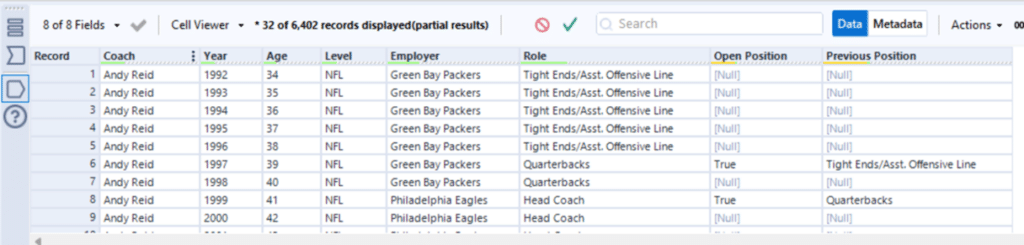
I used the view above to continually tweak my formula until I could verify that it met the use case, showing his progression from Tight Ends/Asst. Offensive Line to Quarterbacks and stops there as he has remained a Head Coach.
Bringing it all together
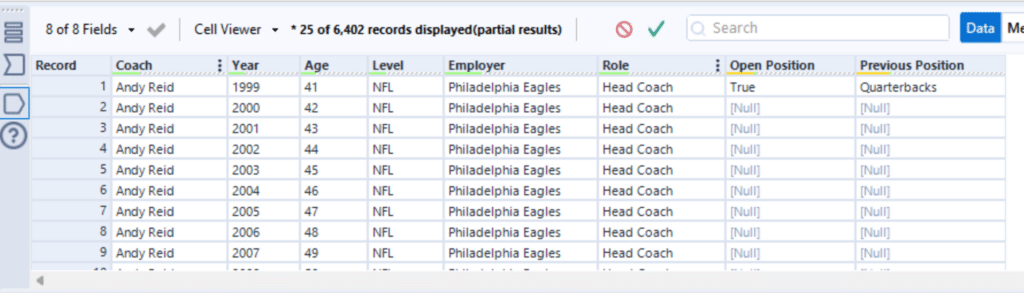
In just a few quick clicks, I’m able to use all of the tips above to verify my data using the results window. Using the example above, the results of my Multi-Row Formula, I filter to Andy Reid and Role to Head Coach. I can see in the results below, 25 rows, which aligns with the 25 years of head coaching experience that we identified at the beginning of this exercise.
By utilizing all of these small checks along the way, I was able to develop the workflow with confidence that the final QA would only produce small anomalies at most. I was able to sort out issues with formulas, duplications, and fall out as they arose instead of sorting through all of them at the end. While every developer has their own style, I have found that implementing the techniques we’ve covered today has improved both my accuracy and efficiency when it comes to workflow development and design. I hope these tips will help you out as well!
If you’re interested in tips about other areas of the development process, check out my blog on 9 Quick Alteryx Tips. I’ve included some of these QA tips in a high-level format on the list.
9 Quick Alteryx Tips to Optimize Your Data Workflows
Thanks for reading; you’ve got this!
Ariana

Written By
Ariana Cukier

Peer Review
Nick Cassara
Manager, Data Engineering
Related Content
9 Quick Alteryx Tips to Optimize Your Data Workflows
When beginning to develop an Alteryx workflow, sometimes I find myself asking, where should I start? What happens next? How…
An Introduction to Alteryx Generate Rows
The Generate Rows tool in Alteryx is a great tool to explore when you need to expand your dataset. When…
Tips for Earning Your Alteryx Designer Core Certification

Alteryx has become a tool that the Playfair data team uses on a daily basis, therefore we wanted to create…