3 Ways the Describe Feature Can Help You Use Tableau
The “describe” feature in Tableau is one that somehow took me years to stumble upon, but is now one of my favorites. If you’ve heard of this feature, you’ve most likely used it to describe an individual dimension, measure, set, or parameter. Right-clicking on a field and choosing “Describe…” gives you information such as the data type and which table it comes from, but there are several other ways to use the describe feature in Tableau to help you speed up your learning and analyses.
This post will show you (1) how to get the most out of the aforementioned usage, (2) a method for reverse engineering somebody else’s (or your own) Tableau workbooks, and (3) a way to view underlying formulas and parameter allowable values. These tips have several benefits including (1) saving processing time of your VizQL queries, (2) speeding up your learning or reminding you of your previous approaches, and (3) making your calculated field writing more efficient.
3 ways the describe feature can help you use Tableau
This post will use the Super Sample Superstore dashboard to show you three different applications of the describe feature in Tableau.
![]()
Continue reading with a free account, or login.
Unlock this tutorial and hundreds of other free visual analytics resources from our expert team.
Already have an account? Sign In
By continuing, you agree to our Terms of Use and Privacy Policy.
Using “Describe…” to save processing time
As mentioned in the introduction, if you’re familiar with this feature, you’ve likely right-clicked on an individual field and chose “Describe…” to learn more about the field’s properties. Here’s what is shown when doing this for the Segment dimension in the Sample – Superstore dataset.
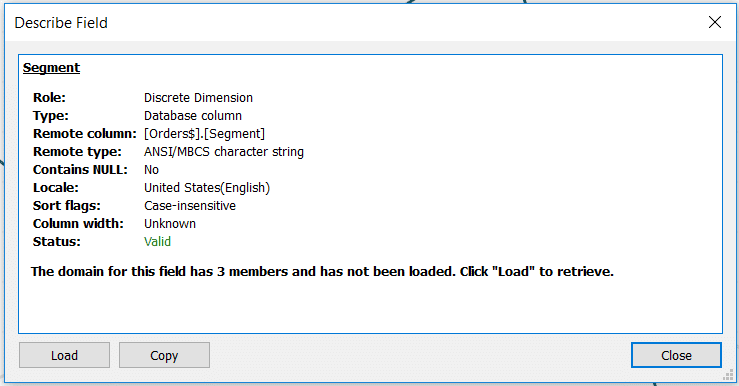
My favorite part of the description when used with a dimension is that if you click the “Load” button pictured in the bottom left corner of the window, Tableau will provide a preview of the first 20 dimension members. Before I knew about this feature, I would drag and drop the field onto the view to get an idea of what dimension members were in the field.
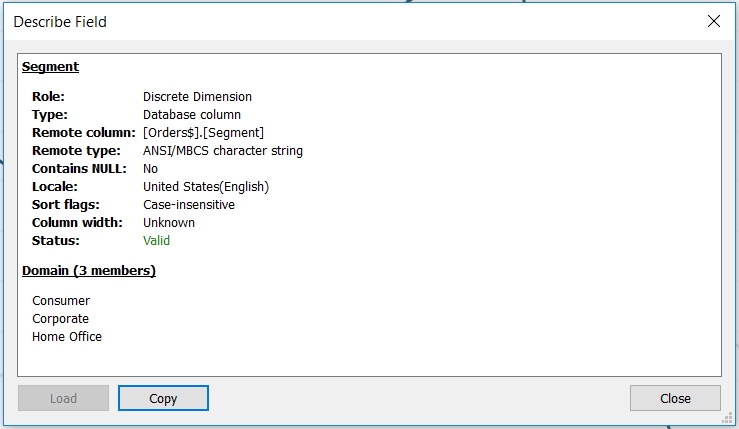
Unfortunately, this meant that Tableau had to query the data source to visualize the answer, which could take quite some time depending on the size of my dataset. The describe feature is much more efficient and gives me an idea of what dimension members are in the field without requiring me to create a new view / wait for processing. Here’s how the Describe Field information looks when loading the dimension members for the Segment dimension.
A method of reverse-engineering
Sometimes I feel like the younger me is smarter than the current me. I don’t know whether to laugh or cry when I do a Google search, only to answer my own question with an old blog post I wrote. Other times, I’ll go back to old workbooks to remind myself how I executed a certain tactic. I’m also a big proponent of Tableau Public and am always encouraging people to download dashboards they like to “look under the hood” and see how they were created.
Whether you are reverse-engineering your own or somebody else’s work, this next tip will help. Even if you’ve heard of describing fields, you may not know that you can describe entire sheets. Here’s how a sheet description looks, which can be accessed by clicking “Worksheet” in the top navigation, and choosing “Describe Sheet…”.
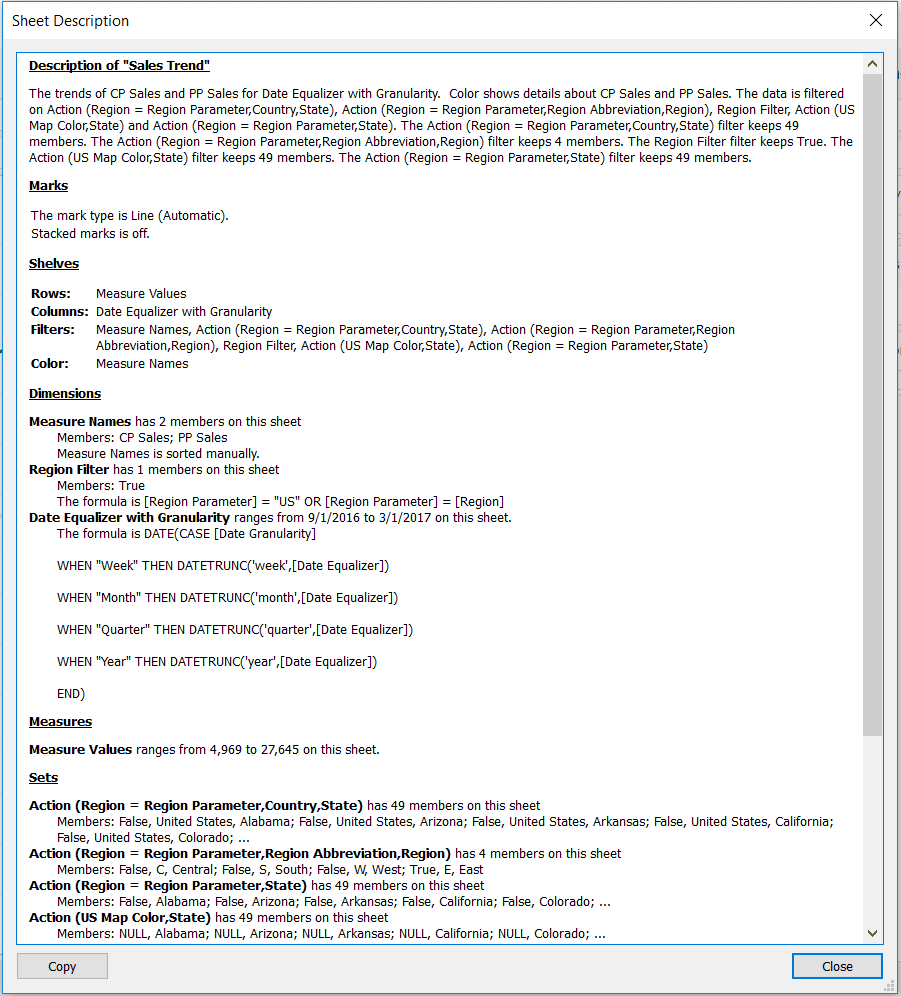
This provides so much information that I actually ran out of room in the screenshot. In addition to the information pictured, you can also see all of the worksheet’s parameters as well as their current values, and even information about the data source being used to generate the worksheet.
Most of this information can be seen by looking at the location of pills on the Rows Shelf, Columns Shelf, Filters Shelf, and Marks Cards – but not all of it. For example, you are now able to see whether or not the marks are stacked and, in this example, view the underlying calculation for the “Date Equalizer with Granularity” field.
Not only does ‘Describe Sheet’ provide a concise total picture of what’s happening in the worksheet, but you can use the Copy button pictured in the bottom-left corner of the previous image to copy and paste the text into a notepad or Word document. You can then use the code to recreate formulas you may not otherwise be familiar with as calculated fields.
![]()
Calculated field writing
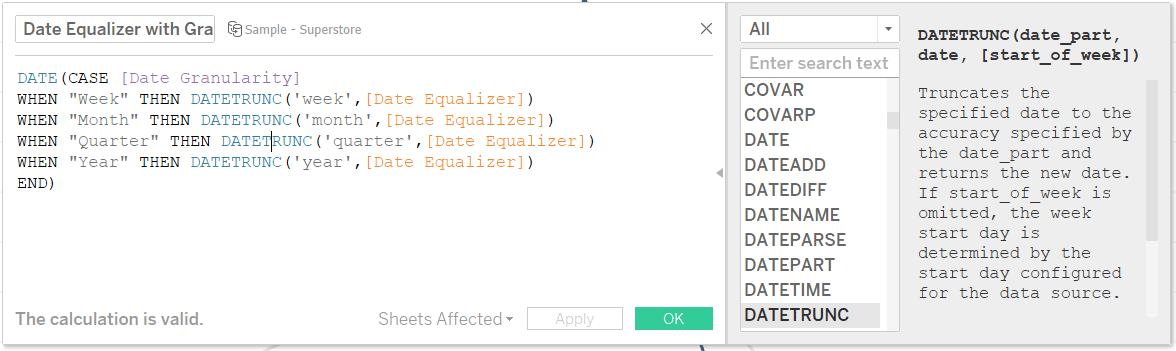
Speaking of writing calculated fields, the describe feature also has ‘an app(lication) for that’ – see what I did there? Let’s say that instead of getting the formula for the “Date Equalizer with Granularity” calculated field, or just to take a closer look, we right-clicked on the field and chose “Edit…”. This would open a calculated field dialog box that looks like this:
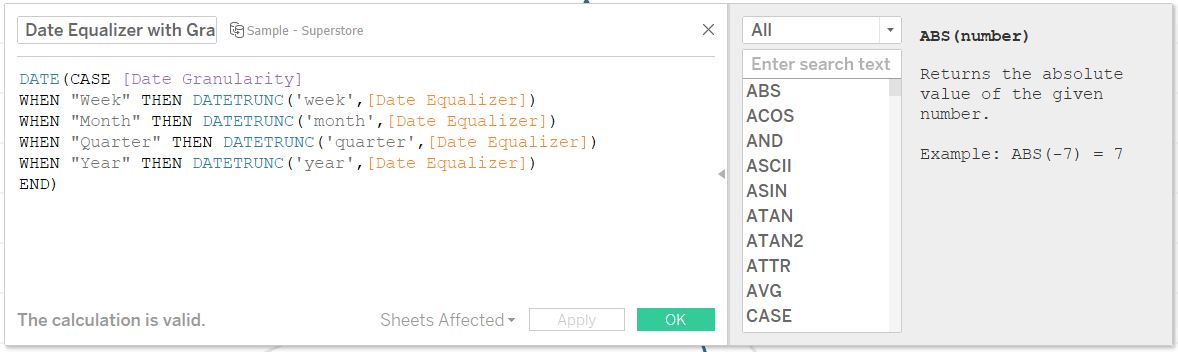
Clicking on anything colored blue, purple, or orange will give you additional information in the ‘fly-out’ box on the right-side. Here’s what happens when I click “DATETRUNC”:
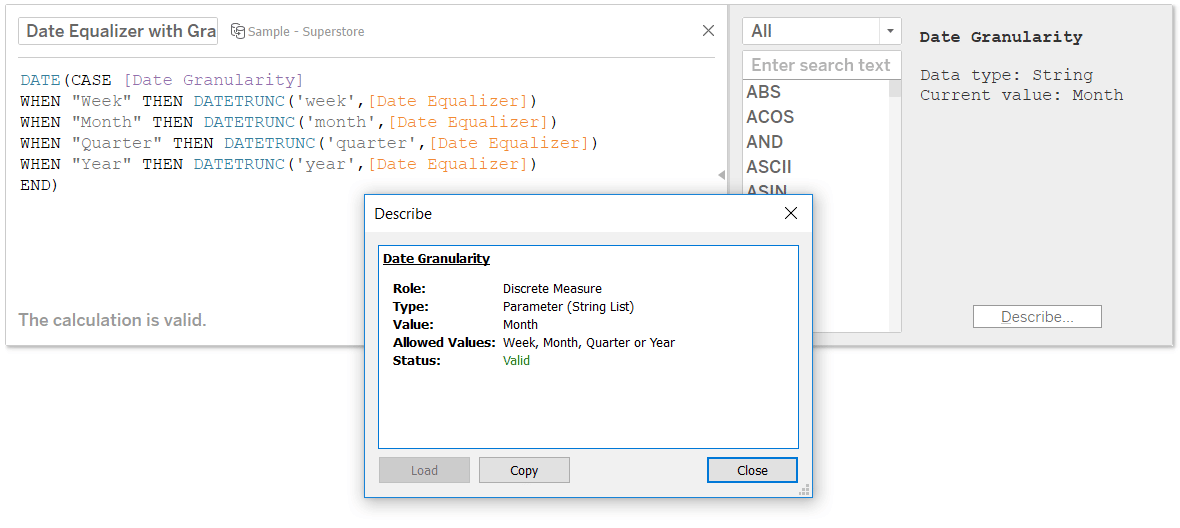
When clicking anything that’s purple (parameters) or anything that’s orange (fields), you will see the option to describe them. For parameters, I like to use this describe button to see all of the allowable values, which in this case, helped me write the CASE logic.
For calculated fields, I like to use the describe button to copy and paste underlying code. While you can view the underlying code on the right by just clicking on an orange calculated field, using the describe button opens more information including text which can be copied.
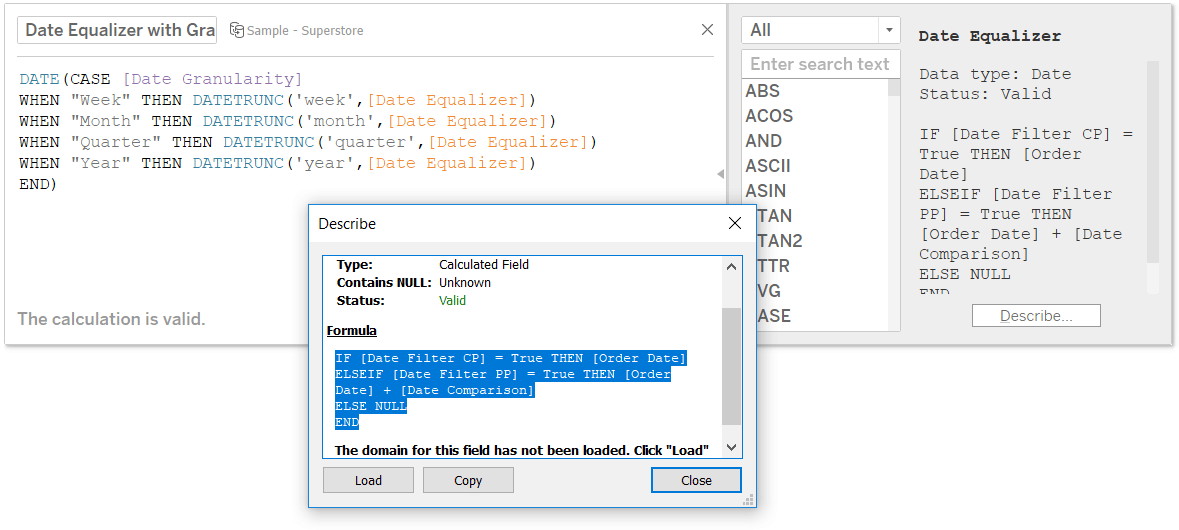
In both of these cases, I’m able to write new calculated fields much faster because I don’t need to close the calculated field window I am working in to re-open a parameter to see its allowable values or re-open a different calculated field to take advantage of code that was already created!
Thanks for reading,
– Ryan


Written By
Ryan Sleeper
Related Content

Ryan Sleeper
More than just learning about individual fields Tableau’s ‘Describe’ feature helps you learn more about individual fields, worksheets, and calculated…
An Introduction to Calculated Fields in Tableau
Possibly the most powerful feature of Tableau is its ability to allow authors to create new data from existing data…
Ryan Sleeper
Automatically Switch Between Days / Weeks / Months At times, the number of marks on a view should dictate which…