An Introduction to String Calculations in Tableau
When you think of calculated fields in Tableau, you likely think of calculating numbers first, but Tableau’s 26 different string functions (calculations) provide almost infinite applications for computing text as well. Perhaps the reason we don’t always think to create calculated fields with text in Tableau is because SQL is typically a better option for doing such manipulations. After all, I always say, “just because you can do something in Tableau does not mean that you should.”
That being said, there are some very good reasons to create string calculations in Tableau. Tableau acts as an excellent proof of concepting tool where you can test out your approaches on the fly before making them a more permanent part of your ETL process. If you would like to learn how Tableau and SQL can work well together, I encourage you to check out the new series from my friend, Ken Flerage. In the meantime, this post will give you an introduction to string calculations in Tableau and show you how to test segmentations before writing them in SQL.
This is the first in a five-part series on getting the most out of text in Tableau. For future updates, subscribe to our mailing list.

Using string calculations to create a custom segmentation in Tableau
Let’s say that we want to create a custom segmentation with the dimension members in our Sub-Category dimension (from the Sample – Superstore dataset). I’m just making up a quick, fake example for illustration, but let’s say that we would like to make all the sub-categories that start with an ‘A’ one segment; all sub-categories that start with ‘B’ or ‘C’ as a second sub-category; and everything else as the final segment.
Create a free account, or login.
Unlock this tutorial and hundreds of other free visual analytics resources from our expert team.
Already have an account? Sign In
We could group the sub-categories, but groups are static. This means that if we updated our dataset down the road and a new dimension member was introduced, it would not automatically be classified. In contrast, string calculations are dynamic, so we can set them up once and rest assured they will dynamically classify segments as new data is added. For this use case, the calculation is:
IF STARTSWITH([Sub-Category], ‘A’) THEN ‘A Sub-Categories’
ELSEIF STARTSWITH([Sub-Category],‘B’) OR STARTSWITH([Sub-Category],‘C’) THEN ‘B & C
Subcategories’
ELSE ‘Other’
END

Note that you can use either single tick marks (‘) or double-quotation marks (“) within string calculations. Also, the STARTSWITH function that we’re using in this example is not case sensitive.
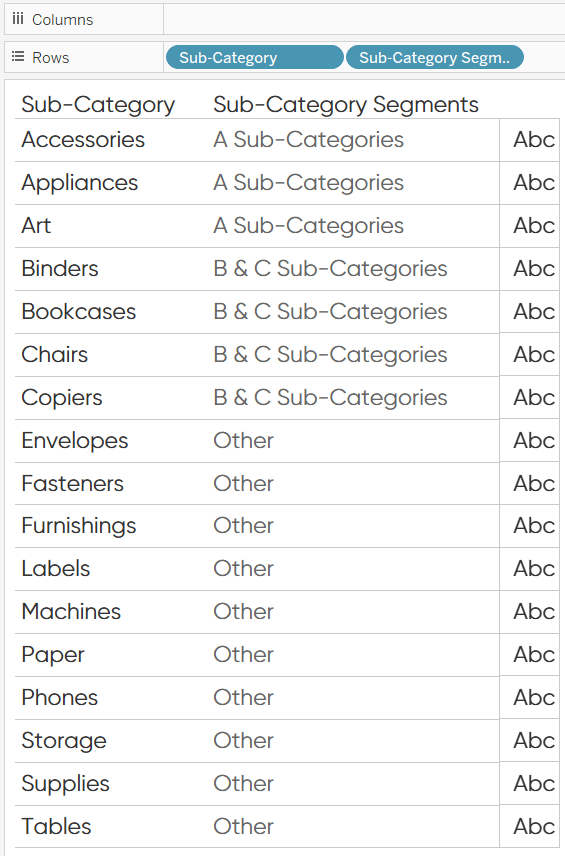
Just like I quality check my Tableau calculated fields that are made with numbers, I also quality check my calculated fields made with strings. To do so for this use case, I will put the original Sub-Category dimension on the Rows Shelf first, followed by our newly created Sub-Category Segments dimension second.

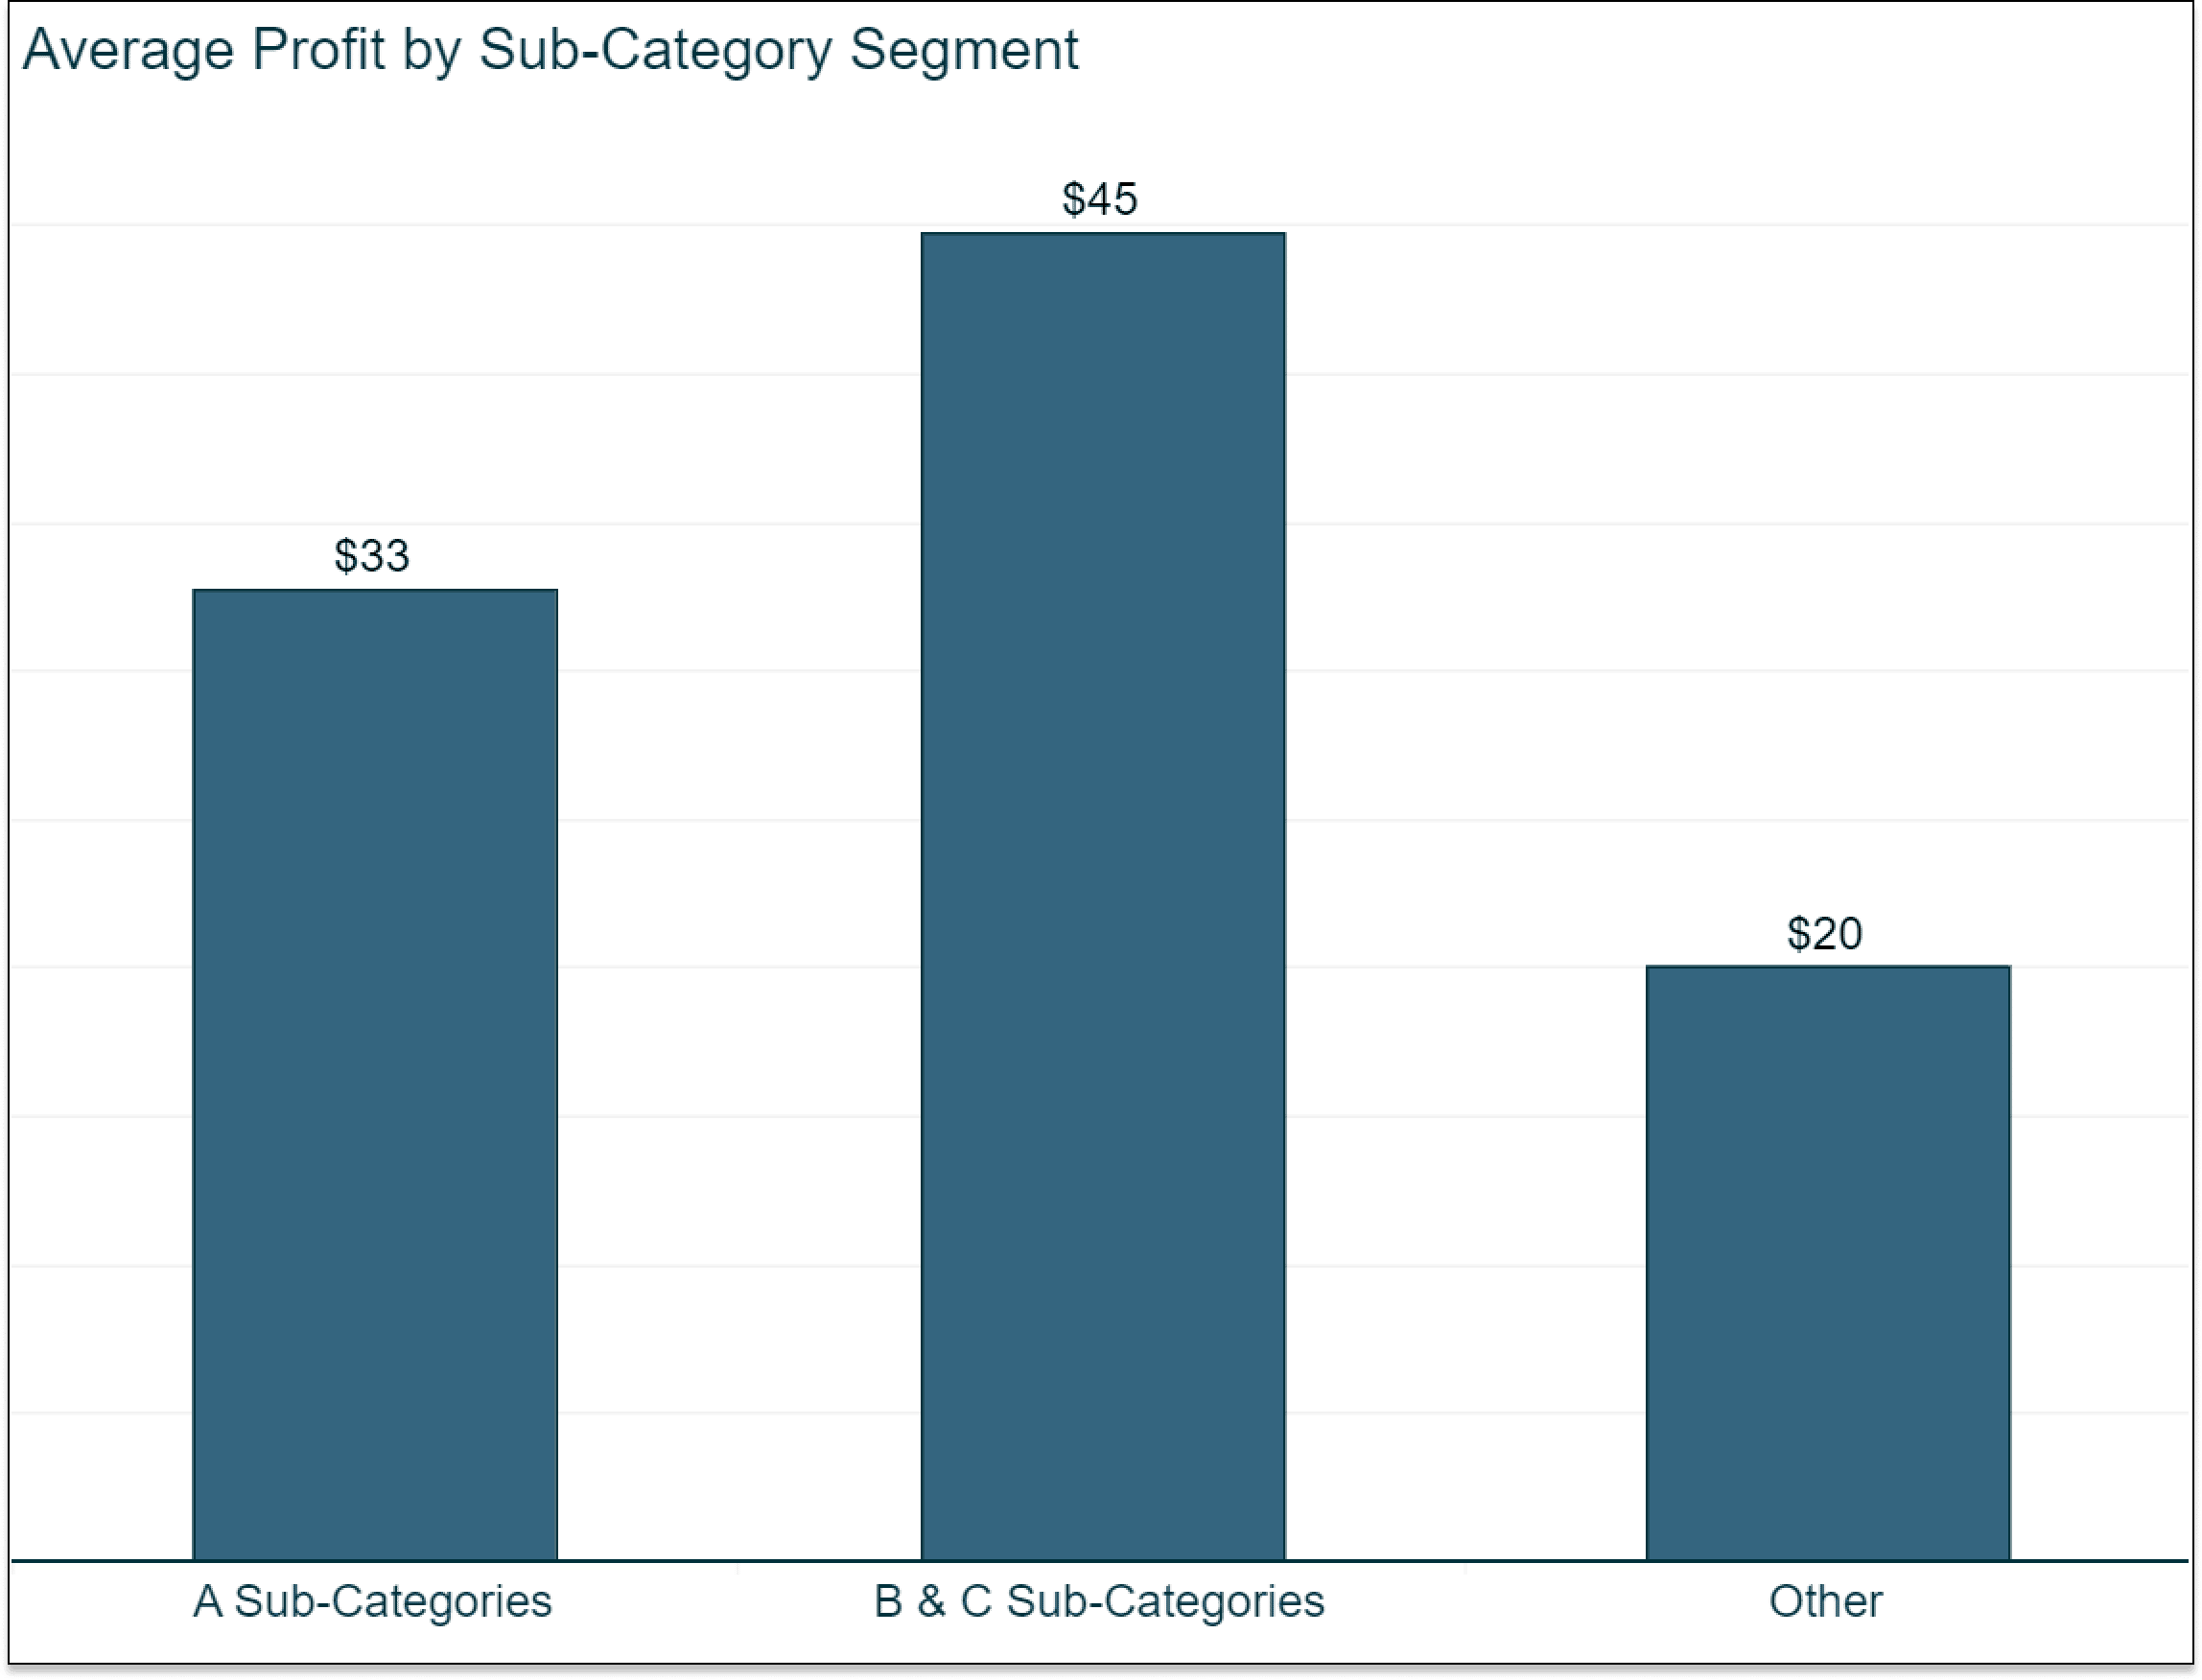
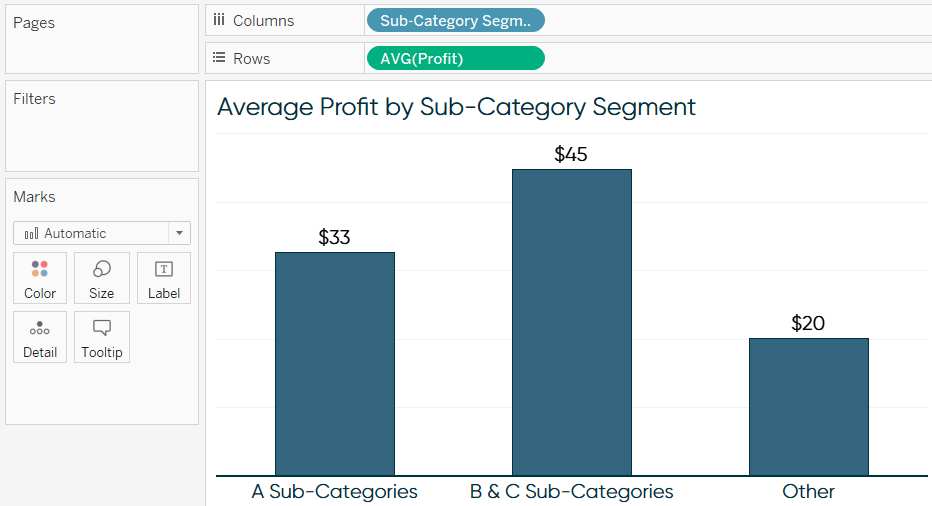
With the dimensions in this order on the Rows Shelf, the first column displays the original dimension member names and the second column displays the calculated segments. Sure enough, if the sub-category starts with an A, it’s classified as an A Sub-Category; if it starts with a B or a C, it’s classified as a B & C Sub-Category; and everything else is called “Other”. Now that I know it’s working, I can use the calculated dimension on its own to slice and dice measures just like I would with any other dimension. Here’s a bar chart showing average profit values by Sub-Category Segments.

If I’m the manger of the B & C sub-categories, this is possibly a bonus-generating insight that I may have missed if I was not able to segment the Sub-Category dimension members in this way!
This calculation was quick and easy to do in Tableau, but I recommend when you want to make dimension calculations like these a permanent part of your analyses, that you move the calculation outside of Tableau. In other words, once you know this segmentation will be used frequently for your analyses, create the dataset with this new column for Sub-Category Segments before you start using it in the software.
The reason I recommend this is that the string data type is the slowest for Tableau to process when it is added to a view. While Tableau is a great proof of concepting tool for situations like these, there are better tools for the job when it comes to preprocessing that will help you avoid repetitive (and slow) queries.
Again, this is just one of infinite applications of string calculations in Tableau, but I wanted to give you an introduction so you can get the most of the series to follow. To see the full list of string functions available in Tableau, expand the function dictionary while creating a calculated field and change the dropdown menu to “String”.

For more information and examples on what each of these does, it will help to keep this Tableau Knowledge Base entry handy.
In the next post, we will concatenate calculated dimensions and other text to create automated insights in Tableau!
Thanks for reading,
– Ryan
Related Content
An Introduction to Calculated Fields in Tableau
Possibly the most powerful feature of Tableau is its ability to allow authors to create new data from existing data…
Ryan Sleeper
Control any parameter actions scenario with a second data source One drawback to parameter actions is the value you want…
Ryan Sleeper
3 ways to take command of Tableau number formatting Learn how to (1) easily format positive and negative changes with…

