How to Automatically Compare Date Periods in Tableau

In this post you will learn how to parameterize the ‘date part’ in calculated fields and dynamically compare date periods in Tableau. Being able to dynamically isolate these comparisons can be an extremely useful tactic, especially when it comes to reporting automation. What I mean by dynamic is these date ranges are going to be based on today’s date and update upon load of your workbook.
At the end of the tutorial I am also going to show you how to parameterize the ‘date part’ in these calculated fields. Implementing this on your dashboards will not only dynamically update the comparisons with today’s date, but will also allow the user to select which type of comparison they want to see. This could be day over day, week over week, month over month, year over year, etc.
How to Isolate Comparison Date Ranges in Tableau
Creating the current month and comparison month calculated fields
By the end of this post, you will be able to automatically create comparison date ranges and select whether the ranges compare the most recent day over day, week over week, or month over month.
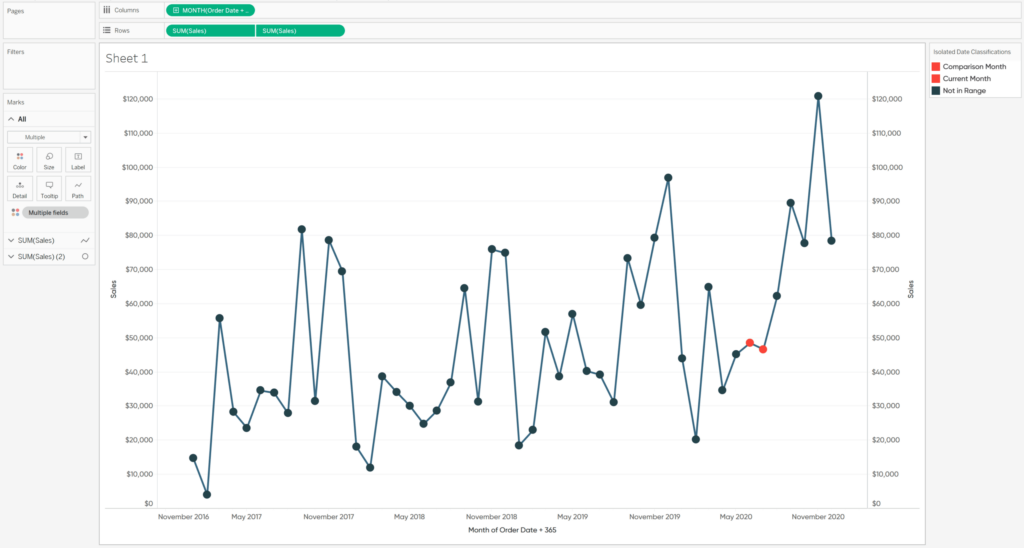
Note the Sample Superstore dataset that comes with Tableau currently has data through the year 2019. If you are following along using the sample dataset, you will need to create a calculated field out of the Order Date dimension and add 365 days to it. The entire formula is [Order Date] + 365.
![]()
Let’s start by creating the first calculated field which we will start building on as we move toward the parameterizing feature. I labeled this field “Current Month” and the calculation is:
IF DATETRUNC(‘month’,[Order Date]) = DATETRUNC(‘month’,TODAY())
THEN ‘Current Month’
END
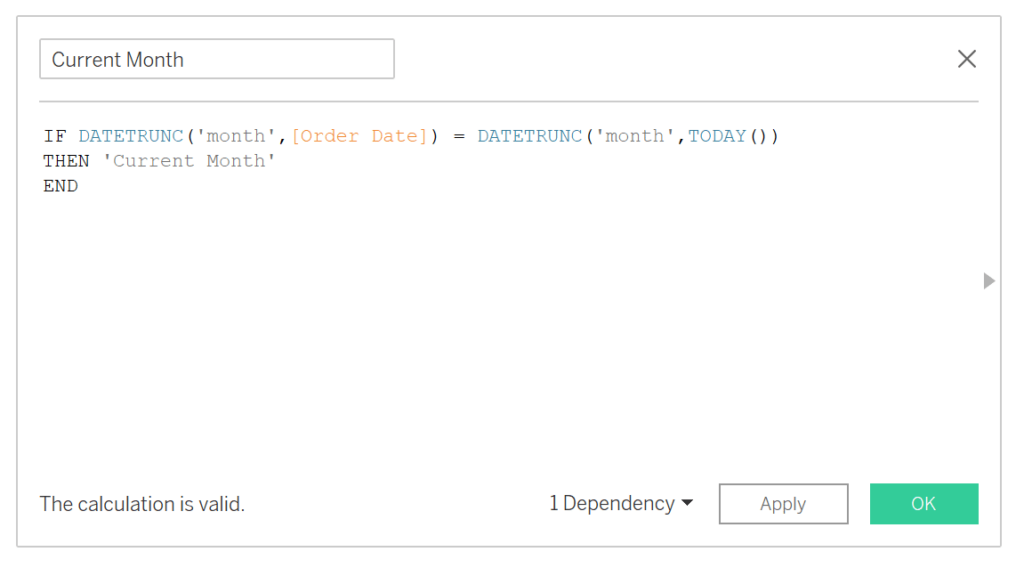
If you are unfamiliar with the DATETRUNC function, this calculation is saying if the month in our Order Date field equals the month we are currently in today, then label that month ‘Current Month’ and all others will have a NULL value. If you were to view your underlying data now you will see all records that fall in this month will now have that ‘Current Month’ as a value in this new dimension.
Continue reading with a free account, or login.
Unlock this tutorial and hundreds of other free visual analytics resources from our expert team.
Already have an account? Sign In
By continuing, you agree to our Terms of Use and Privacy Policy.
This gives us the current month but we still need our comparison month isolated. This next calculation is going to be very similar to the first but is going to introduce another function called DATEADD. I’ll start by duplicating the “Current Month” field we just created, then right-click on the copy, select Edit, and I’ll rename this field “Comparison Month”.
Now, in our calculated field we are going to insert that DATEADD function in front of our second DATETRUNC with an open parenthesis. Then we will add ‘month’ for our date part, -1 for our interval, and then a comma after that. Don’t forget to add a close parenthesis at the end to close the DATEADD function and change ‘Current Month’ to ‘Comparison Month’. Click OK and you should have the following calculated field:
IF DATETRUNC(‘month’,[Order Date]) = DATEADD(‘month’,-1,DATETRUNC(‘month’,TODAY()))
THEN ‘Comparison Month’
END
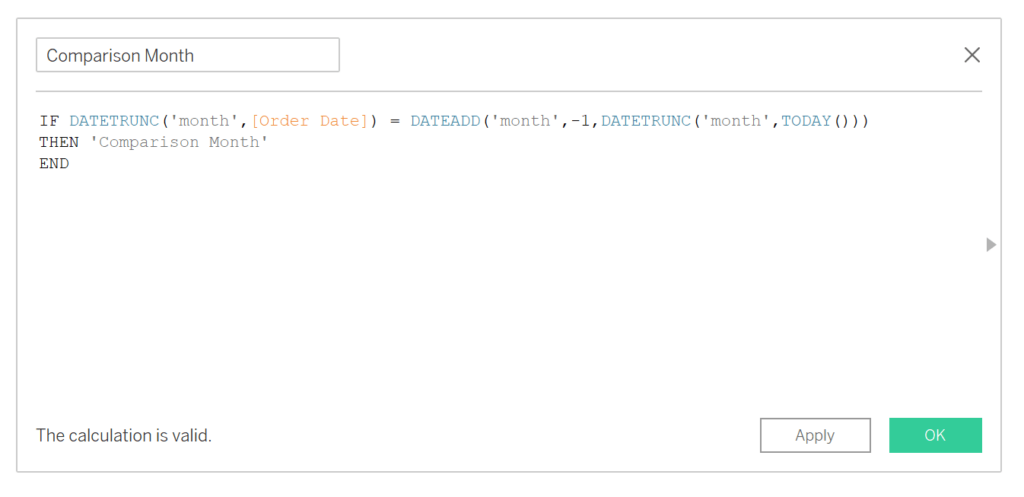
What is happening here is we are getting our current month from our DATETRUNC function, then we are essentially subtracting 1 month from the date returned. So, if TODAY() is 7/10/2020 the DATETRUNC will return 7/1/2020 and the DATEADD will subtract 1 month from that and the final value returned will be 6/1/2020.
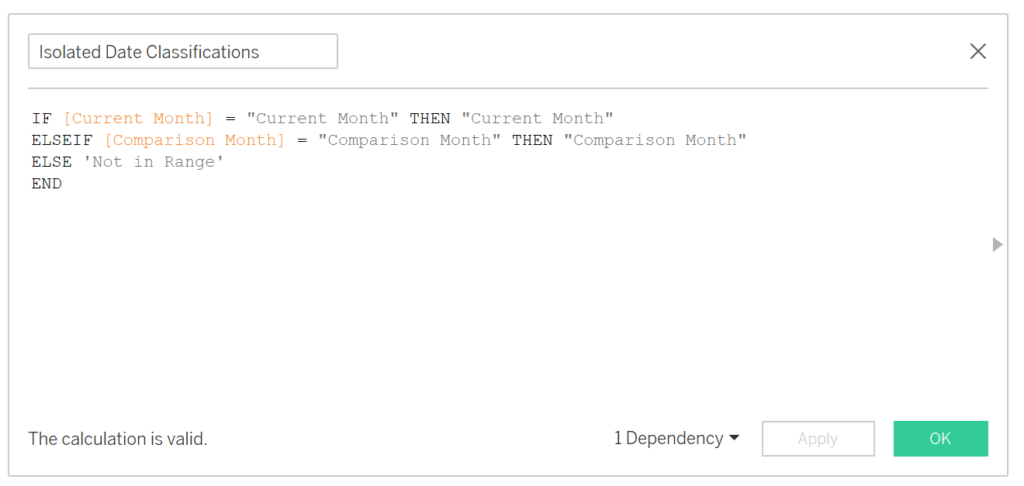
Now it’s time to combine these together so we can see them in the same view. I’m going to create another calculated field called “Isolated Date Classifications” and enter the following:
IF [Current Month] = “Current Month” THEN “Current Month”
ELSEIF [Comparison Month] = “Comparison Month” THEN “Comparison Month”
ELSE ‘Not in Range’
END
If you prefer, you can consolidate the three calculated fields created to this point into one, but there are at least two advantages to keeping all of the calculations separate:
- It’s easier to troubleshoot the smaller, individual calculated fields in the case something breaks
- You may want to use the individual calculated fields for another purpose, which you wouldn’t be able to do if they are all nested together
If you want to isolate current and comparison months with a single calculated field, the formula would be:
IF DATETRUNC(‘month’,[Order Date]) = DATETRUNC(‘month’,TODAY()) THEN ‘Current Month’
ELSEIF DATETRUNC(‘month’,[Order Date]) = DATEADD(‘month’,-1,DATETRUNC(‘month’,TODAY())) THEN ‘Comparison Month’
ELSE ‘Not in Range’
END
Regardless of which option you choose, it’s always a good idea to pause and check your fields to make sure everything is working properly. For quality assurance, I created a dual-axis line graph with Sales from our Sample Superstore dataset and added “Isolated Date Classifications” to the Color Marks Card. This tutorial is being written in the month of July 2020 and you can see July 2020 and June 2020 highlighted there so everything is working how we wanted it to.
How to parameterize the isolated date part
Now let’s look at how to parameterize the date part in the calculations we just created. We will start by creating a new parameter called “Date Part”, change the data type to String, allowable values to List, and add month, week, and day into the list of values. Of course, you can add additional values if they are relevant for your business such as quarter and/or year.
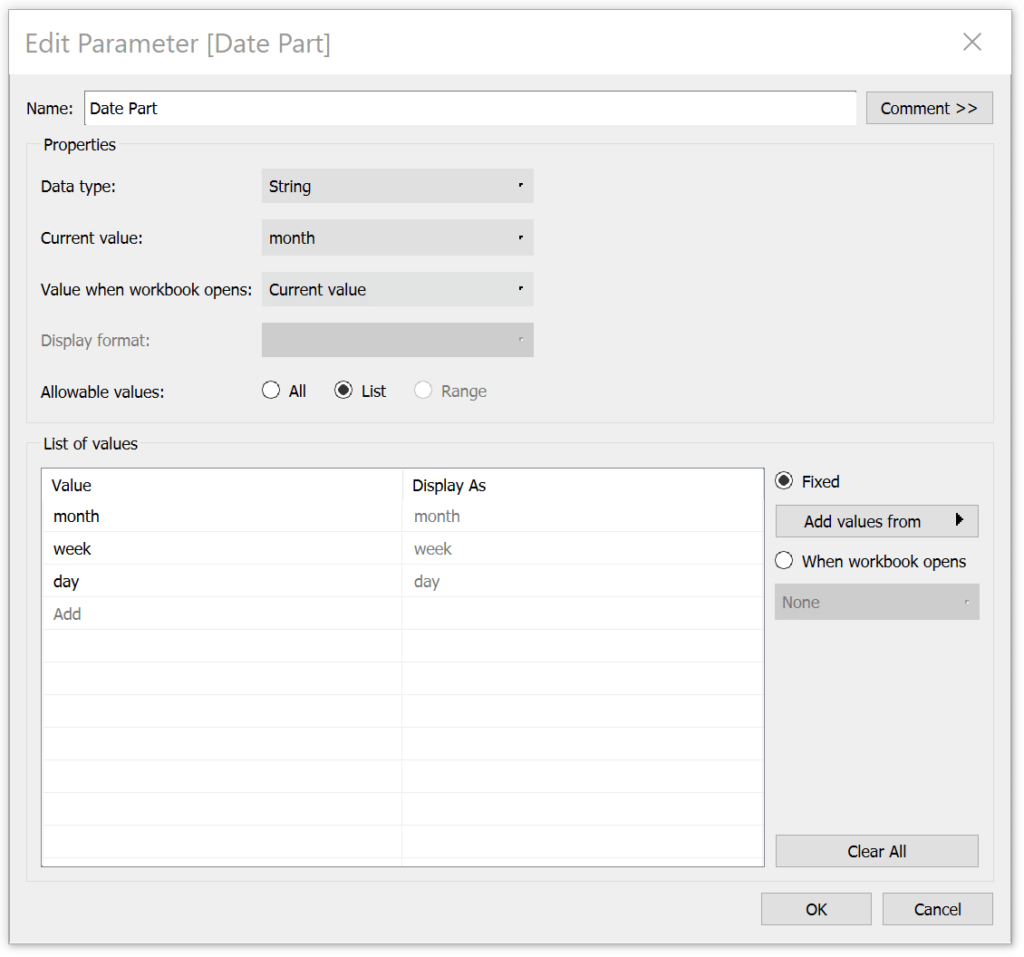
Notice that I left those values lowercase which is very important because the DATETRUNC function only works with lowercase values. However; you can change the Display As section to whatever you want.
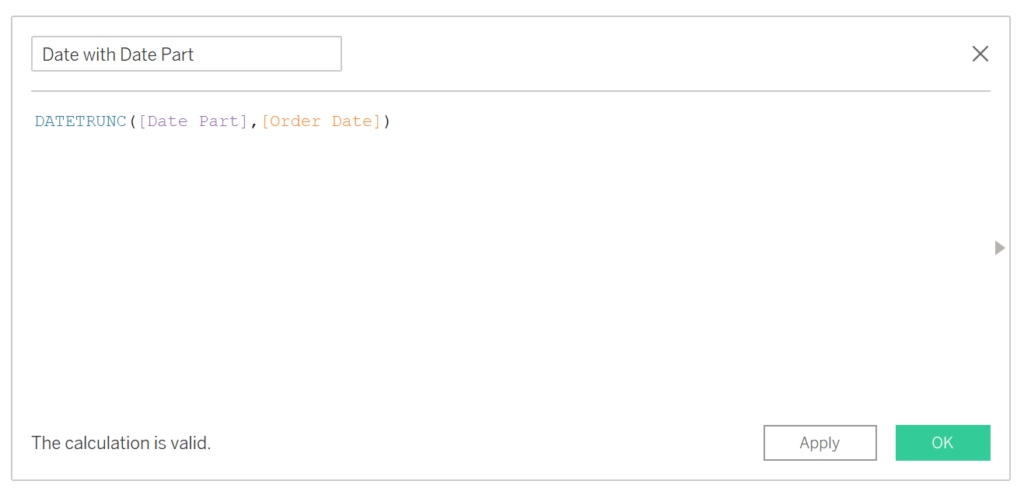
Next, we will create another calculated field by right-clicking on our Order Date field, hovering over “Create”, and selecting Calculated Field. I labeled this field “Date with Date Part” and the calculation is going to be:
DATETRUNC([Date Part],[Order Date])
How to Use Parameter Actions to Change Date Parts in Tableau
To test this, I am going to right-click and drag that newly created Date with Date Part calculated field and replace the Order Date field on my dual-axis line graph. When the options of different date parts appear, I am going to choose the first option, “Date with Date Part (Continuous)”. This is because the date part is going to be parameterized; I don’t want to get it stuck on a specific range by selecting a specific date part from those options.
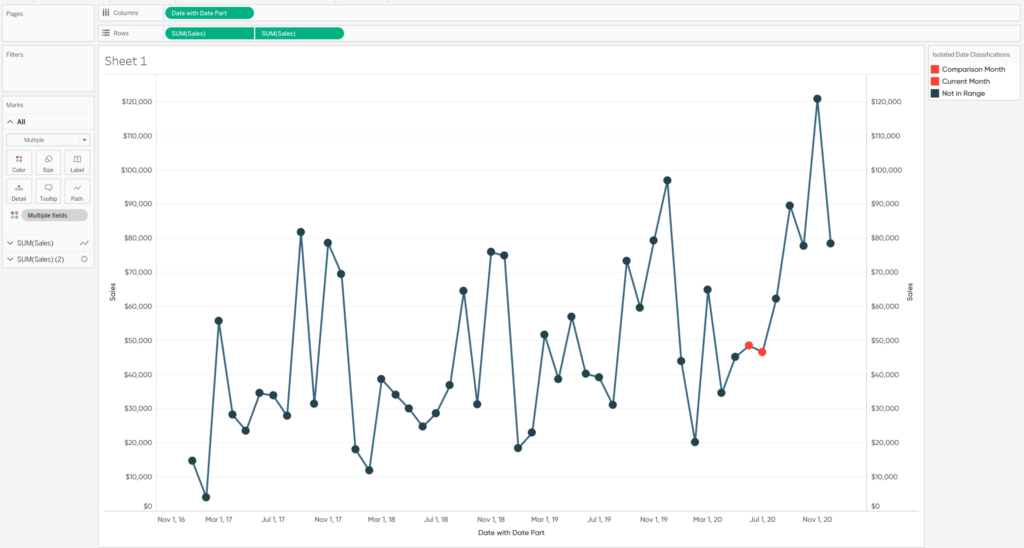
Looks like nothing changed so everything is working correctly. The Date Part parameter is passing in ‘month’ as the value so we still see this month and last month highlighted.
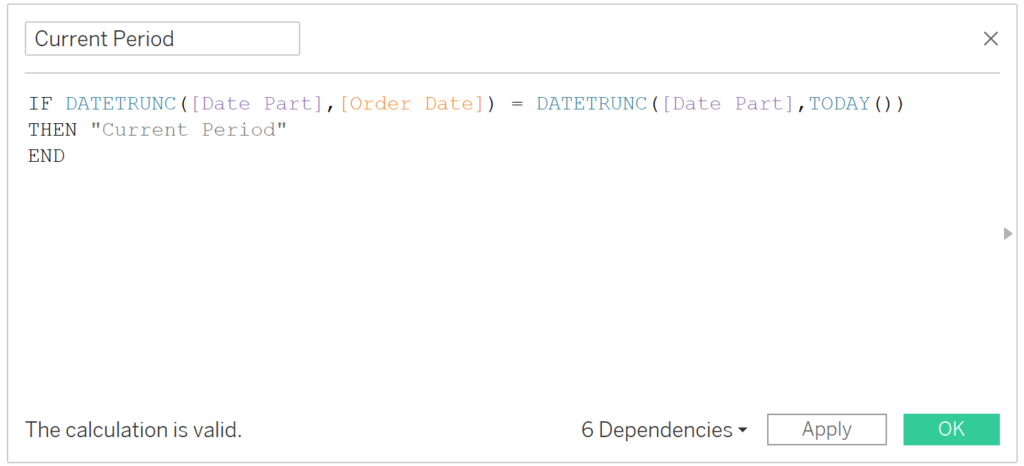
We have a couple other places we need to update to get the parameter controls to work. Recall that in our Current Month and Comparison Month calculated fields we entered ‘month’ as the date part value. We need to go back and edit those fields to now have our Date Part parameter in those values of the functions. We’re also no longer only looking at “Current Month”, so I will change the result to “Current Period”. To make these changes, I will edit those calculated fields to this:
IF DATETRUNC([Date Part],[Order Date]) = DATETRUNC([Date Part],TODAY())
THEN ‘Current Period’
END
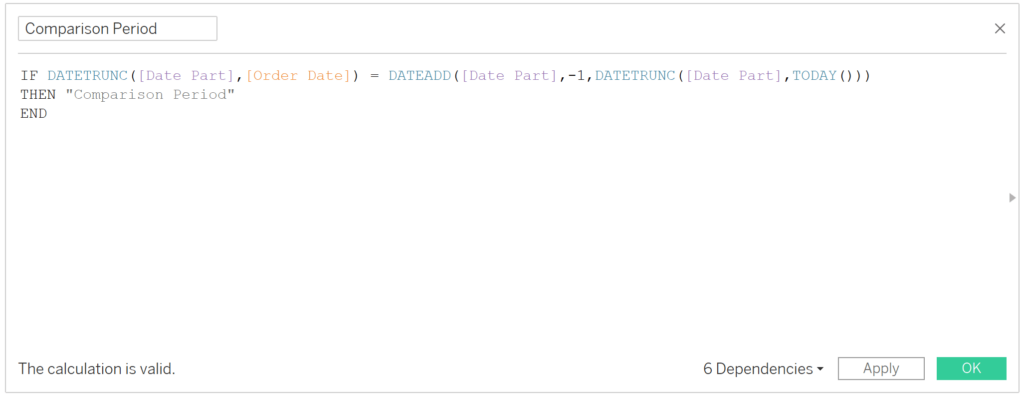
IF DATETRUNC([Date Part],[Order Date]) = DATEADD([Date Part],-1,DATETRUNC([Date Part],TODAY()))
THEN ‘Comparison Period’
END
If you’ve made it this far you can really see the value of what these calculations can be used for.
![]()
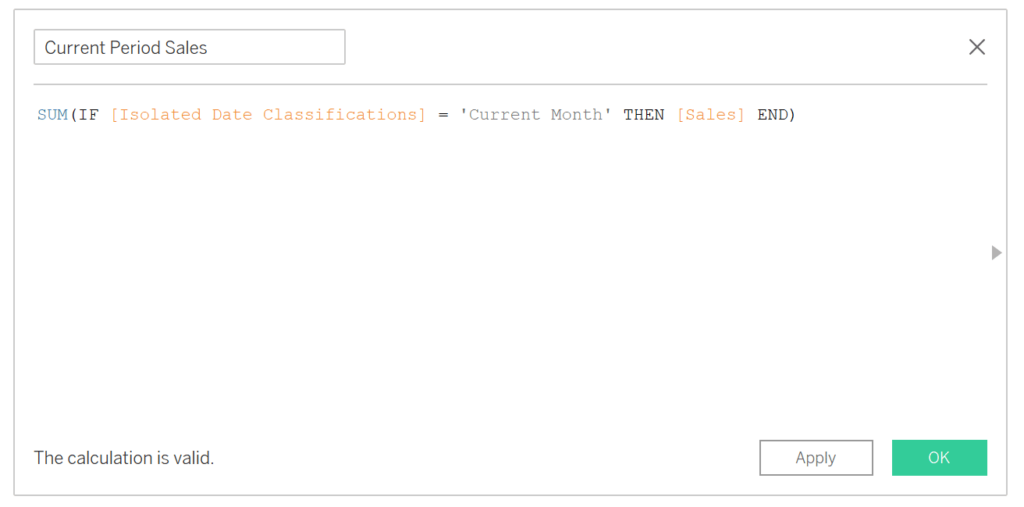
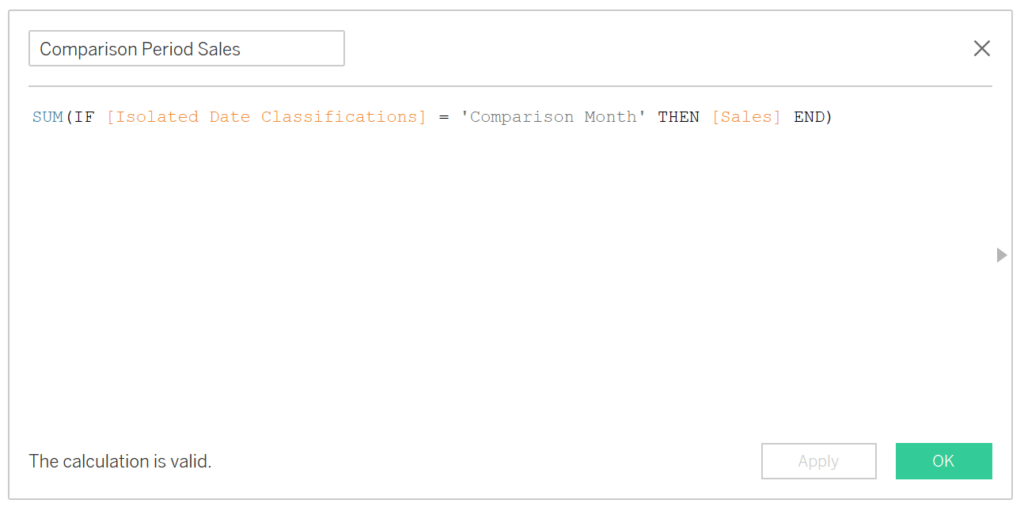
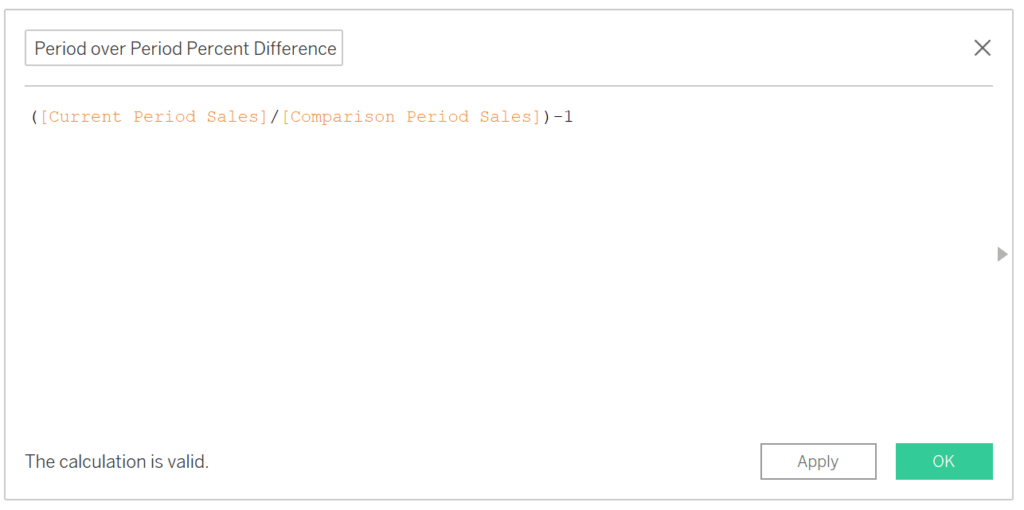
To outline a good example, let’s take the Isolated Date Classification field we created and use it to make a few more calculated fields. We will create calculated fields for the sum of the current period’s sales, the sum of the comparison period’s sales, and the percent difference between them.
SUM(IF [Isolated Date Classifications] = ‘Current Month’ THEN [Sales] END)
SUM(IF [Isolated Date Classifications] = ‘Comparison Month’ THEN [Sales] END)
([Current Period Sales]/[Comparison Period Sales])-1
I’ll create a new sheet and drop these onto the Text Marks Card to show them.
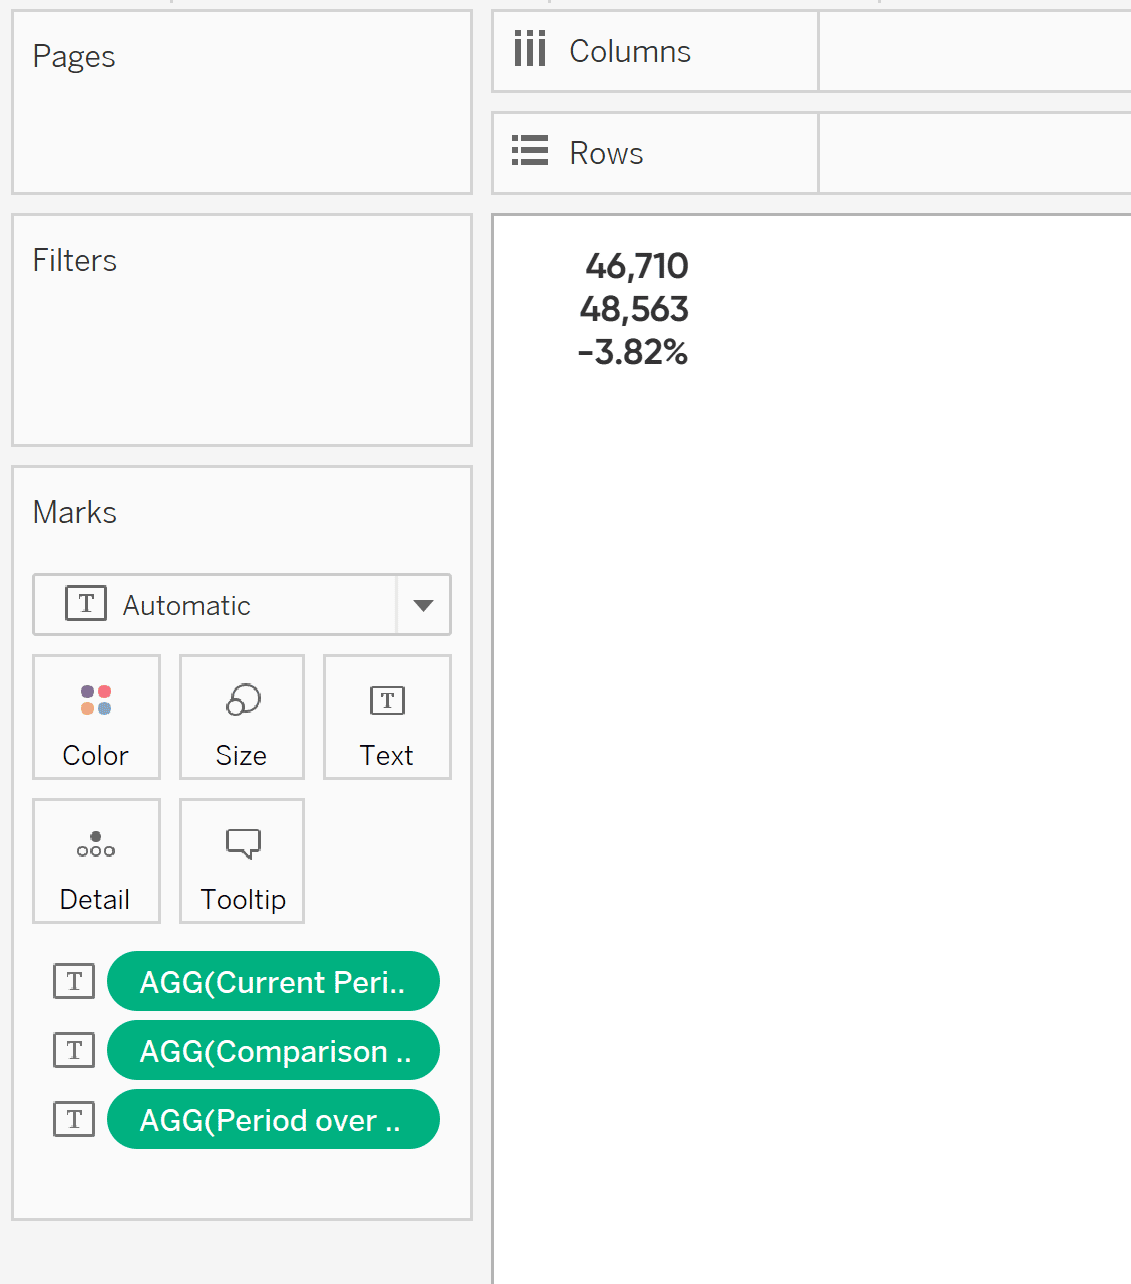
There we have it, the current period, comparison period, and the percent difference. To make it even better these are driven by our Date Part parameter as well!
Until next time,
Ethan Lang
Director, Analytics Engineering
[email protected]


Written By
Ethan Lang
Related Content
How to do Dynamic Date Selections in Tableau

In a lot of business cases, you are doing analysis based on common units of time such as: weeks, months,…
3 Essential Ways to Use Dynamic Parameters in Tableau
Dynamic parameters were introduced with Tableau Desktop version 2020.1 and rightfully created a lot of buzz among Tableau authors due…

Ryan Sleeper
Get more from your line graphs with this advanced tactic for equalizing dates Dates are tricky to work with in…