How to Dynamically Switch Data Sources Using Tableau Parameters

As an analyst, dashboard engineer, or even data engineer, we are generating more and more data that needs to be analyzed and sometimes the data can grow to a point where the file size is harming our performance in the Tableau dashboard. For many users, high load times (anything over a few seconds) might be seen as not just an annoyance but a legitimate problem. This is where it becomes practical to actually split out the data sources again and connect them individually. With parameters, we can trick Tableau in a way where it switches out those data sources in the background without the user even noticing the difference. Plus, you can still make use of other performance-improving features such as putting specific filters into context as well – so let’s get going!
Learn Performance Optimization Tips with Playfair+
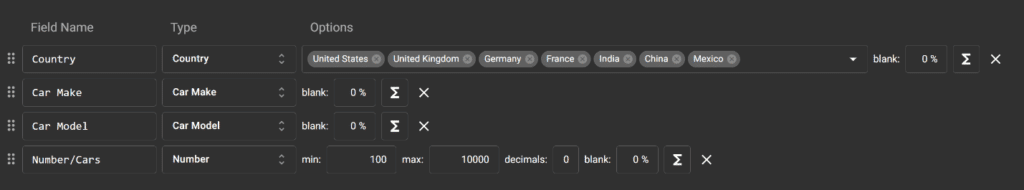
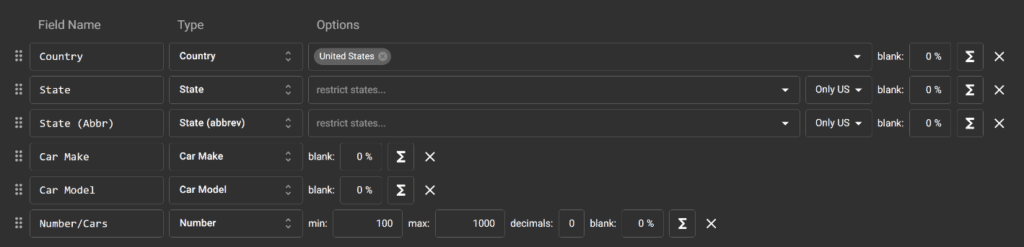
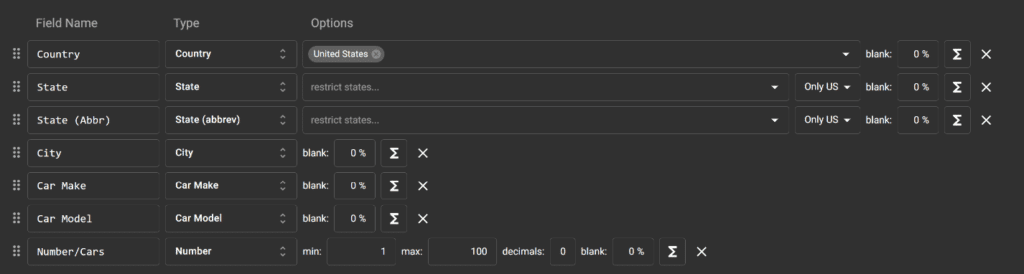
The different datasets needed to follow this tutorial
In order to showcase the different data sources, I created mock-up data through the platform Mockaroo, but you can of course do this with any kind of data that you would like to switch out.
![]()
The datasets also do not need to be about the same topic or be on subsequent level of details of each other. The logic I am going to show you can be used completely interchangeably to any kind of data.
Continue reading with a free account, or login.
Unlock this tutorial and hundreds of other free visual analytics resources from our expert team.
Already have an account? Sign In
By continuing, you agree to our Terms of Use and Privacy Policy.


Now let’s import all three of the created data sources into Tableau individually and get started with the logic bits!
Background
To import all the data sources separately, you have a couple of choices:
1. After adding the first data source, click on the little “database icon” to open up the option “New Data Source”

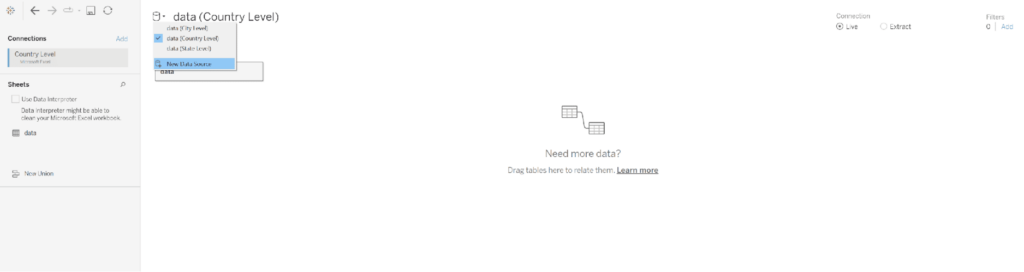
2. In the data source section of your Tableau workbook, you also get the header “Data” where you can find the ability to add a new data source

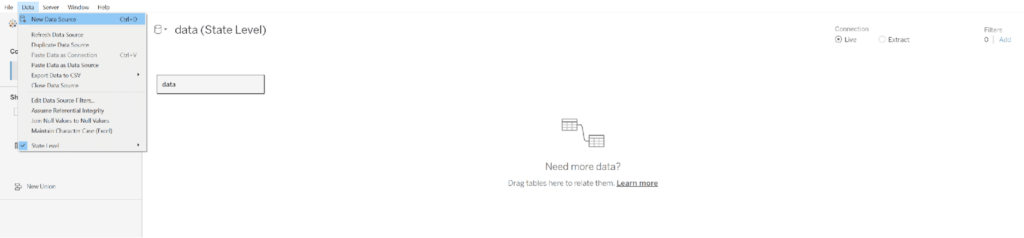
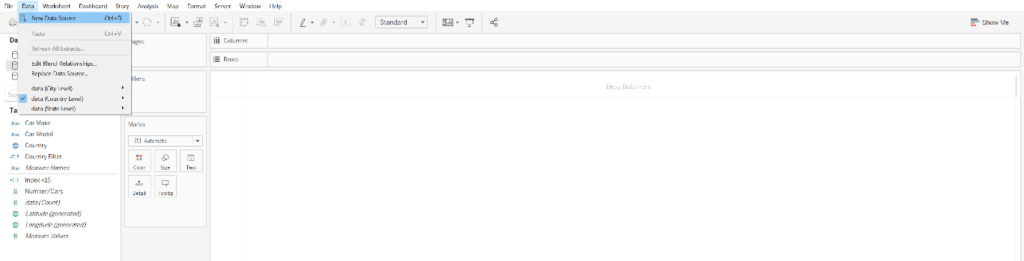
3. When you are located in an active sheet, you can click “Data” in the Header section and add an additional data source.

How to create the Tableau parameters to switch data sources
As the name of the blog suggests, we are going to use parameters to exchange the data sources on our dashboard in the end. So let’s start creating parameters for all three levels of our inputs namely:
- Country Parameter
- State Parameter
- City Parameter (optional)
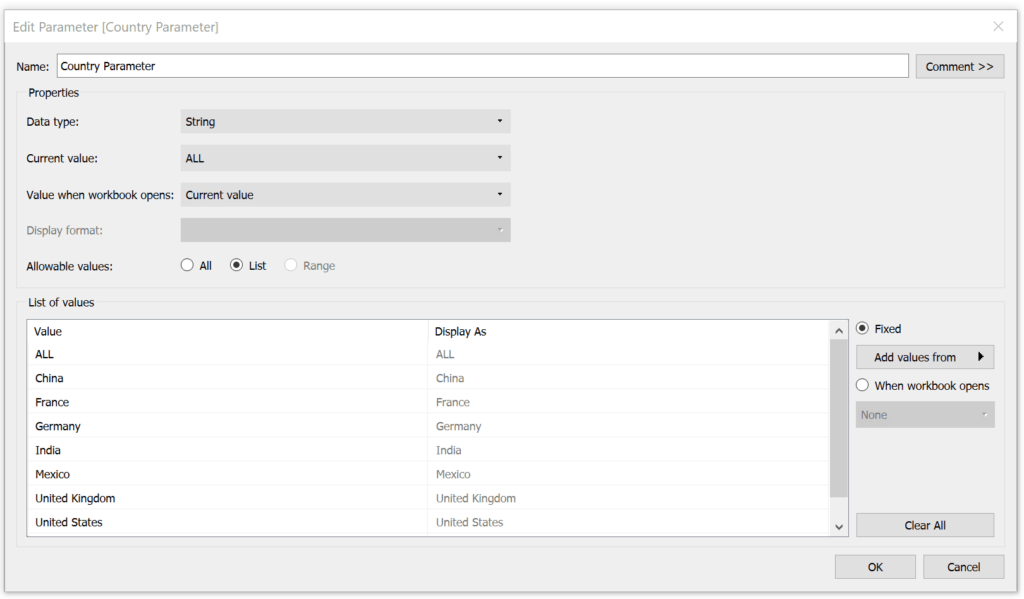
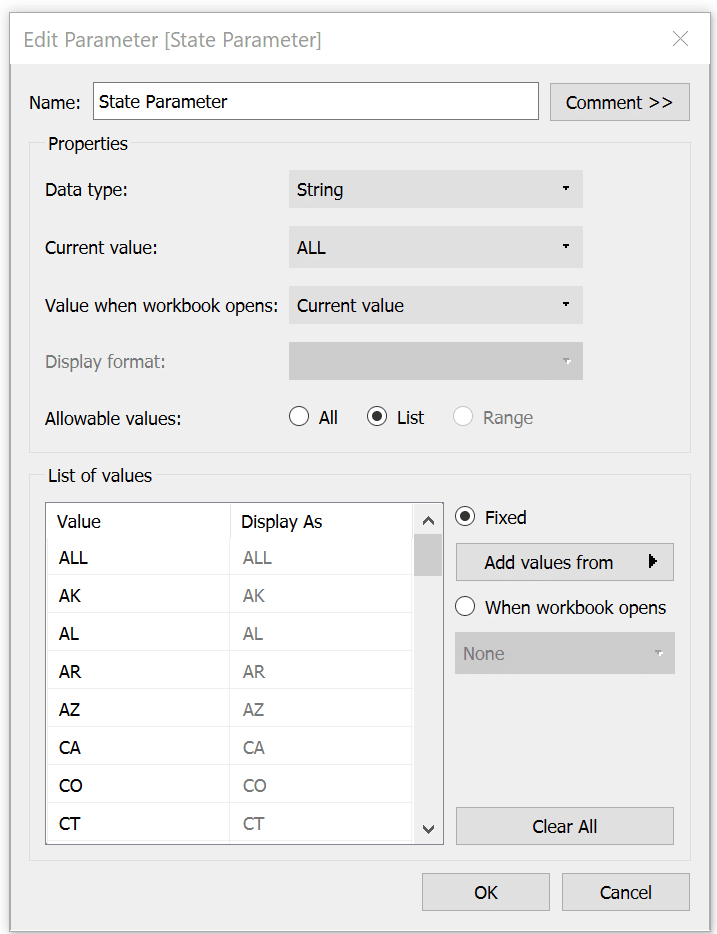
Country Parameter:
Set Data type to String, Allowable values to List, include “ALL” option manually and import the rest of the values from your country data source.

Continue doing the same for the State and City parameters, keep them as lists of strings and always include “ALL” manually as that will be our default setting.
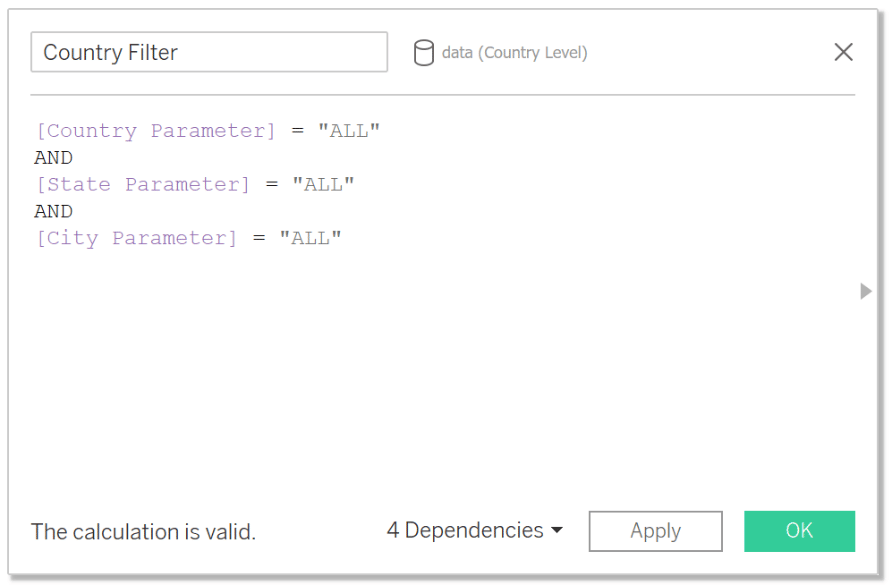
Each individual data source will need its own filter depending on the selections made within the parameters. For example, the Country Level data source will be our starting point when all our parameters are selected on “ALL”.
The logic for this looks like this:
[Country Parameter] = “ALL”
AND
[State Parameter] = “ALL”
AND
[City Parameter] = “ALL”

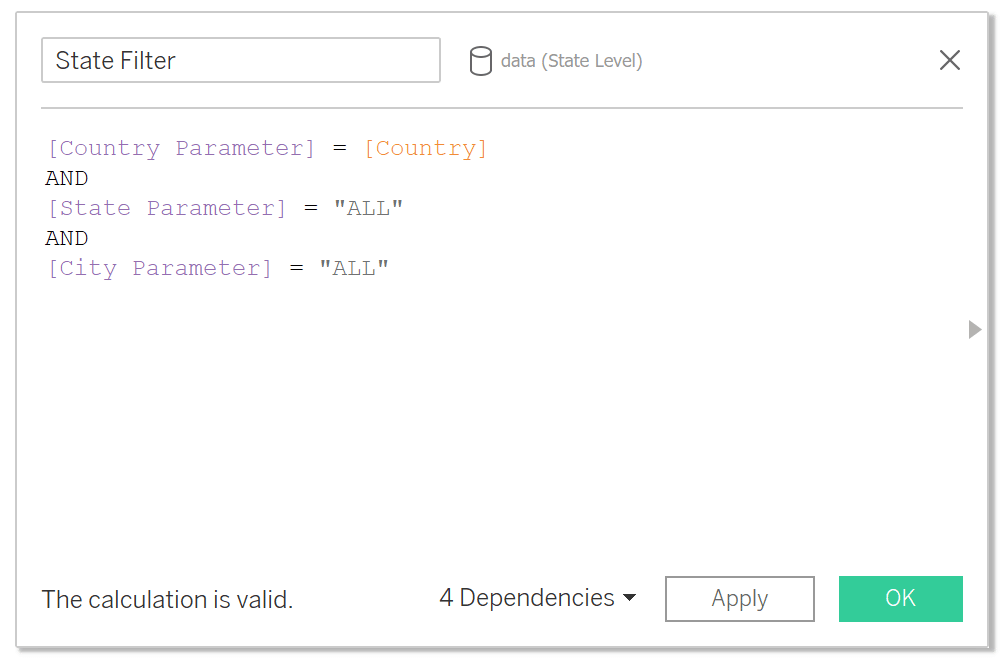
Now, our second level will be drilling down to a state level and we are switching the data source from the country-only level to the deeper state-level.
For this, a country is / will be selected by the user, and once this selection is made, they are seeing all states within their chosen country.
How to Make a Global Reset Button in Tableau
The formula for this state filter is the following:
[Country Parameter] = [Country]
AND
[State Parameter] = “ALL”
AND|
[City Parameter] = “ALL”

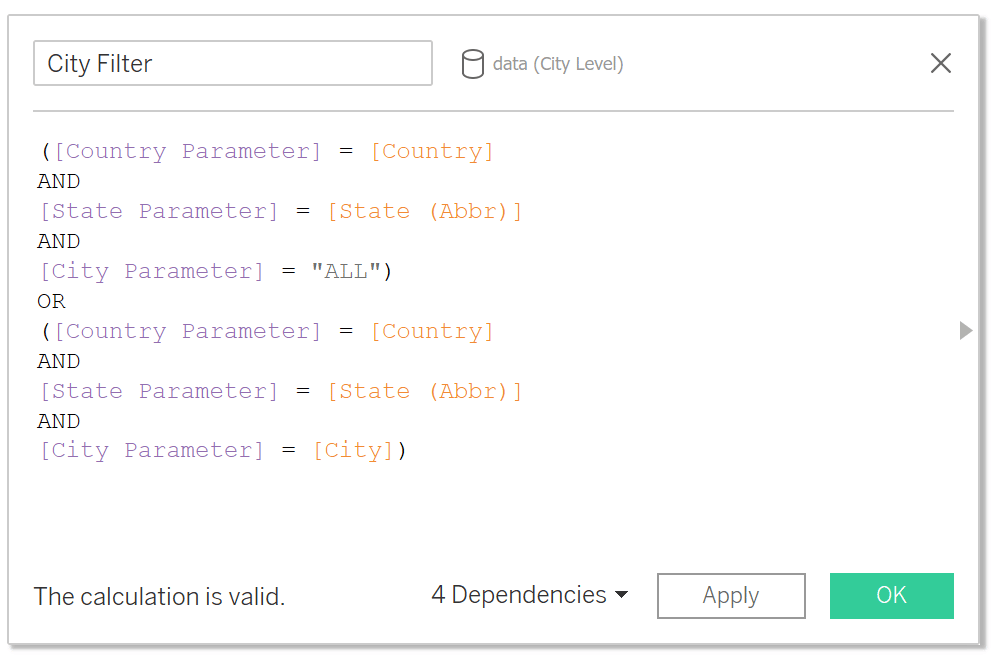
Last but not least, the lowest level of detail will be our city level. This means that based on the country and the state selected by the user, we will see the third data source displayed on the mentioned level.
The last logic can react not only to the country and state, but users can also drill down into a specific city through the city parameter.
The last formula is written as the follows: (variations available of this)
([Country Parameter] = [Country]
AND
[State Parameter] = [State (Abbr)]
AND
[City Parameter] = “ALL”)
OR
([Country Parameter] = [Country]
AND
[State Parameter] = [State (Abbr)]
AND
[City Parameter] = [City])

How to implement the data source swap within a Tableau worksheet
Once we have our parameters created, we are going to create our actual visualizations. Now, these can be totally separate from each other with completely different vizzes on different levels as we are switching them out completely.
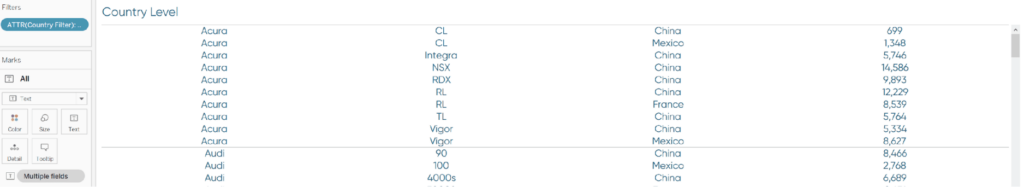
My first viz is just a simple crosstab based on the Country Level dataset with the addition of the Country Filter in the Filters pane on the left. Now if all my parameters for country, state and city are on “ALL”, the Filter should give me the option to select “TRUE”. This is important, as we want the dashboard to go completely blank on the opposite site, namely “FALSE”

After creating this first worksheet, I can then go ahead and create the same visualizations based on another dataset or a completely different visualization in total.
How to Let Users Choose Dimensions and Measures in Tableau
For this example, I created the same Crosstab on 3 levels, based on the 3 different datasets. Each time, I added the respective filter to the worksheet’s Filters pane. When I was working on the State Level data, I added the State Filter.
HINT: In order to be able to see anything on the newly created views, make sure the parameters are selected on something outside of “ALL” for Country, and later for State. Otherwise, when you are adding the filters to the pane, the only option you will see is “FALSE” and we are not selecting / ticking the checkbox for false to make sure our functionality is working.
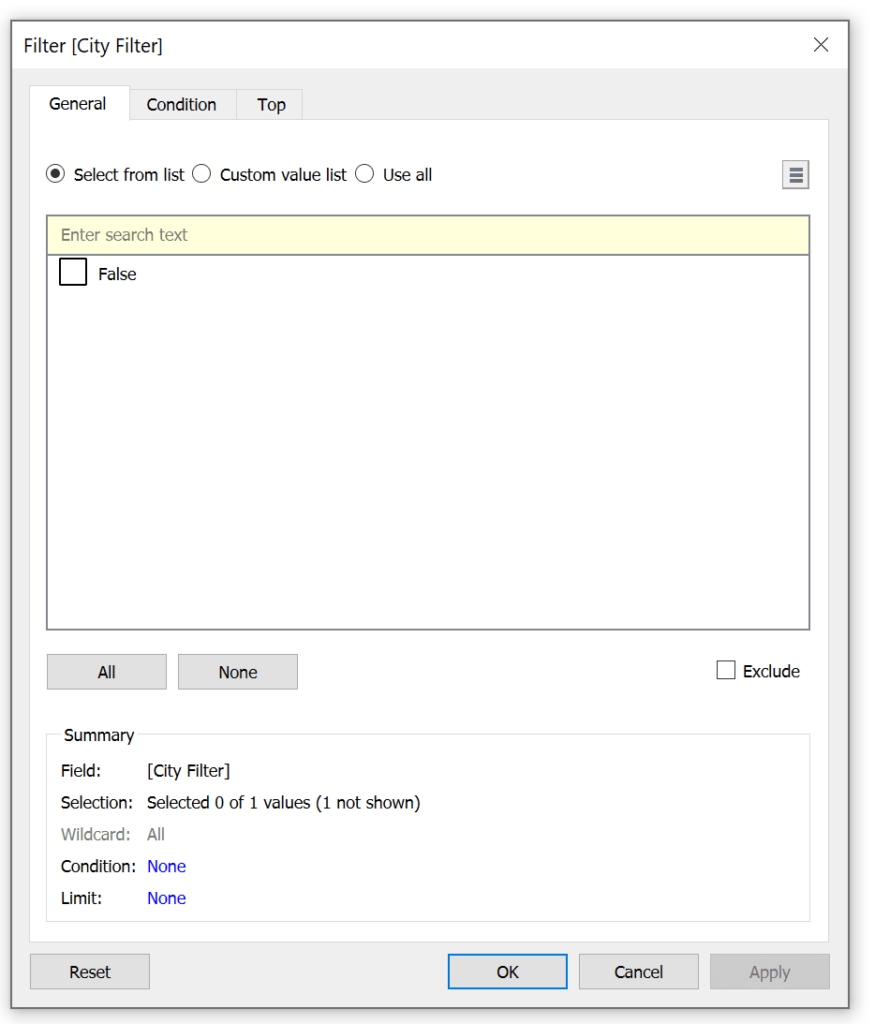
For example, if the parameters for country and state are still on “ALL”, the City Filter only gives us the False option.

Now, bringing this all together in one Dashboard, we are going to use containers to make our magic work.
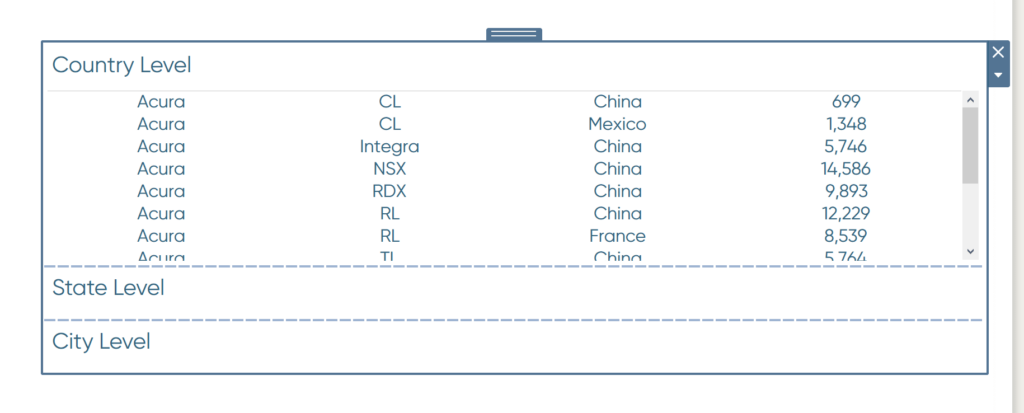
I have put one vertical container on my dashboard, building the infrastructure of my 3 worksheets. Once the container is on the view, I am dragging and dropping each of my worksheets into the container (hold SHIFT on the keyboard) and making sure I drop them underneath each other. What you will get is a view like this one below, where you can see all the sheet headers, but only one worksheet is actually working and showing a result.

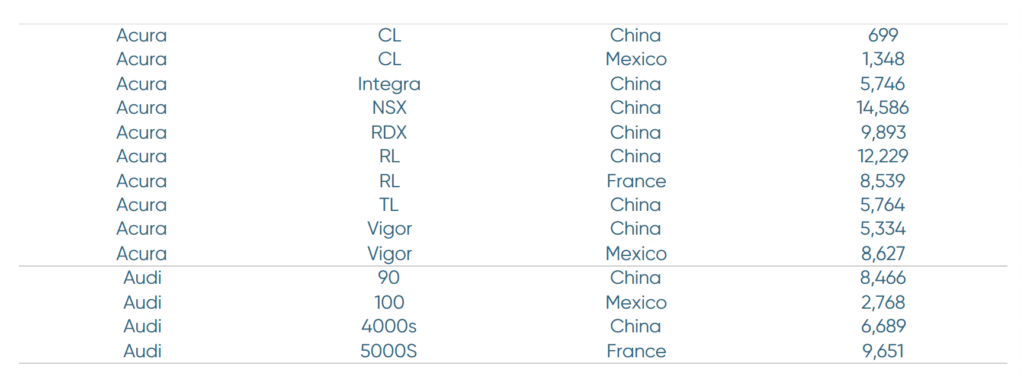
The next step is you are going to HIDE all the worksheet headers to completely and change the FIT to “Entire View” for all of them. Because you need to select the entire view, I recommend doing some pagination or limit your results via Index Filters.
How to Do Pagination in Tableau
HINT: If you are having a hard time selecting each sheet in the container, use the layout pane to the left to help navigate.
![]()
You will end up with something that looks like this:

Now, to make it more visually appealing, I have added a section to position the parameters, dynamic headers, and an indicator on which data source we are currently displaying. My final result also focused on color coding each of the levels for an easier understanding of what is displayed. Feel free to download and check it out on our Tableau Online!

Now it is your turn to try it out! As a reminder, your datasets do NOT need to be related to each other as long as you can create parameters that make sense in terms of switching it out. Your visualizations are also not bound to any crosstab; feel free to be creative and crazy!
Stay hungry,
Maggy

Written By
Maggy Muellner

Peer Review
Ethan Lang
Director, Analytics Engineering

Peer Review
Maddie Dierkes
Manager, Decision Science

Graphic Design
Dan Bunker
Manager, Decision Engineering
Related Content
3 Creative Ways to Use Tableau Parameter Actions
I have always described Tableau parameters as a Swiss Army knife due to their infinite applications. In case you are…
3 Tips for Data Quality Assurance (QA) in Alteryx

Anyone who works with data would probably say that ensuring accuracy is half the battle. While a final Quality Assurance…

Ryan Sleeper
Overwrite parameter values by simply interacting with a dashboard Learn how to add a “Change Parameter” action to a dashboard;…