How to Equalize Year Over Year Dates on One Axis in Tableau
Comparisons and viewing trends across dates are two effective ways to turn raw data into insights, but dates can be tricky to work with in Tableau. I illustrated in my last post how to find hidden patterns in line graphs by adding a slope graph toggle, but what if the dates are not lined up on the same axis? For example, if you were to make a sales by continuous Order Date line graph with Tableau’s Sample – Superstore dataset colored by Year, you would get four colored lines that do no not line up on top of each other.
Tableau does not have a Month + Day date part, which can make it challenging to compare year-over-year performance. Due to this, I often go through the relatively elaborate process of setting up two sets of date comparison filters and equalize the dates so the lines are right on top of each other. This post will show you a simpler way to normalize months and days so they share the same axis when colored by year. When the marks line up, it is much easier to evaluate year-over-year performance.
The challenge of not having a month + day date part in Tableau
First, let’s have a look at why this tip is needed. Here is an illustration of the sales by continuous Order Date line graph mentioned in the introduction.
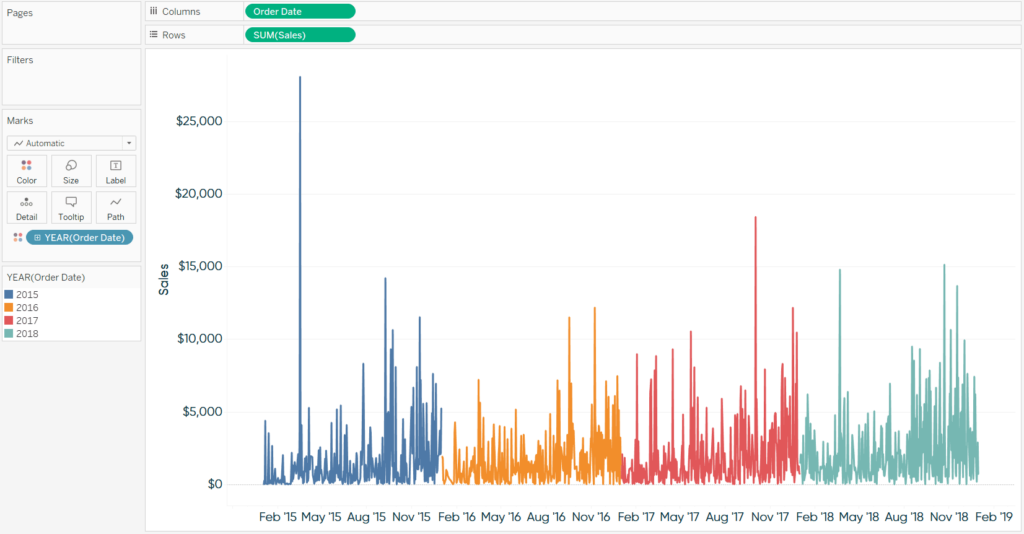
As you can see, while all four years are represented on the line graph, it is difficult to compare the same time period year over year. For example, it is almost impossible to determine if the peaks in each year line up on or around the same dates. This would be much easier to evaluate if the lines for all four years were lined up on top of each other on the same axis.
![]()
Before I discovered the tip that I’m about to share, I would go through the manual process of adding the appropriate number of days to each historical year in my dataset to get them to line up with the current year; something like this:
IF YEAR([Order Date]) = 2018 THEN [Order Date]
ELSEIF YEAR([Order Date]) = 2017 THEN [Order Date] + 365
ELSEIF YEAR([Order Date]) = 2016 THEN [Order Date] + 365 + 365
ELSE NULL
END
This approach works, but has a few limitations:
– It requires the user to do the math to properly normalize year-over-year dates
– It does not account for Leap Day
– It is not scalable in that if more years are added, the formula doesn’t automatically account for new dates
Continue reading with a free account, or login.
Unlock this tutorial and hundreds of other free visual analytics resources from our expert team.
Already have an account? Sign In
By continuing, you agree to our Terms of Use and Privacy Policy.
Equalizing year-over-year dates on the same axis using the MAKEDATE function
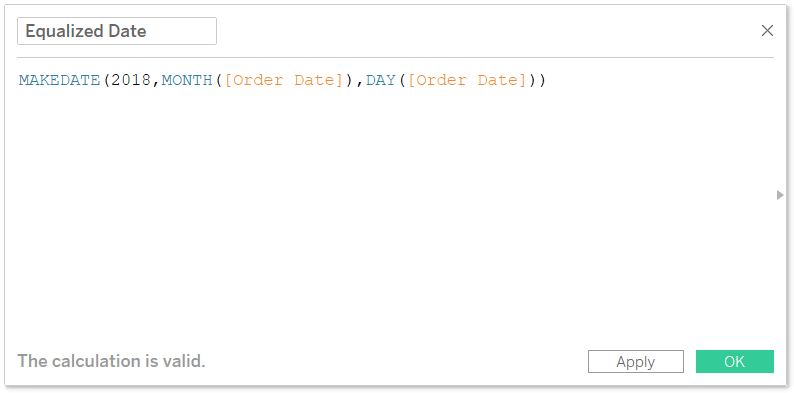
An easier way to normalize year-over-year dates is to create a calculated field that combines the Month and Day date parts of each date in your dataset with the current year. This can be achieved using the MAKEDATE function and this formula:
MAKEDATE(2018,MONTH([Order Date]),DAY([Order Date]))
Now if I replace the original Order Date field on the Columns Shelf with my newly created Equalized Date field, the lines for all four years will line up in 2018.
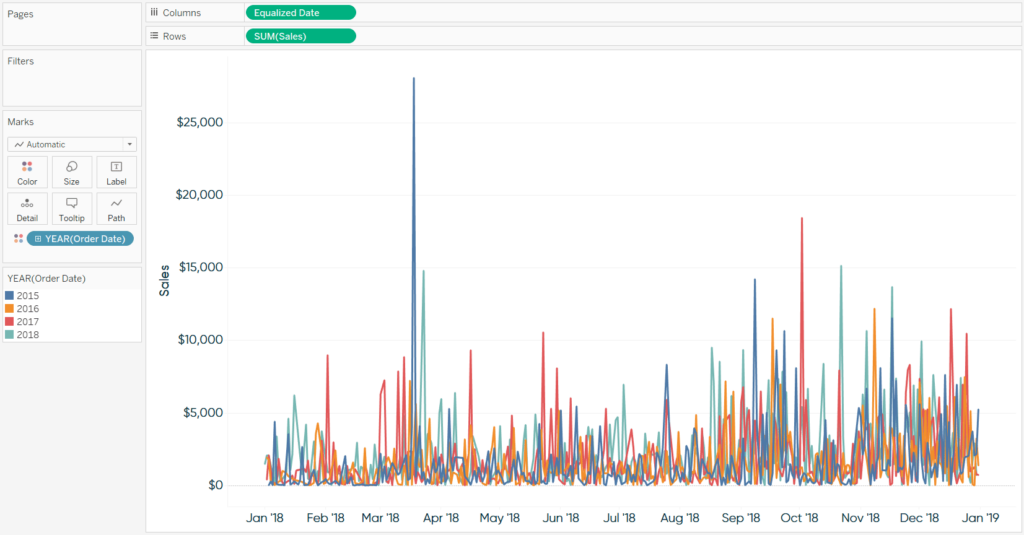
Admittedly, this view has too many marks to see much more than the spikes, but you can now filter on the Equalize Date field to display fewer marks.
![]()
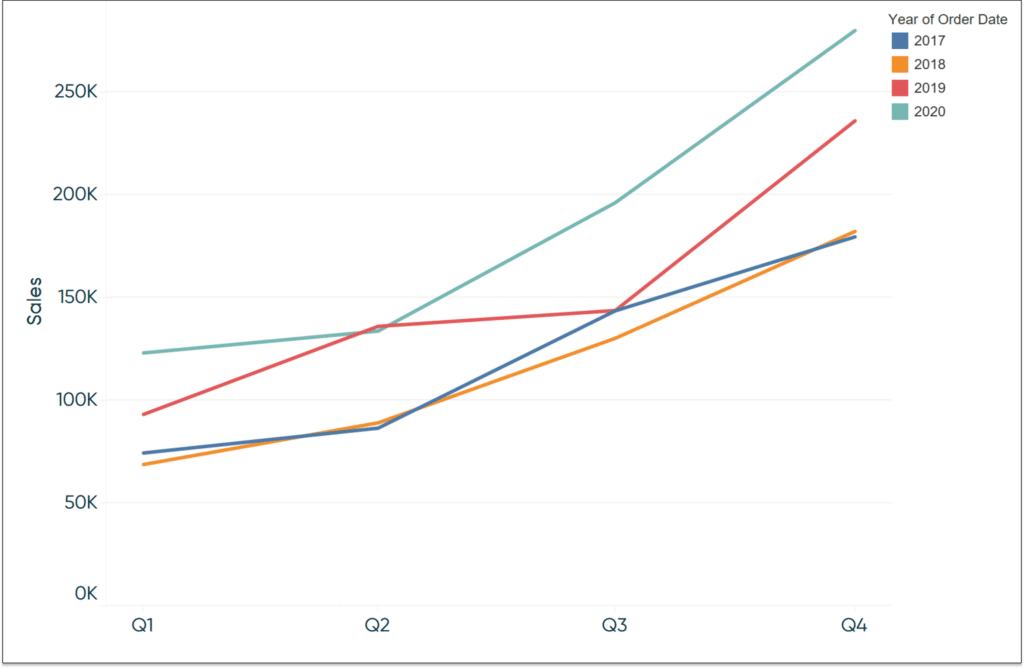
You can also change the date part of the Equalized Date field and everything will still line up year over year. Here’s how the view looks when changing the date part from Day to Quarter.
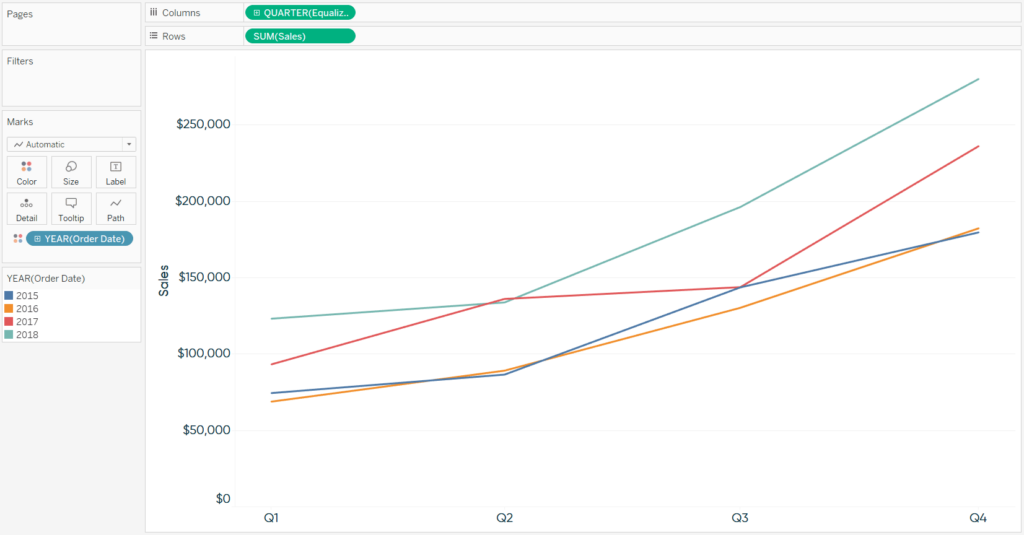
You can even take this a step further by allowing you and your end users to change the date part of the equalized date on the fly – just replace Order Date with Equalized Date in the tutorial.
Thanks for reading,
– Ryan

Written By
Ryan Sleeper
Related Content
How to Normalize Current and Prior Dates on the Same Axis in Tableau
Dates can be tricky to work with in Tableau. It’s no wonder there are six different chapters in Practical Tableau…

Ryan Sleeper
Automatically Compare Full Days, Weeks, Months, Quarters, or Years Learn a calculated field that (1) looks at today’s date, (2)…
Ryan Sleeper
Automatically Compare the Last Two Partial Weeks or Months Ryan shares the three calculated fields required to automatically compare the…