Practical Tableau: 3 Creative Ways to Use Dashboard Actions
Dashboard actions, filters, and parameters are three of the best tactics to use in Tableau because they provide a way to transfer control of the analysis from you to your end users. This is critical in data visualization because it helps you allow discovery for your users and makes the insights they find easier to retain. In this chapter, I provide an introduction to dashboard actions and we will walk through three different ways to leverage dashboard actions to improve your user experience.
An Introduction to Tableau Dashboard Actions
An introduction to Tableau dashboard actions
Before I share three ideas on how to use dashboard actions, here’s a quick primer in case you are not familiar with this functionality. If you’re comfortable with the concept of dashboard actions, feel free to jump down to the first tip, Tableau dashboard action 1: Use every sheet as a filter.
Dashboard actions in Tableau allow you to add logic to dashboard components that create actions somewhere else. For example, you can add logic that says, “If a user clicks on Dashboard Sheet 1, I want something to happen on Dashboard Sheet 2.” If you think about dashboard actions this way, their setup is very intuitive in Tableau. To set up a dashboard action, navigate to Dashboard > Actions in the top navigation from any dashboard view. A dialog box will appear, and when you click the button “Add Action >” in the bottom left corner, you will be presented with three options for the type of dashboard action that you want to add:
- Filter – Example: If you click on sheet one, sheet two will be filtered to whatever you clicked on sheet one.
- Highlight – Example: If you click on sheet one, sheet two will be highlighted by whatever you clicked on sheet one.
- URL – Example: If you click on sheet one, open a URL (this can either be opened on a webpage dashboard component or in a new browser window).
Continue reading with a free account, or login.
Unlock this tutorial and hundreds of other free visual analytics resources from our expert team.
Already have an account? Sign In
By continuing, you agree to our Terms of Use and Privacy Policy.
Once you choose which type of dashboard action to add, you are taken to a new screen where the logic for your dashboard action is coded:
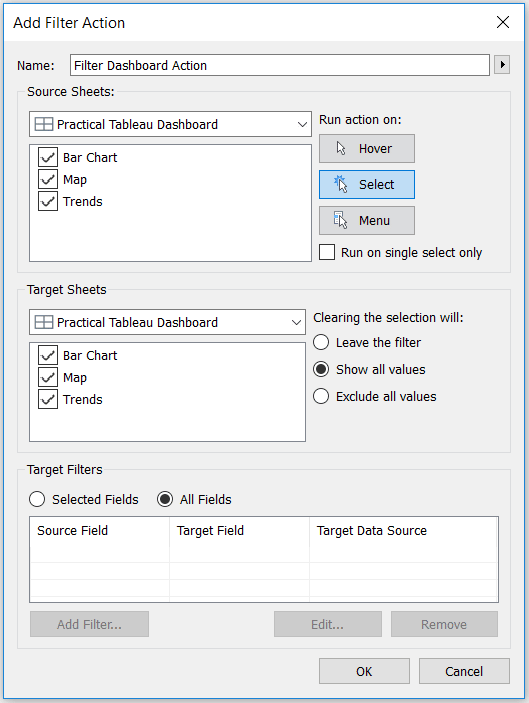
The “Source Sheets” list shows you all of the sheets you have on the dashboard where you are adding the action. Any sheets selected in this list will cause the dashboard action to execute.
The “Target Sheets” list also shows all of the sheets in the dashboard, but these are the sheets where you want the action to take place.
Pretty intuitive so far, right?
![]()
From here, there are a few options for your dashboard actions. First, you can have the action execute on three different interactions (pictured in the top right corner of the dialog box):
- Hover – Example: If you hover over the source sheet, the action will take place on the target sheet.
- Select – Example: If you click on the source sheet, the action will take place on the target sheet.
- Menu – Example: If you hover over the source sheet, a menu of dashboard actions will appear in the tooltip. Clicking on one of the menu items will execute the action on the target sheet.
You can also tell Tableau what you want to happen if the dashboard action is cleared (which can be done by clicking escape):
- Leave the filter – leaves the last dashboard action that happened in place. If you filtered sheet two by something clicked on sheet one, the filter on sheet two will stick.
- Show all values – reverts back to the original view as if no dashboard action took place.
- Exclude all values – clears everything off of the target sheet, meaning the target sheet will not show unless a dashboard action is executed.
Lastly, you can refine the dashboard action to take place against certain fields using the “Target Filters” options at the bottom of the dashboard actions dialog box. By default, the dashboard action will run on every shared field between the source sheets and the target sheets. If you want to change the level of detail that a dashboard action runs on a target sheet, you would need to add a target filter to specify the fields – essentially telling Tableau how granular you want to be.
Tableau dashboard action 1: Use every sheet as a filter
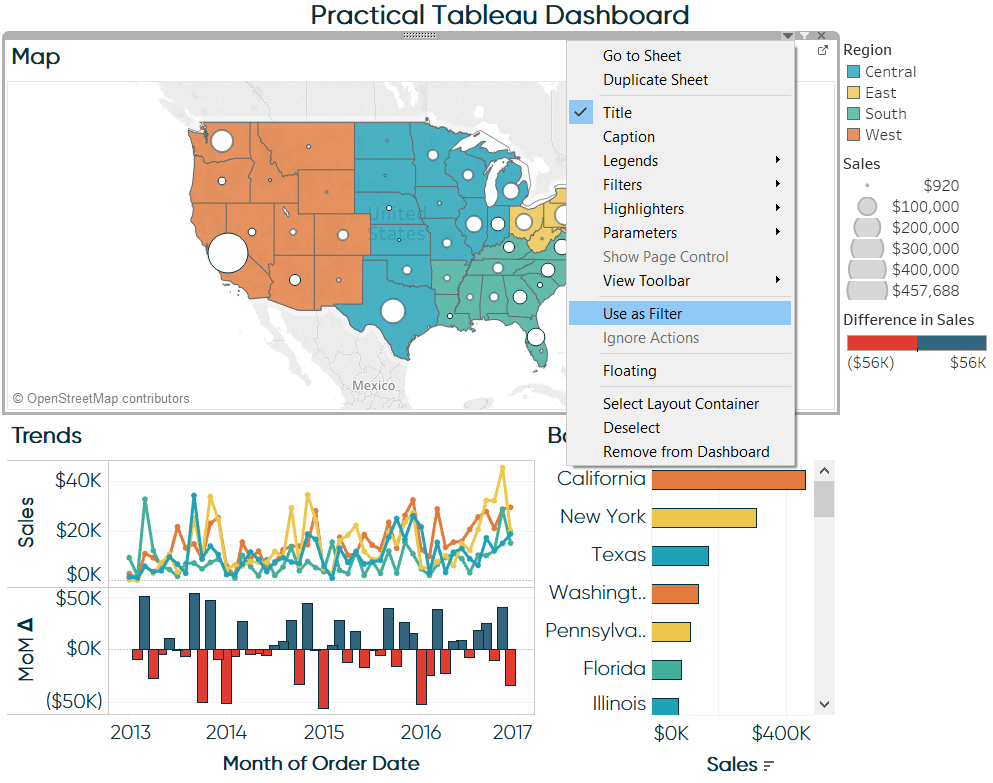
Any sheet in a dashboard can be used as a filter by simply hovering over the sheet, clicking the down arrow that appears in the top right corner, and choosing “Use as Filter”. This is basic Tableau functionality, but it wasn’t until I saw a presentation from Kevin Krizek of Tableau, that I realized it would be good practice to allow users to use every sheet in a dashboard as a filter. Adding this functionality to your own dashboards gives your users flexibility in choosing how they want to look at the data.
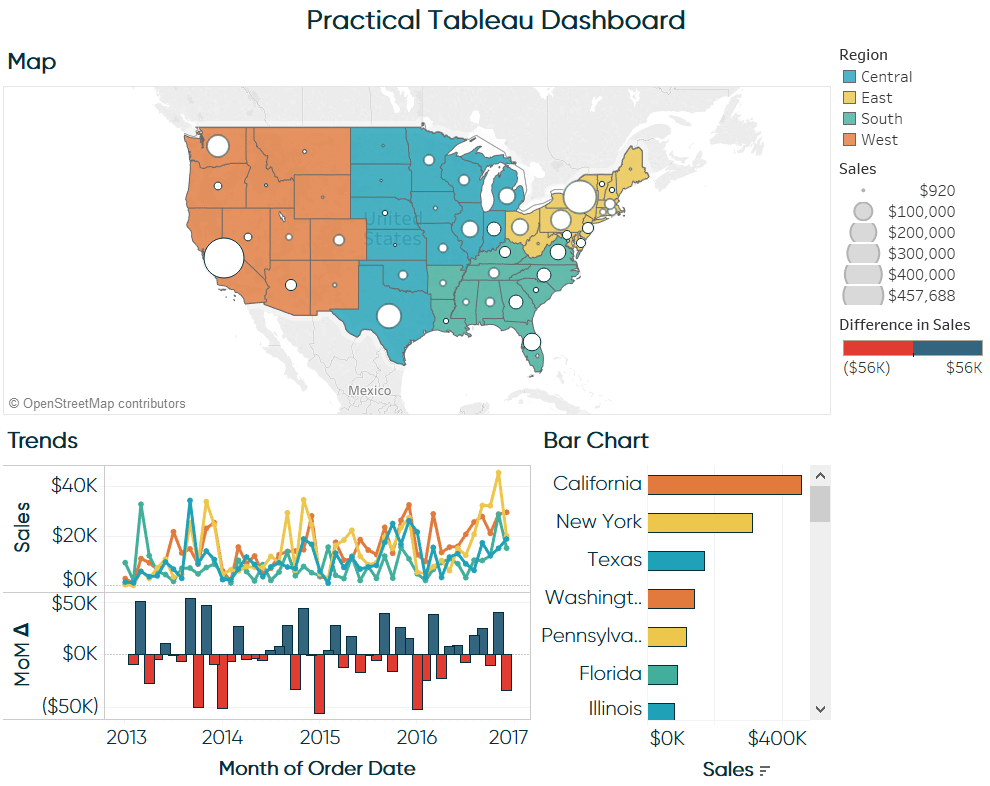
Let’s take a look at how this would work with a sample dashboard that I often create while speaking about Tableau. Here is the original view:
I will now choose to use every individual dashboard sheet as a filter for the entire dashboard by hovering over the sheet, clicking the down arrow that appears in the upper right, and selecting “Use as Filter” (on all three sheets):
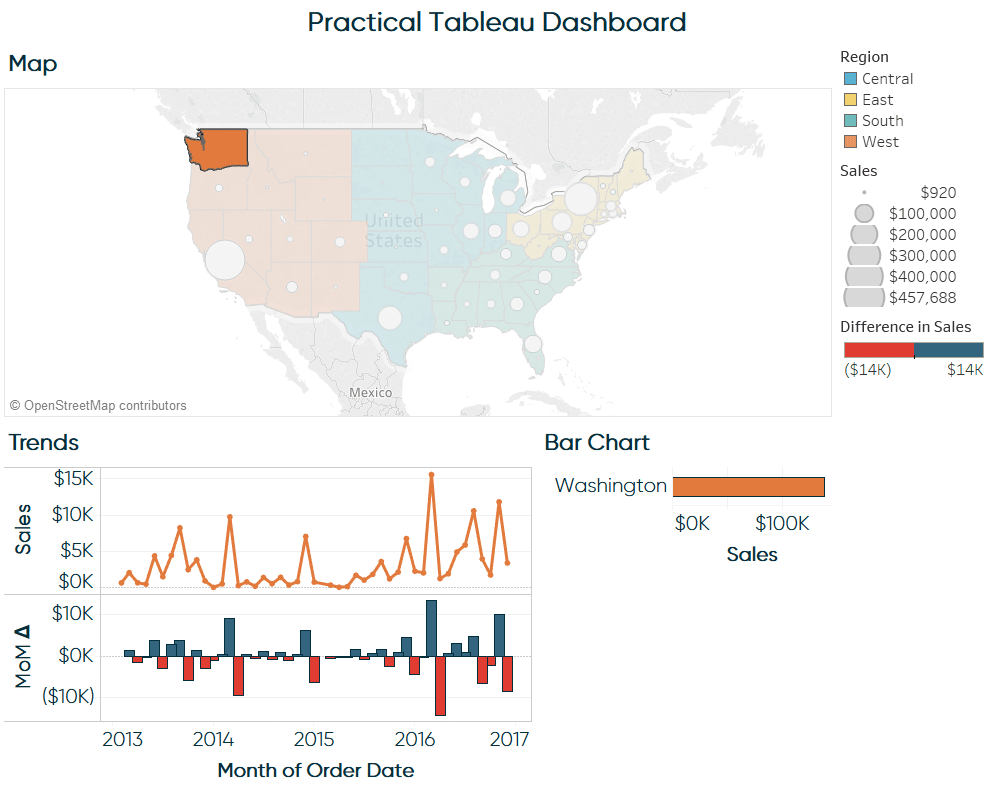
Now when I click on any sheet, the other sheets are filtered to whatever I clicked on. For example, if I click on Washington in my map view, the trend line and bar chart sheets will be filtered to just that state:
What is actually happening behind the scenes when I choose to use a dashboard sheet as a filter is that Tableau is automatically creating a dashboard action like shown in the dashboard actions introduction above. You can confirm Tableau created dashboard actions by navigating to Dashboard > Actions.
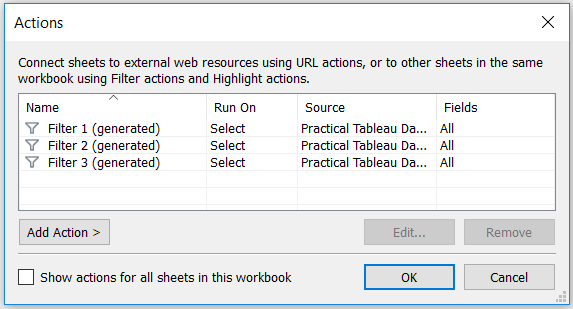
The good thing about setting up each dashboard as a filter instead of sharing one dashboard action between all of the source sheets is that you can refine the actions independently of each other. For example, the bar chart doesn’t add much value when it is filtered to just Washington as pictured above. Maybe it would be better if I added a target filter that filtered the bar chart to region instead of state when I click on the map. On the other hand, I would like the map to show just one state on the map if I click an individual state on the bar chart. In order to have these two different levels of filter granularity, I would need two separate dashboard actions.
Tableau dashboard action 2: Embed YouTube videos in a dashboard
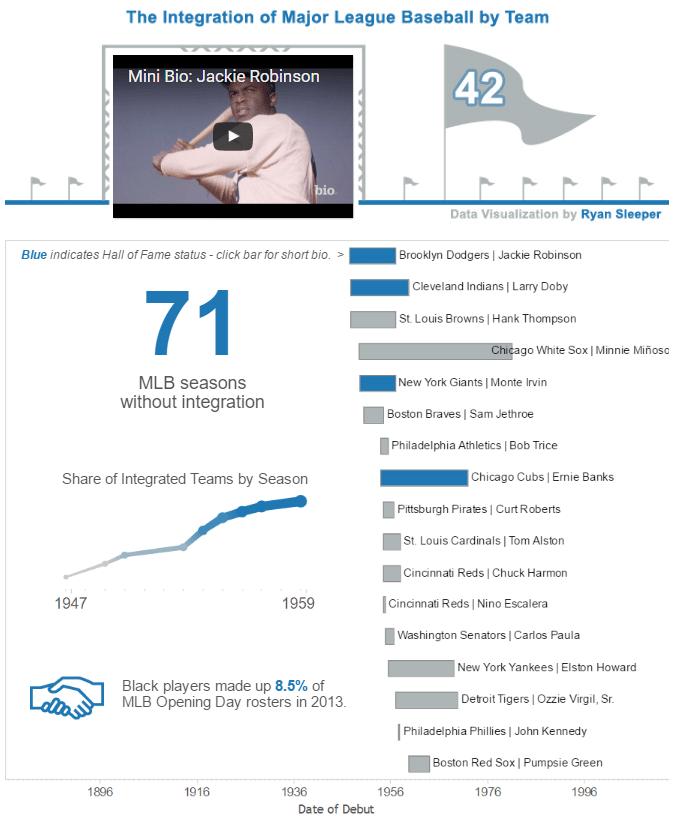
This is a tip I first picked up from the author of this book’s foreword, Ben Jones, at his excellent blog, DataRemixed.com. The first time I embedded a video in a Tableau dashboard was my 2013 viz, MLB Integration by Team.
[Click image to view full interactive version]
This novel effect was actually quite easy to create in Tableau. The only tricky part is finding the correct YouTube links and having the YouTube links as a field in your underlying data source. Here’s a look at the underlying data for this viz:
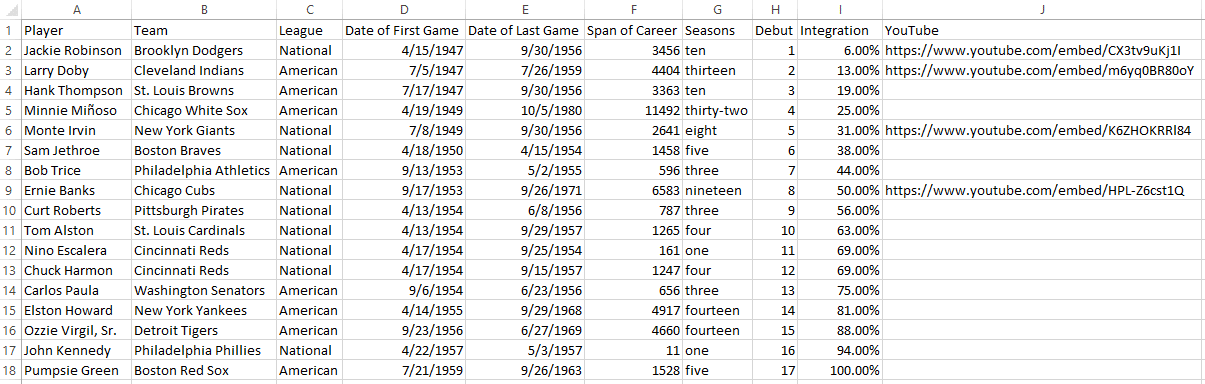
To find the correct link to use in your data source, follow these steps:
- Find the video you want to embed on YouTube
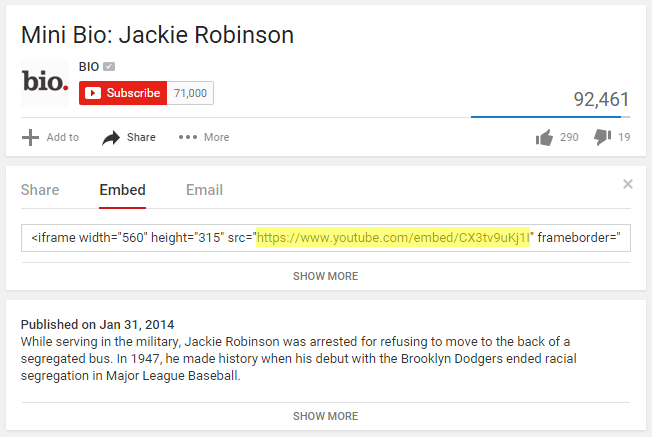
- Click the Share icon below the video
- Click the Embed tab
- Copy the URL that appears between the quotation marks
Now that you have the data, follow these steps to use dashboard actions to embed a YouTube video in your Tableau dashboard:
- Add a “Web Page” dashboard component by dragging and dropping it on your view from the left navigation of a dashboard view. In my case, I used a floating Web Page widget so that I could make it the exact same dimensions as the scoreboard; providing the illusion that the video is being displayed on the jumbotron. When you add the Web Page widget, Tableau will ask you to enter the URL for the page you want to display; leave this blank for now because we will be using a dashboard action to provide these instructions.
- Add a dashboard action by navigating to Dashboard > Actions > Add Action
- The dashboard action should be a URL action. You can refine the settings to have the action run on Hover, Select, or Menu; I have chosen for the action to run on Select (which is the same as click).
- Lastly, for the URL, click the arrow that appears next to the empty URL box. You should be shown a list of options including the URL field in your underlying data. Click the URL field so that the video associated with a particular record will start when the action is run.
Here’s how my final dashboard action looks:
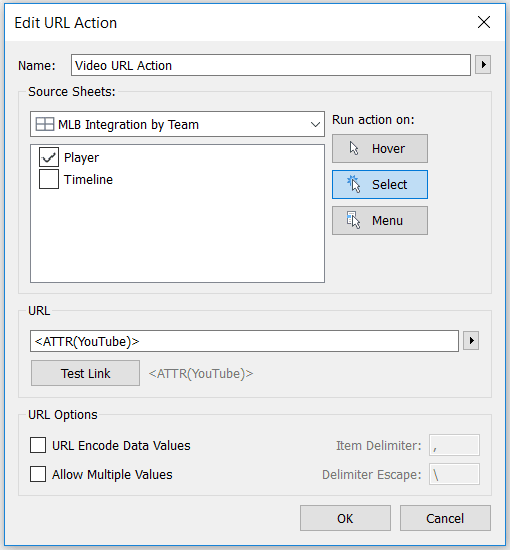
Now if I click a name on sheet 1 that has a corresponding video link, the YouTube video will load in the empty Web Page widget that I added. The videos can be consumed right there in line with the rest of the Tableau viz!
Tableau dashboard action 3: Do a Google search or Google image search from a dashboard
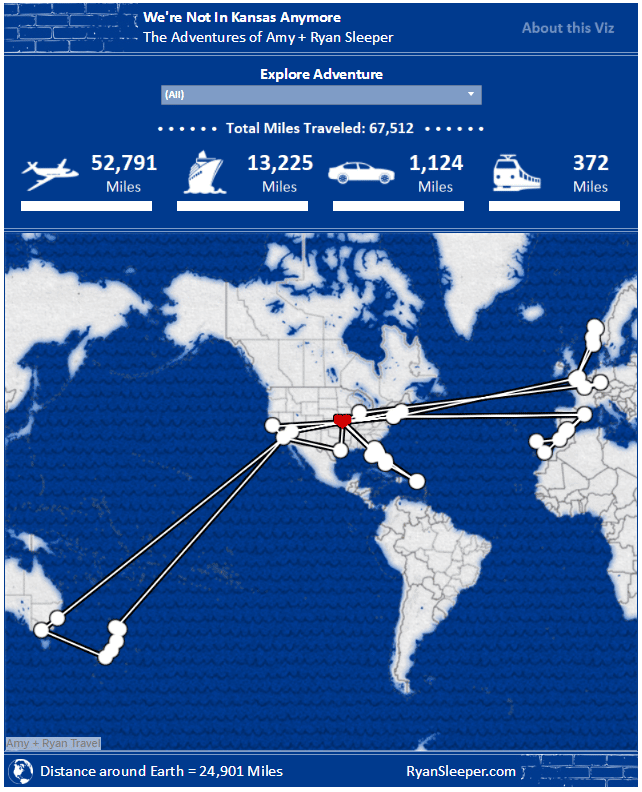
One of the most effective implementations of my third tip was in the winning entry of 2015 Iron Viz Championship by Shine Pulikathara. In the viz, users can explore news stories or related images by following links provided within the Tableau dashboard for thousands of different data points. The first time I integrated functionality that would do a Google Image Search from a Tableau dashboard was in a viz I created for my wife to document our travels, We’re Not in Kansas Anymore. Clicking on any location will open a new browser with a Google Image search for that location.
[Click image to view full interactive version]
Here are the steps required to create this user experience:
- Go to Google Images and search for one of the locations
- Record the URL that appears in the browser. A search for Kansas City resulted in this URL: https://www.google.com/search?q=kansas+city&source=lnms&tbm=isch&sa=X&ved=0ahUKEwiH6eqWhoDKAhVWz2MKHctYBJsQ_AUICSgD&biw=1366&bih=643
- You can keep the entire link, but all that you actually need is: https://www.google.com/search?q=kansas+city&tbm=isch – this URL includes the query (Kansas City) and tells Google to show results on the image tab (isch = image search)
- Add a dashboard action by navigating to Dashboard > Actions > Add Action
- The dashboard action should be a URL action. You can refine the settings to have the action run on Hover, Select, or Menu; I have chosen for the action to run on Select (which is the same as click).
- Lastly, for the URL, paste the URL that you recorded from the search above. Replace the portion of the URL for the query, which is the text immediately following the “?q=”, with a field from your data. You can add a field from your data source by clicking the arrow that appears next to the empty URL box. I wanted to run a search for each city, so I used the field <City> from my data source.
![]()
Here’s how my final dashboard action looks:
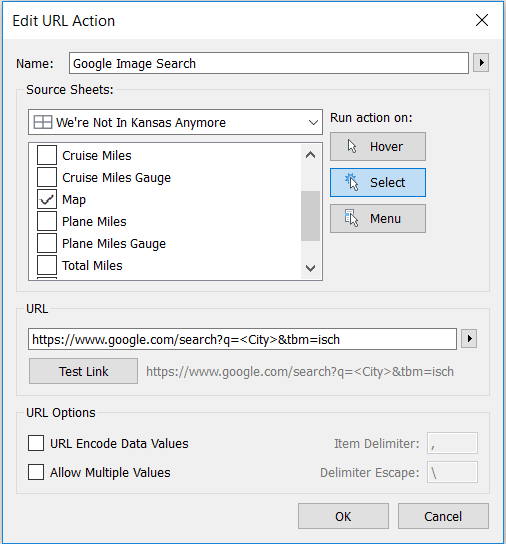
Now if I click a place on my map, a Google Image search is executed with the name of that city (from my underlying data) as the search query!
This chapter has provided an introduction to dashboard actions in Tableau, showed you how to use every sheet as a filter, how to embed a video in a Tableau dashboard, and how to do a Google search from a Tableau dashboard. All three of these dashboard action examples share a common thread of allowing discovery, one tactic for improving the retention of insights for you and your audience.
Thanks for reading,
– Ryan
This content is excerpted from my book Practical Tableau: 100 Tips, Tutorials, and Strategies from a Tableau Zen Master published by O’Reilly Media Inc., 2018, ISBN: 978-1491977316. Get the book at Amazon.


Written By
Ryan Sleeper
Related Content

Ryan Sleeper
Control any parameter actions scenario with a second data source One drawback to parameter actions is the value you want…
Ryan Sleeper
Overwrite parameter values by simply interacting with a dashboard Learn how to add a “Change Parameter” action to a dashboard;…
3 Essential Ways to Use Dynamic Parameters in Tableau

Dynamic parameters were introduced with Tableau Desktop version 2020.1 and rightfully created a lot of buzz among Tableau authors due…