Tableau Formatting Series: How to Format Numbers and Dates

This post dives into Display format settings in Tableau, which affect how numbers and dates are displayed on worksheets. These are the only format settings that affect the actual characters shown. The Display formats we will review have two considerations. First, where the text is located, and second the desired appearance. This article will walk you through targeting the exact text you want to modify and explain the custom format syntax for both numbers and dates.
This is the third post in our series on formatting in Tableau. For other applications, see Tableau Formatting Series: How to Use Shading and Backgrounds.
Learn advanced formatting options with Playfair+
Formatting zones
Text location is critical because it determines which menu to use.
Zones
I’m using ‘zone’ to refer to places that can possibly display text, either within a view or outside of it. Zones that can display field values include:
- Worksheet title
- Axis or Header: Continuous (green) pills will have an axis, while discrete (blue) pills will have a header. Both occupy the space outside of the pane.
- Pane: Mark labels are the only text that appears within the pane.
- Tooltips
- Interactives: Legends, filters, etc.
Continue reading with a free account, or login.
Unlock this tutorial and hundreds of other free visual analytics resources from our expert team.
Already have an account? Sign In
By continuing, you agree to our Terms of Use and Privacy Policy.
Formatting menus
Accessing the Display Format window
Getting to the Display format window is surprisingly difficult. It isn’t on the worksheet font or alignment menus with the other text formatting options. The window only appears on format menus that target a specific field or element.
How to Make Custom Menus in Tableau
There are four possible places to edit Display formats:
- Default Properties menu
- Field Format pane
- Format Reference Lines pane
- Edit Parameter window
Most of these are tied to optional elements, so this article focuses on the Default Properties menu and Field Format pane.
![]()
Default Properties menu
The Default Properties settings are a great way to universally modify a field across all worksheets and zones. It can be accessed by right clicking a field in the data pane, hovering over Default Properties, and then selecting Number Format or Date Format. These options are only available for relevant date types.
Field Format pane
Editing Display formats through the Field Formatting Menu is a more nuanced approach. These settings will only be applied to the worksheet you are on and can hold two separate Display formats for different zones. This menu can be accessed by opening the Format pane and then selecting a field from the Fields dropdown in the top right. It can also be accessed through pills in the view.
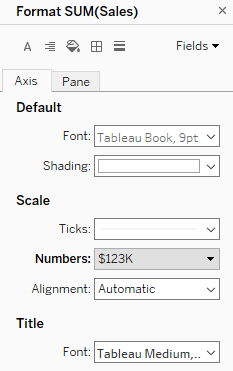
This menu has two modes: Pane, which controls pills on the Marks card; and Axis or Header which controls pills on the Columns and Rows shelves. The Pane setting always controls the Mark label zone, and the Axis or Header setting always controls the Axis and Header zone. All other zones will match the setting relevant to the pill. So, if a pill on the Columns shelf is added to the header, the formatting will be controlled by the Axis or Header formatting settings instead of the Pane settings. When a pill is on both the Marks card and the Row or Column shelves then the Mark label is controlled by the Pane settings while all other zones are controlled by the Axis or Header setting.
It is also possible to display a third format or differentiate two zones controlled by the same setting, but you will need to use another pill. This pill could be the same field with a different aggregation, or with the discrete vs continuous flipped. Another approach is duplicating the field to create a new pill in the Data pane, then adding the new pill to the view and formatting it.
Custom formatting
The Display format menu has a lot of options and is intuitive to use. Because of this we’re skipping straight ahead to custom formatting. You can always set up a format through the standard options and then switch to Custom to see the syntax used to generate it. This is a great starting point for building your own custom Display format.
Numbers
Custom number formatting follows a specific syntax similar to number formatting in Excel. 0 and # characters serve as placeholders for digits, with 0 filling empty spaces with zeros and # leaving empty spaces as-is. Naturally, periods and commas represent decimal places and thousands separators. Adding zeros after a decimal place controls the number of decimal places shown. Commas without digit placeholders to the right will divide by 1000, enabling unit formatting showing thousands, millions, etc. Percentages work similarly. Adding a percent symbol to the format will automatically multiply by 100. To format the number as scientific notation simply add e+. Semicolons work a bit differently than the rest of the syntax characters. Instead of representing characters displayed, they separate formats allowing positive, negative, and zero formats to be displayed differently. Positive formats go first, then a semicolon, then negative, another semicolon, then formatting for zeroes.
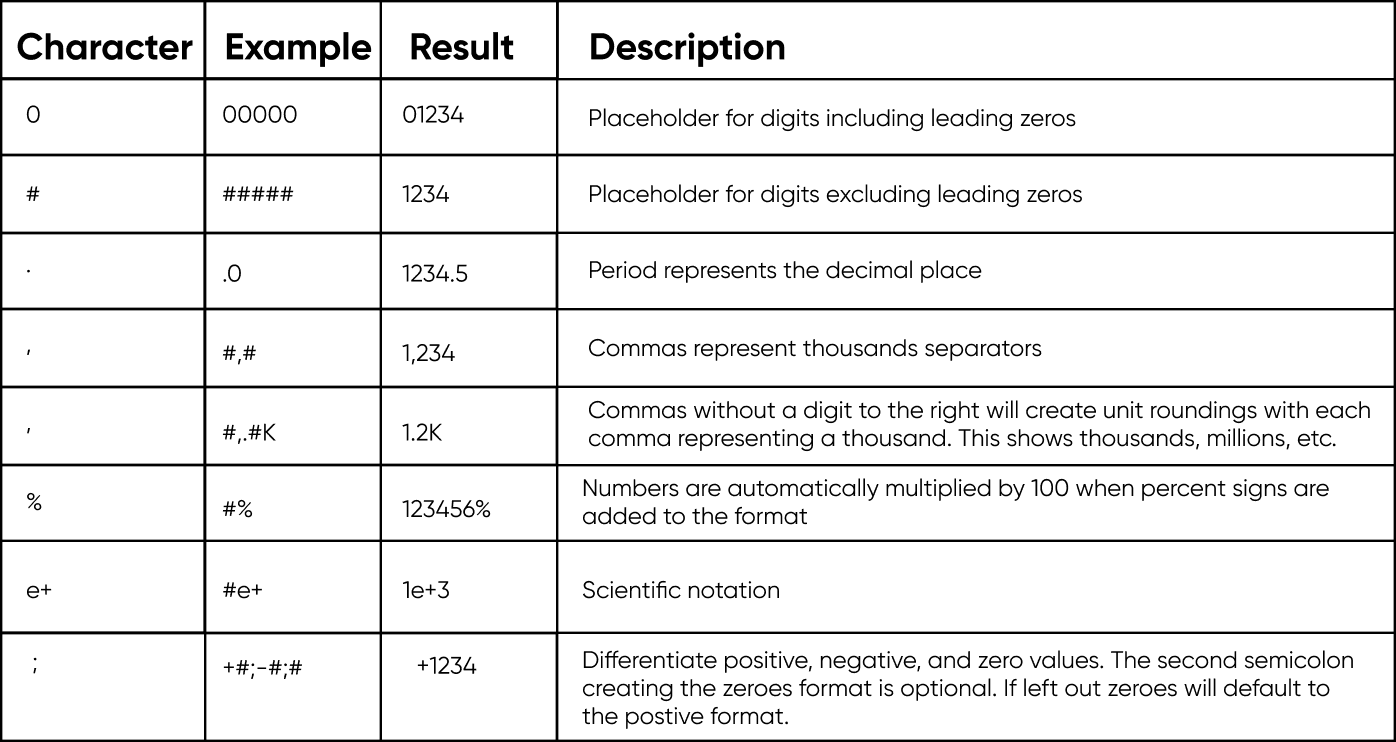
A prefix or suffix can be added to the format by typing it before or after the digit placeholders. This is how currency is displayed, and also custom negative and positive indicators. Characters can even be interspersed with digits, like this syntax for telephone numbers (###) ###-#### . Special characters like arrows can be used in the custom formatting. When using special characters always check them after publishing as some are incompatible with Tableau Server and Tableau Online.
Dates
The syntax for formatting dates in Tableau is better documented. You can see Tableau’s official documentation here: https://help.tableau.com/current/pro/desktop/en-us/dates_custom_date_formats.htm. Generally speaking, each date part is represented by a different character. Most are straightforward, with year, quarter, month, day, hour, and second all starting with their first letter. Because month and minute both begin with m, minute uses n instead of m. If m occurs directly after h, it will show minute instead of month.
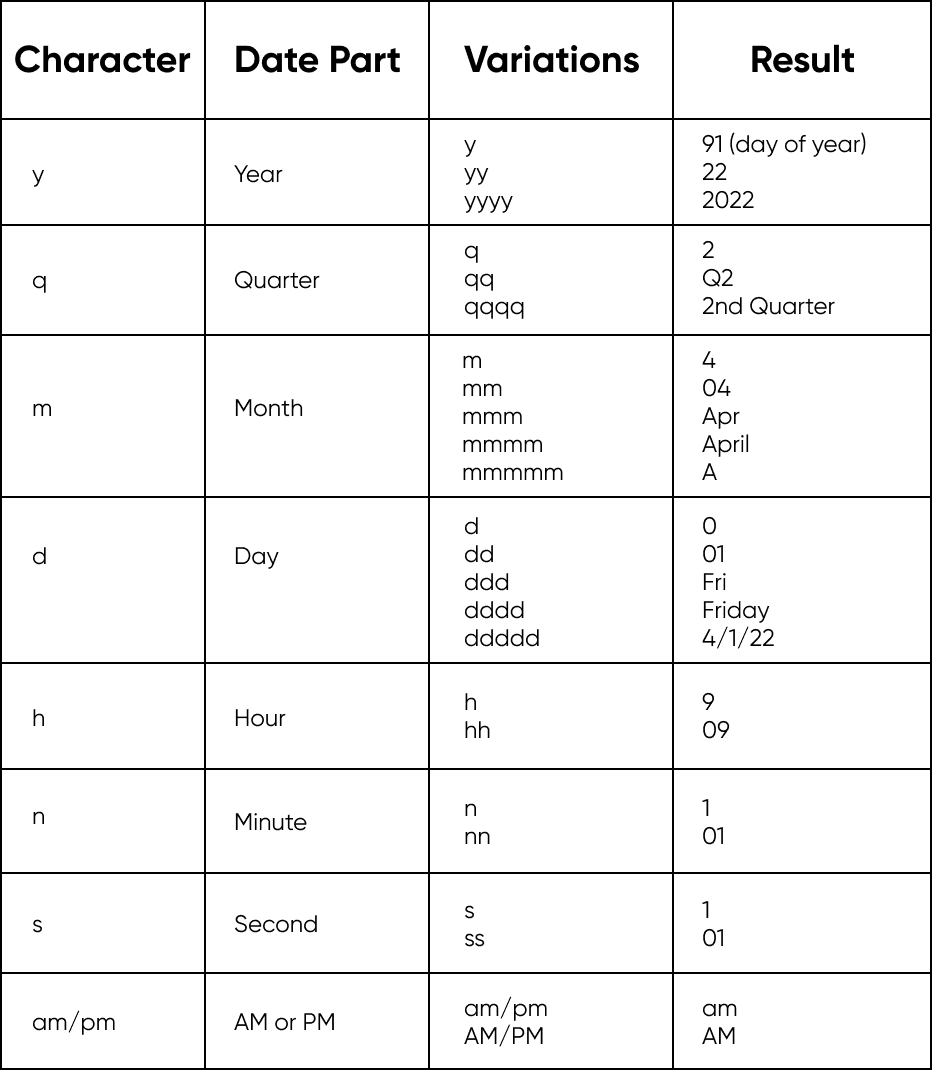
Each date part has multiple formats represented by the number of times the character is repeated. For example, m would show January as 1, mm would be 01, mmm is Jan, mmmm is January, and finally mmmmm is J. Each date part has slightly different options, but they generally follow the same pattern of number, leading zero, then nickname, then full name.
This article focuses solely on stand alone display formatting options. Incorporating calculations allows even more customization, and can take your formatting to another level.
![]()
Applying different formatting across multiple calculations, then displaying one at a time can dynamically change the Display format, font color, or font style in the labels, tooltips, and titles based on the data in the view.
Calculations also allow formatting customization within a field. If you want the Display format to dynamically change from actuals to thousands to millions based on the data shown this tutorial can show you how:
How to Automatically Change Number Units in Tableau
To recap, access the Display format window through the Field Formatting Menu, either by selecting that field in the dropdown on the format pane or through the pill in the view. Use the Axis or Header option to control pills on the Columns or Rows shelf, and the Pane option to control pills on the Marks card or Mark labels. To add more display formats, modify the pill or duplicate the field and format the resulting pill in the new style. If you aren’t able to achieve the desired display format through the standard options, you can design a Custom display format. The simplest approach is to get as close as possible with the standard options, then switch to Custom and modify the syntax.
– Felicia


Written By
Felicia Styer

Peer Review
Dan Bunker
Manager, Decision Engineering
Graphic Design
Dan Bunker
Manager, Decision Engineering
Related Content
Tableau Formatting Series: How to Use Lines and Borders
There are two distinct types of line formatting in Tableau, Lines and Borders. Lines are tied to an axis and…
Tableau Formatting Series: How to Use Shading & Backgrounds
There are two approaches to changing surface color in Tableau; shading and background. While they have the same function, the…

Ryan Sleeper
Dynamically update display units from K, to M, to B By default, number formatting in Tableau is all or nothing…