Tableau Formatting Series: How to Use Lines and Borders

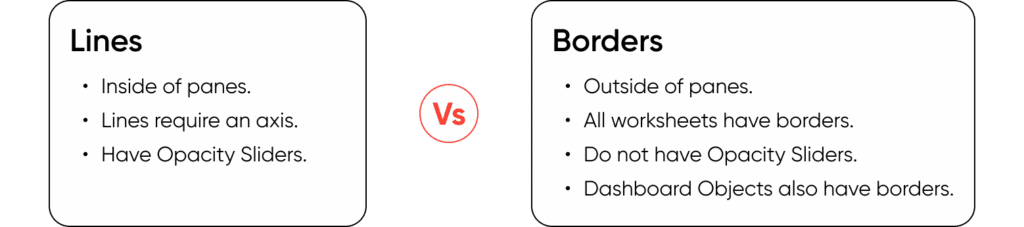
There are two distinct types of line formatting in Tableau, Lines and Borders. Lines are tied to an axis and are related to values in a chart. Borders provide spatial separation on worksheets and dashboards, denoting dashboard regions and visually dividing or grouping rows and columns.
This is the second post in our series on formatting in Tableau. For other applications, see Tableau Formatting Series: How to Use Shading and Backgrounds.
![]()
Learn more formatting tips with Playfair+
Nuanced control of lines and borders can guide the user experience. Gridlines can be added to a worksheet to help the user estimate values. Alternatively, lines can be removed from a labeled view to increase the data-ink ratio. Similarly, removing borders from a view helps the user focus on the data and draw insights. Unless the border aids comprehension, providing a guide to a long row of values, denoting totals, or visually grouping sections. A good rule of thumb is to start with no lines, and intentionally add them one by one. Carefully consider how subtle or bold the line should be for the function it serves.
How to use ‘worksheet lines’ in Tableau
Lines will only exist on worksheets with at least one axis. This is the only requirement for gridlines, zero lines, axis rulers, and axis ticks. A Reference Line, Trend Line, or Drop Line has to be intentionally added to the worksheet through the Analytics pane, Analysis menu, or by right-clicking the view.
Continue reading with a free account, or login.
Unlock this tutorial and hundreds of other free visual analytics resources from our expert team.
Already have an account? Sign In
By continuing, you agree to our Terms of Use and Privacy Policy.
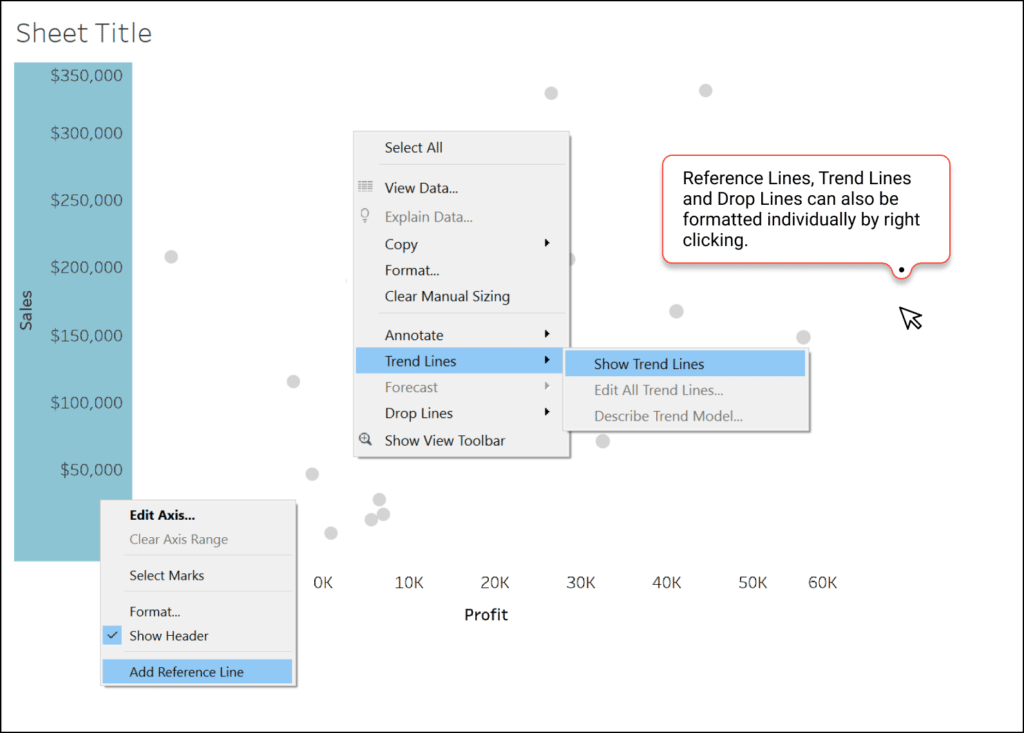
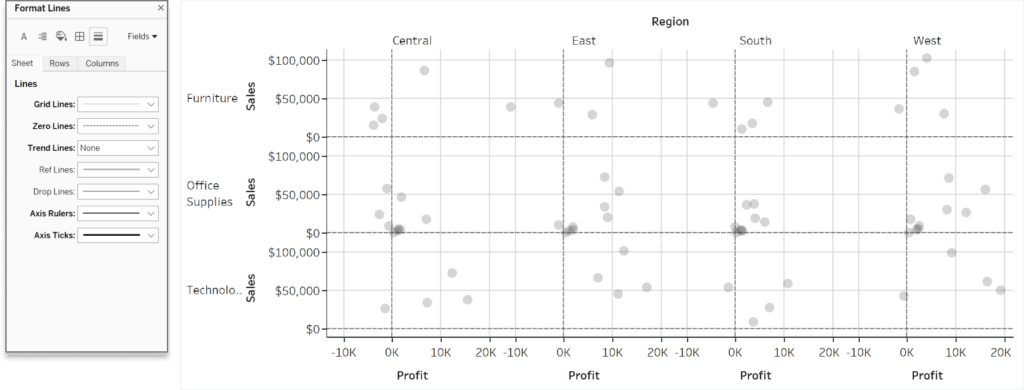
Access the line formatting options by opening the Format menu and selecting Lines. Reference lines, trend lines, and drop Lines can be formatted individually by right-clicking and selecting Format.
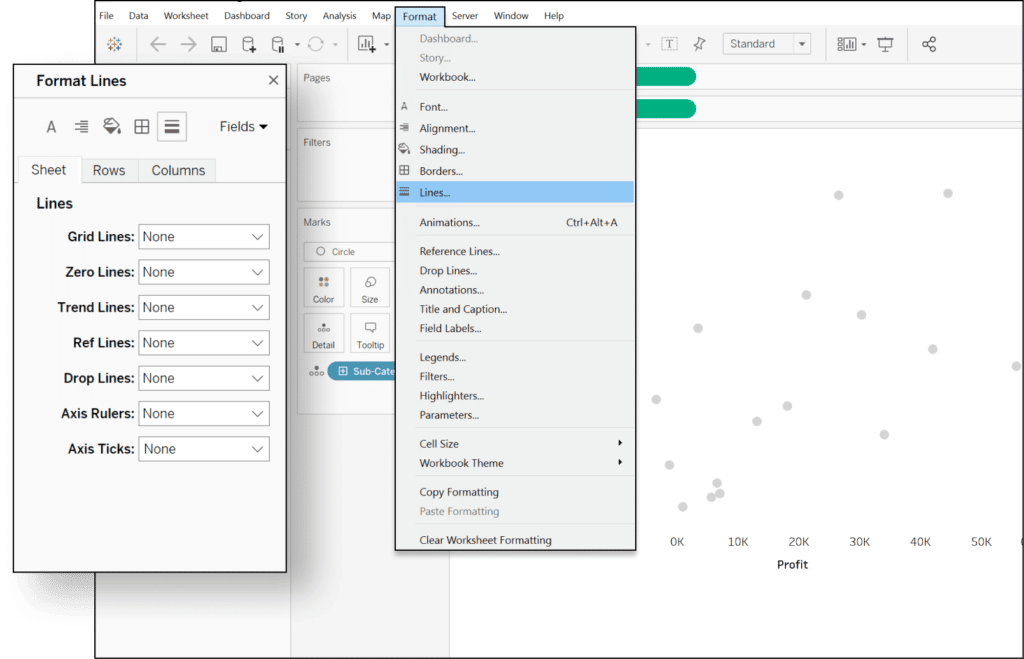
The Format pane has three options: Sheet, Rows, and Columns. If a line is adjusted in the Row or Column menu, the Sheet menu will not show the change. If you are looking for an errant line you’ll need to check each setting.
Lines only exist within sub panes and axes.
How to use ‘worksheet borders’ in Tableau
Borders will divide sub panes but never enter them.
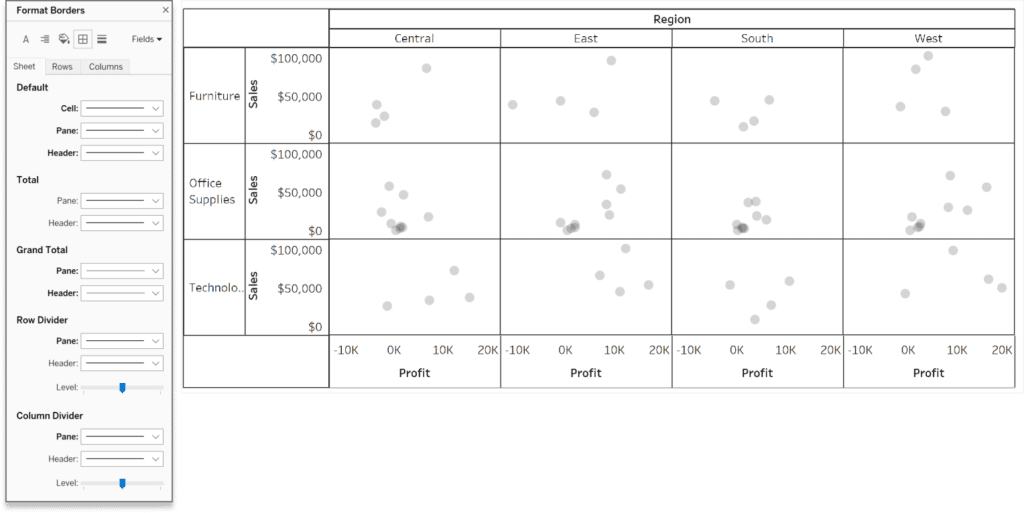
Even the simplest worksheet can have a border. Access the border formatting options by opening the Format menu and selecting Borders.
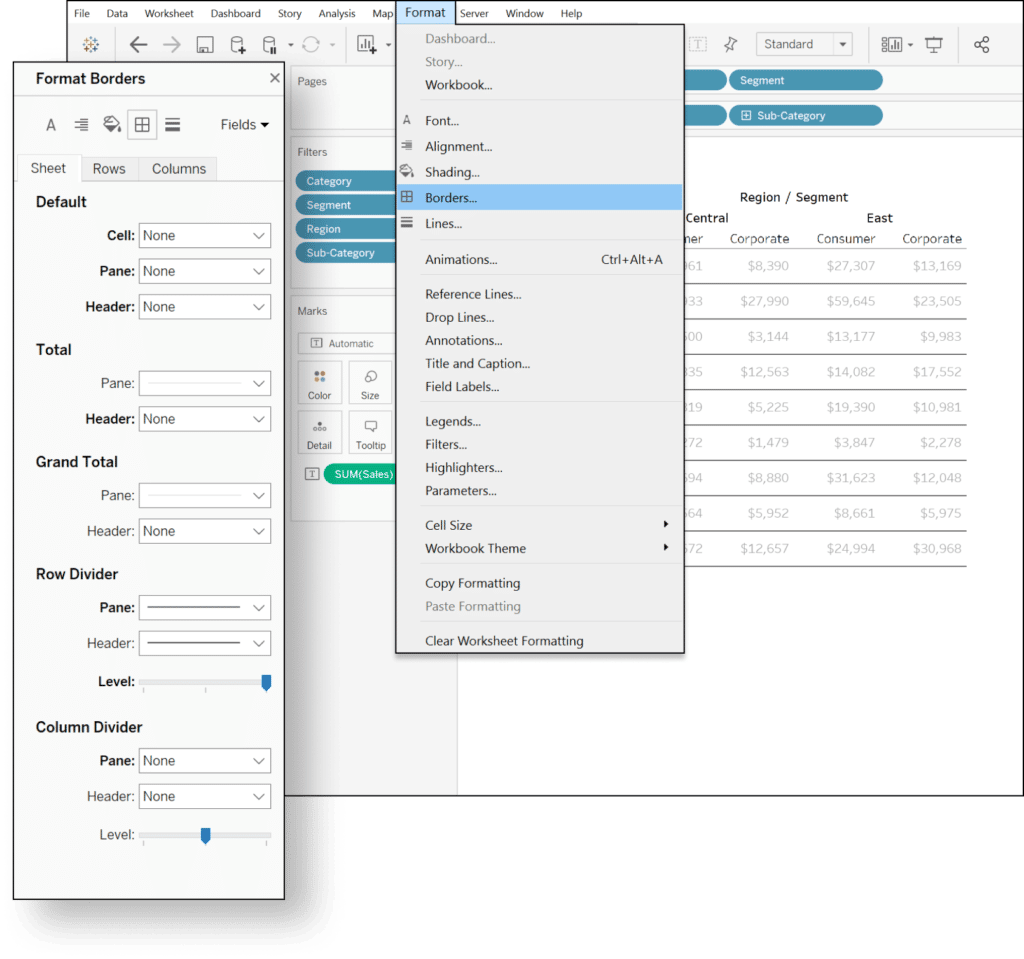
Just like lines, when a border is adjusted in the Row or Column menu, the Sheet menu will not show the change. If you are looking for an errant border, you’ll need to check each setting.
My most commonly used border settings are Row Divider and Column Divider. Tableau defaults to include dividers for every dimension, but I reduce the number of dividers or eliminate them completely on most worksheets.
![]()
How to use ‘dashboard borders’ in Tableau
When a worksheet is added to a dashboard it can add a layout border. This border outlines the entire sheet. A border can be added to any dashboard object using the Layout pane.
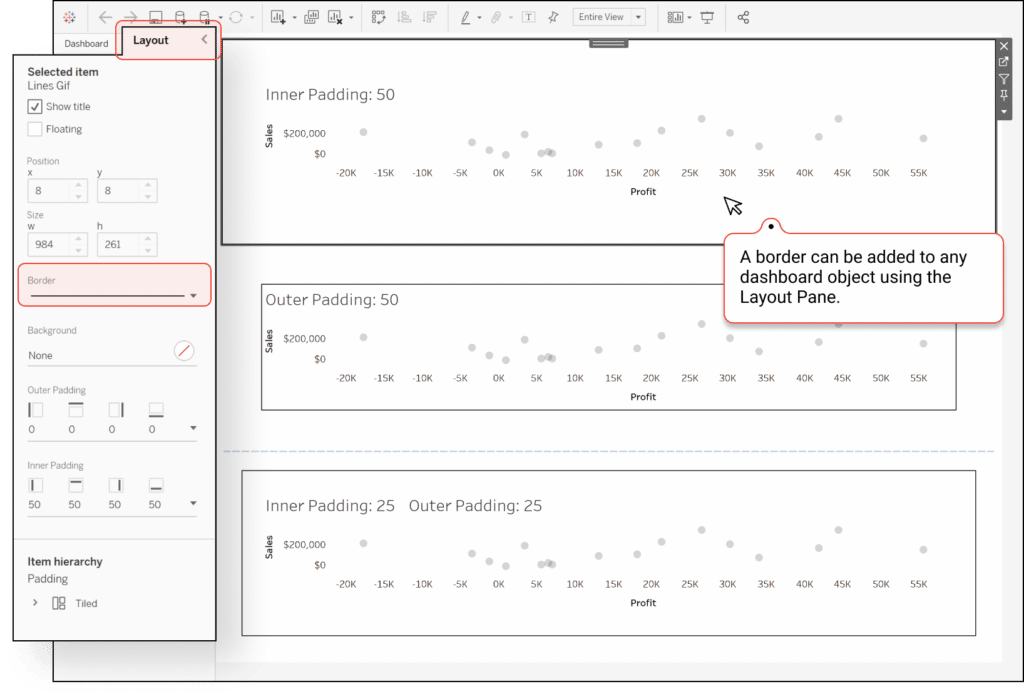
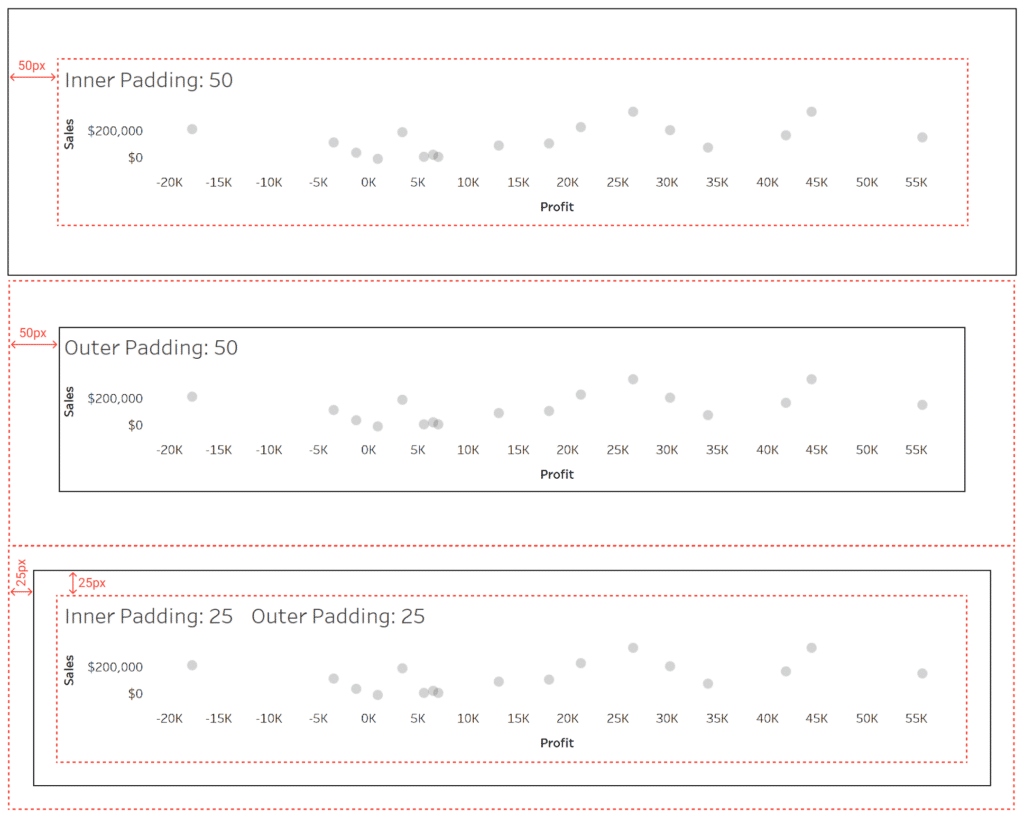
The border appears between the inner and outer padding of the object. You can increase the white space outside of the border by increasing the outer padding. To increase the white space between the border and its contents increase the inner padding.
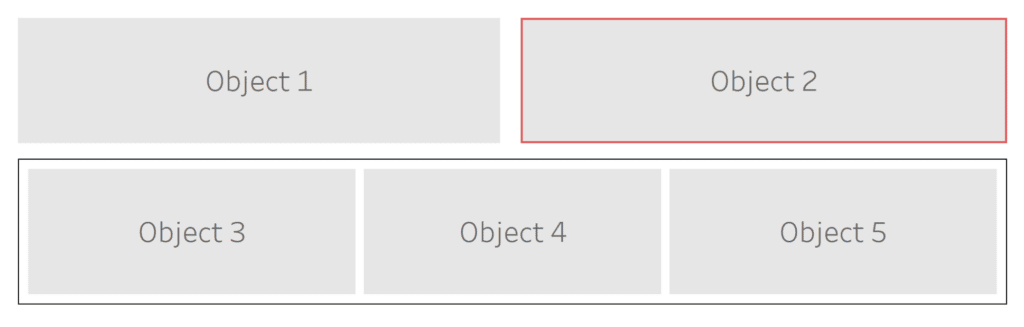
These borders can be used to add emphasis, separation, or group objects.
To recap, Lines only exist on worksheets with at least one axis. A Reference Line, Trend Line, or Drop Line must be intentionally added and can be individually modified. Borders surround worksheet panes but never enter sub panes. A Layout Border can be added to any dashboard object, and the white space around them can be controlled by modifying the padding settings. Intentional line choice aids dashboard functionality, helping your end user draw conclusions faster with more accuracy.
– Felicia


Written By
Felicia Styer

Peer Review
Dan Bunker
Manager, Decision Engineering

Graphic Design
Rafael Simancas
Sr. Manager, Brand Strategy
Related Content
Introducing Balance Scale Charts in Tableau
The “Balance Scale chart” came to life during a team brainstorming session while building the Financial Analysis Swift as we…

Ryan Sleeper
3 ways to take command of Tableau number formatting Learn how to (1) easily format positive and negative changes with…
3 Innovative Ways to Use Tableau Scaffolding

If you have been working with Tableau for any length of time, you have probably come across tutorials utilizing the…