Tableau Fundamentals: An Introduction to Level of Detail Expressions
Tableau level of detail expressions allow you to change the most granular place where an analysis takes place. An analysis, such as AVG(Sales) by State includes the dimension that you are slicing the dicing the measure by as well as the aggregation of the measure. Prior to Tableau version 9.0, and without some clever technical hacking such as duplicating a data source or leveraging table calculations, you were stuck using the same level of detail for an entire view. Now that you can alter the level of detail for specific measures, you can compare and contrast numbers at different granularities within the same chart.
With level of detail expressions in Tableau, you can now compute things such AVG(Sales) by State minus AVG(Sales) for the entire dataset to see how the sales per state compare to the overall average.
This unlocks a great deal of flexibility in your analyses because you can explicitly define the level of detail for different numbers in your view. Here are just 15 of limitless ways to take advantage of Tableau LOD expressions. I will also share a couple of resources that show you how I’ve used level of detail in my own Tableau workbooks at the end of this post, but this post mainly serves as an introduction to what level of detail is and the syntax needed to control it.
An Introduction to Tableau Level of Detail Expressions
Continue reading with a free account, or login.
Unlock this tutorial and hundreds of other free visual analytics resources from our expert team.
Already have an account? Sign In
By continuing, you agree to our Terms of Use and Privacy Policy.
An introduction to Tableau level of detail expressions
Earlier in the Tableau 201 series, we introduced the idea of level of detail and how you can make a visualization more granular by adding dimensions to the Detail Marks Card. Here is another example to help illustrate what a Tableau visualization’s level of detail is:
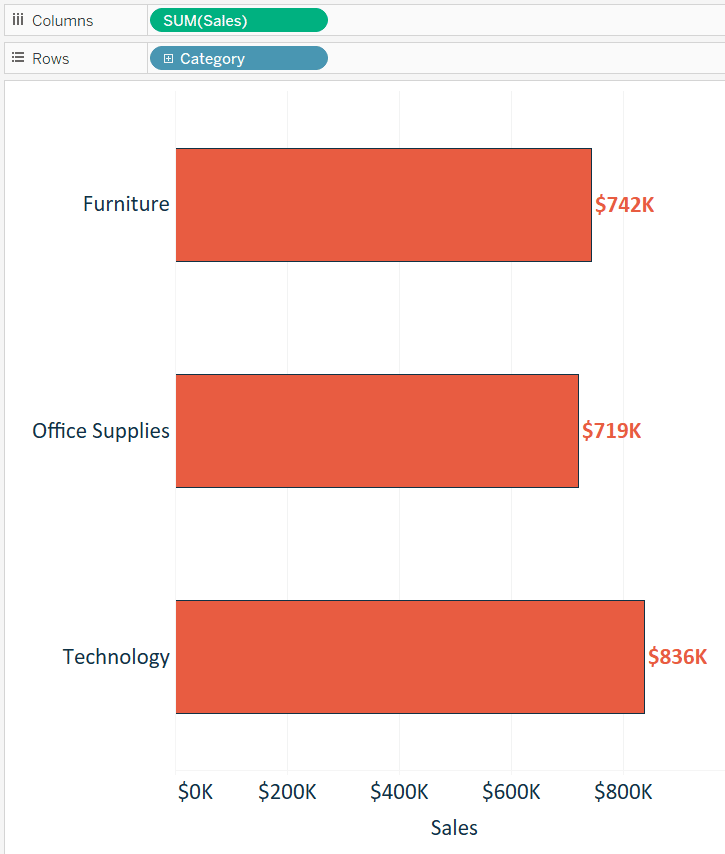
In this simple, Sales by Category bar chart from the Sample – Superstore dataset, the most granular level of detail in the analysis is Category. Since we are only slicing and dicing the Sales measure by the Category dimension, there are only three marks; one for each category. We could make this analysis more granular by adding an additional dimension to the view. Here’s what the bar chart looks like if I add the Sub-Category dimension to the Rows Shelf:
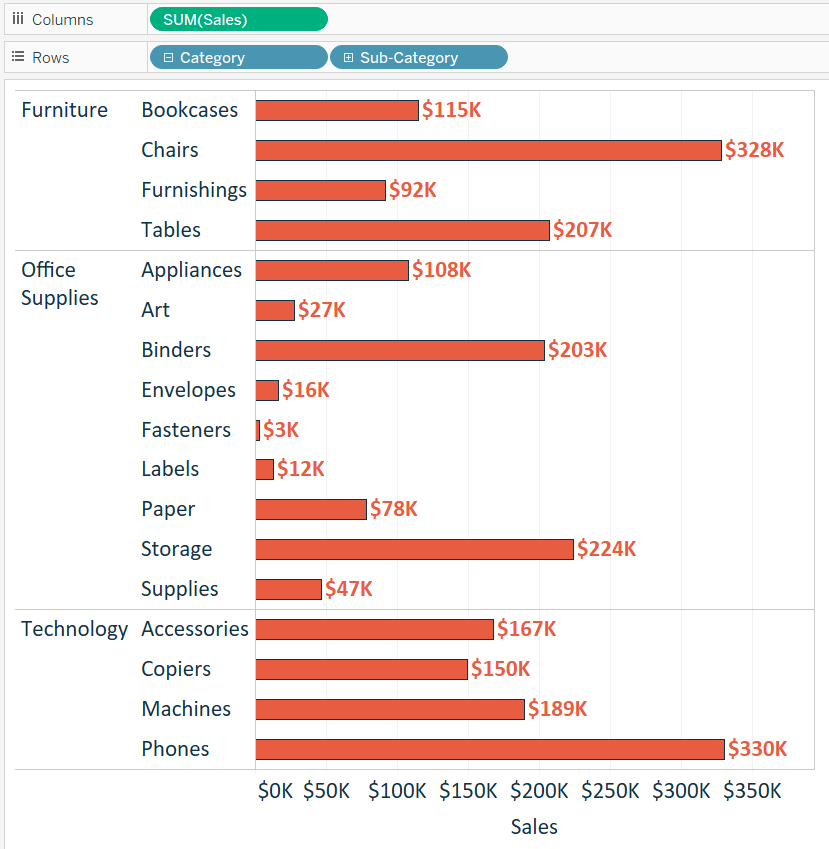
We are now slicing and dicing the Sales Measure by both the Category and Sub-Category dimensions. We have changed the level of detail for this view and made our analysis more granular.
But what if we wanted to look at it both ways? Perhaps we want to show the sales per sub-category in one column, the sales per category in a second column, and even divide the two by each other to determine how much each sub-category is contributing to their respective category.
That’s where Tableau’s level of detail expressions come in. Level of detail expressions have their very own syntax in Tableau, which looks like this:
– An open curly bracket “{“
– Followed by one of three level of detail expressions: FIXED, INCLUDE, or EXCLUDE
– Followed by zero or more dimensions you want to be fixed, included, or excluded from the computation
– Followed by a colon “:”
– Followed by an aggregated measure
– Followed by a closing curly bracket “}”
The three level of detail expressions, FIXED, INCLUDE, and EXCLUDE, are fairly intuitive names for what they’re going to do (i.e. fix the measure at a certain level of detail, include dimensions that are not on the view, or exclude dimensions that are on the view). As with many things in Tableau, there are multiple ways to get to the same answer, and there is not always a “best” way to go about a certain solution.
![]()
Your level of detail expressions may take some experimenting to get the result you want, but I have found the EXCLUDE expression to align best with the way I think about aggregations. The reason this works well for me is because I can make a view as granular as I’d like as I normally would, then “back out” to a comparison metric by excluding certain levels of granularity.
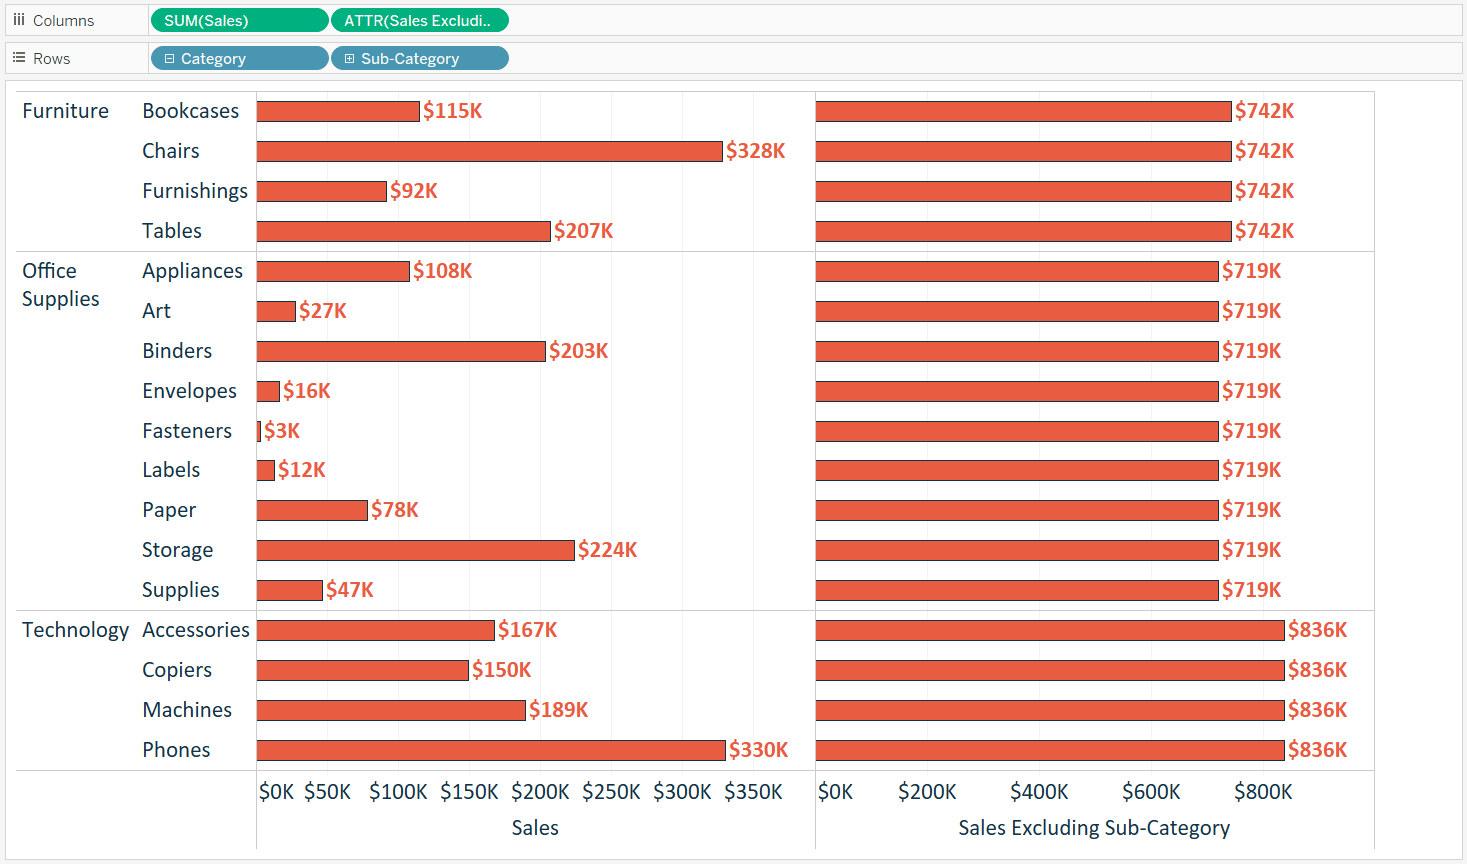
Take another quick look back at the last bar chart. I’ve made the analysis as granular as I’d like, slicing and dicing the Sales measure by the Category and Sub-Category dimensions. If I wanted to compare each row by the Sales at the Category level only, so excluding the Sub-Category dimension, I would create a calculated field with this formula:
{EXCLUDE [Sub-Category]: SUM([Sales])}
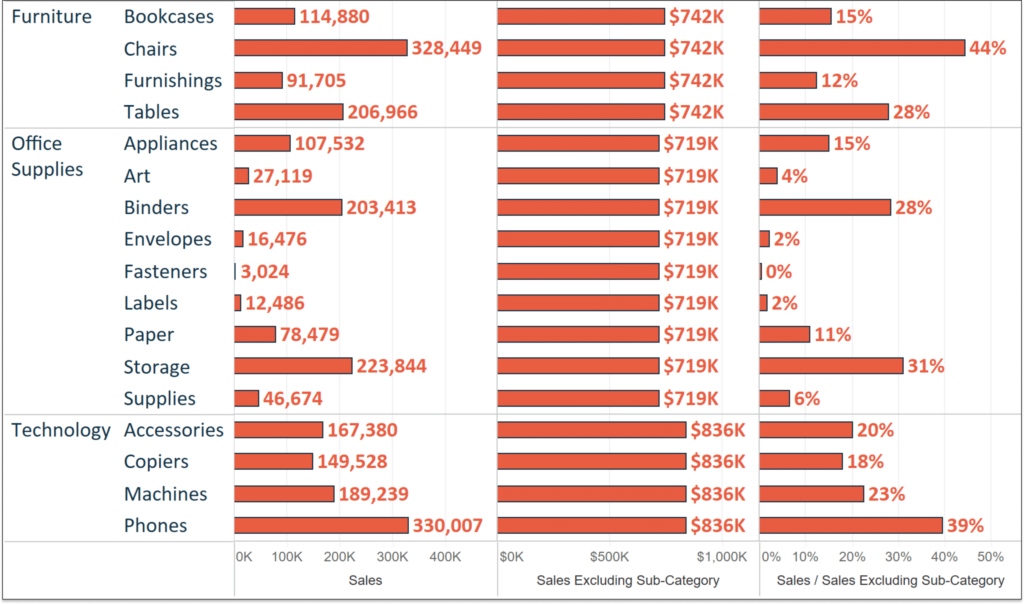
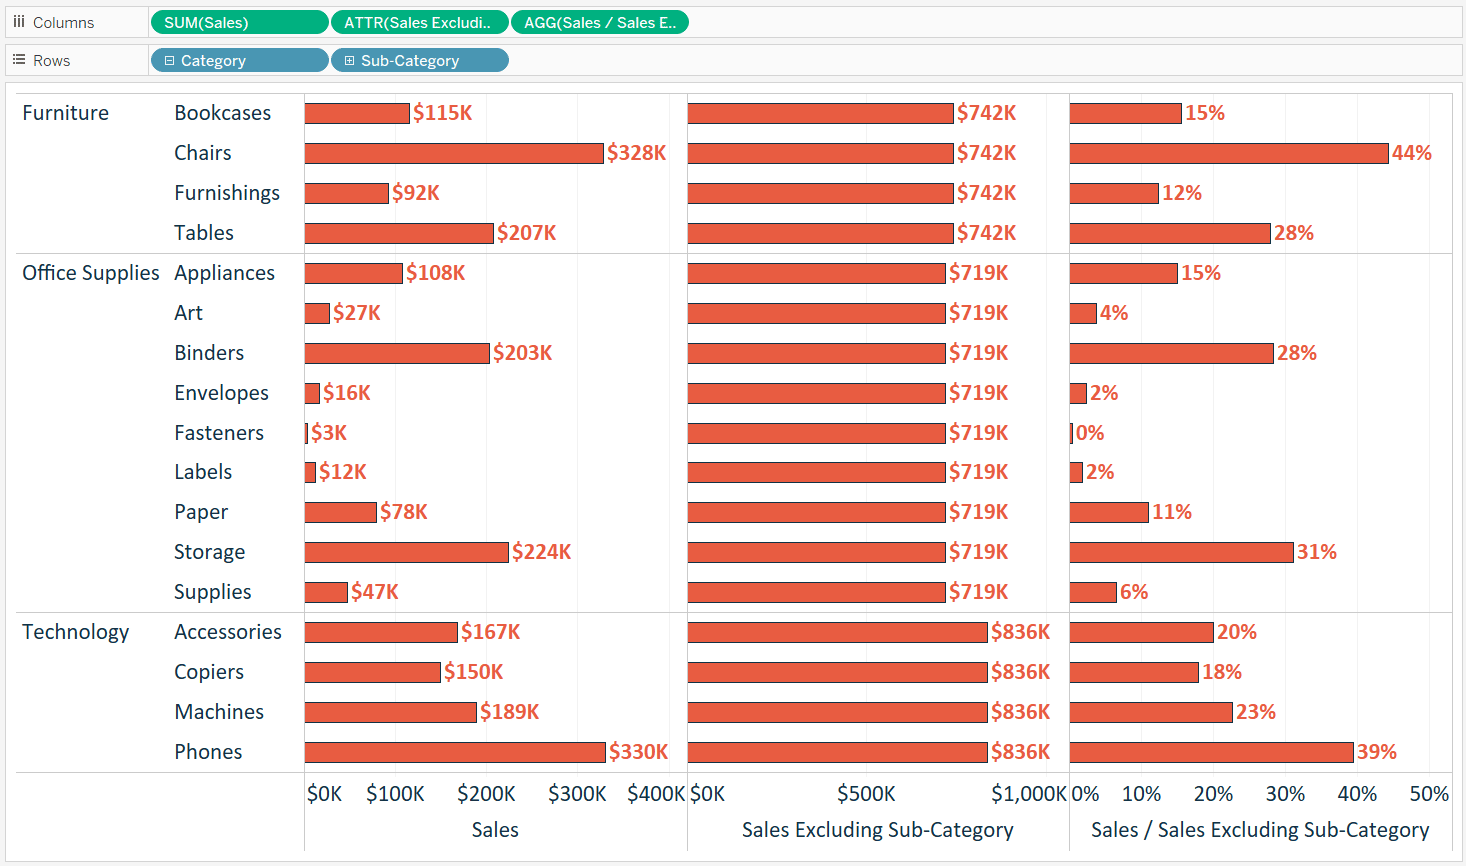
Now when I add my new calculation to the Columns Shelf, the left side shows my original analysis, while the right side “backs out” the level of detail to the Category level, excluding the Sub-Category dimension:
We’re now displaying two different levels of detail on one view! This new measure can now be used for further analysis. If I wanted to calculate the contribution of each sub-category to its respective category, I could create another calculated field that divides SUM(Sales) by the newly created SUM(Sales Excluding Sub-Category):
This third column could have been computed using a Tableau table calculation that took the percent of total per pane, but using level of detail expressions provide several benefits including:
– You can “show your math”; in the example above, we would not have been able to show the first and second column together without LOD expressions. You could have also used a different table calculation called WINDOW_SUM, but with LOD expressions…
– You no longer need to worry about setting and maintaining the direction and scope of a table calculation; set the level of detail once in the LOD calculation and don’t worry about it again
– You can definitely get creative with table calculations in Tableau, but LOD calculations are even more flexible, allowing you to specify the precise level of detail and aggregation for a measure
![]()
We have barely scratched the surface on arguably the most powerful feature to ship with Tableau version 9, but this example should have provided a good foundation about what level of detail is and how it can be changed to benefit your analysis. For a more in-depth breakdown of why this functionality is useful, you may benefit from watching, How to Use LOD Expressions to Create Benchmarks, on the advanced track on Playfair+.
Thanks for reading,
– Ryan
This content is excerpted from my book Practical Tableau: 100 Tips, Tutorials, and Strategies from a Tableau Zen Master published by O’Reilly Media Inc., 2018, ISBN: 978-1491977316. Get the book at Amazon.


Written By
Ryan Sleeper
Related Content

Ryan Sleeper
Harness the power of level of detail calculations to create comparisons Learn how to use the FIXED and EXCLUDE level…
Bringing Tables Together: Tableau’s Physical Layer

Welcome to our series on bringing tables together! This first article is all about the physical layer in Tableau, including…
Ryan Sleeper
Learn the two types of ‘Basic’ calculated fields in Tableau This video shows you how to create new fields from…