The Beginner’s Guide to Basic Tableau Calculated Fields

At Playfair Data, we call calculated fields one of the “Big 3” – the three technical features that unlock the most flexibility in Tableau. Calculated fields are one of the most useful features in all of Tableau and you may use them every single day, but did you know there are actually three types of calculated fields?
This tutorial will provide you with an understanding of the first type of calculated field, and perhaps most commonly used, which we call “basic” calculated fields. Basic calculations can be grouped into two main categories, “row-level calculations” and “aggregate calculations”. The difference between these two is defined in their names. The row-level calculation computes at the row-level of the underlying data whereas the aggregate calculation computes at the visualization level of detail to combine several rows of data into single values.
Once you have a foundational understanding of these basic calculations, I will then provide you with the resources you need to advance the complexity of your calculations by learning about the second and third types of calculated fields – table calculations and level of detail calculations. These provide more advanced control over data granularity and create quick computations within the flow of your analysis.
Watch the related video with Playfair+
Basic row-level calculations
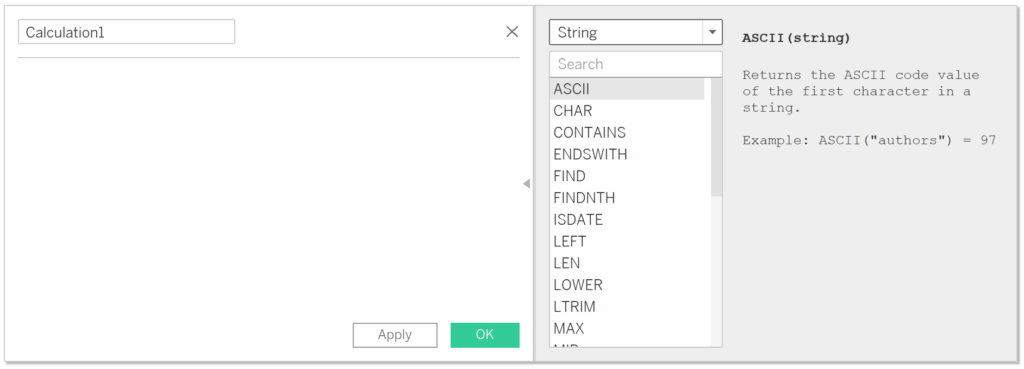
The first type of basic calculated field uses functions that compute at the row-level of the underlying data. There are many of these functions available in Tableau, but we will only cover “SPLIT()” to help you understand how row-level calculations behave. However, to get the full list of string, row-level functions available in Tableau, you can open the calculation window, select the arrow on the right-hand side, and filter the functions to “String”.
Continue reading with a free account, or login.
Unlock this tutorial and hundreds of other free visual analytics resources from our expert team.
Already have an account? Sign In
By continuing, you agree to our Terms of Use and Privacy Policy.
Let’s start with an example using the Sample-Superstore dataset and placing the “Customer Name” dimension on the Rows shelf. You will notice that every row contains a unique customer’s first and last name. But if instead, we only wanted customer last names, then we could create a “Last Name” calculation using the SPLIT() function which allows us to isolate the last name for each row in the data. To demonstrate, create a new calculation, name it “Last Name”, and the logic is as follows:
SPLIT([Customer Name], ‘ ‘, 2)
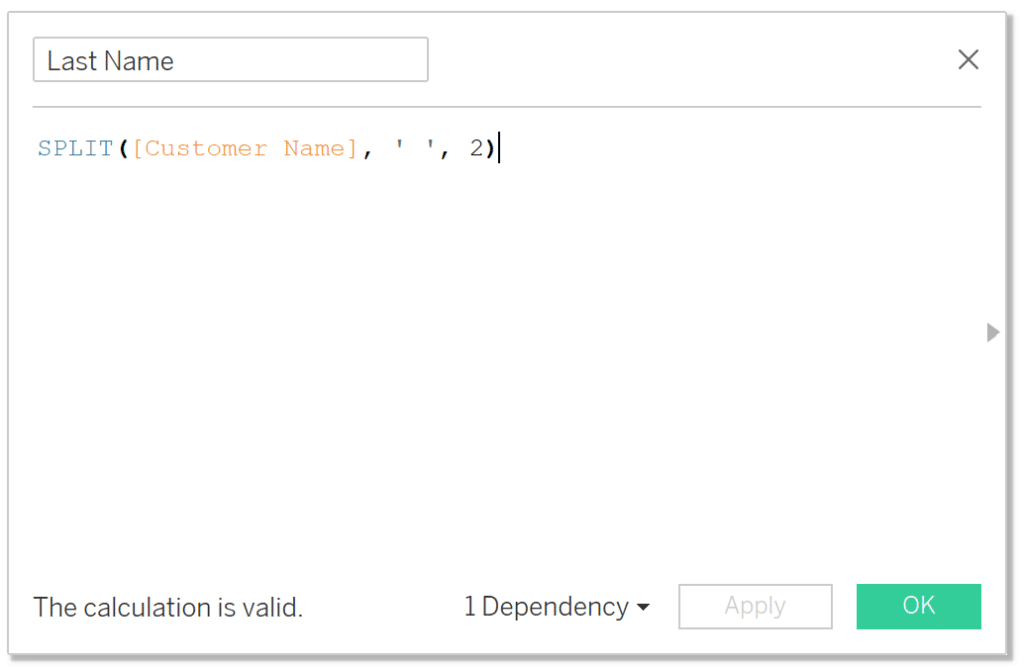
This calculation separates, or splits, every customer name (as defined by [Customer Name]) at the space between the first and last name (as defined by the delimiter ‘ ‘) and will return the second piece of the string (as defined by the number 2) – that being the last name. When we add this new “Last Name” calculation to the view, it should look like the screenshot below.
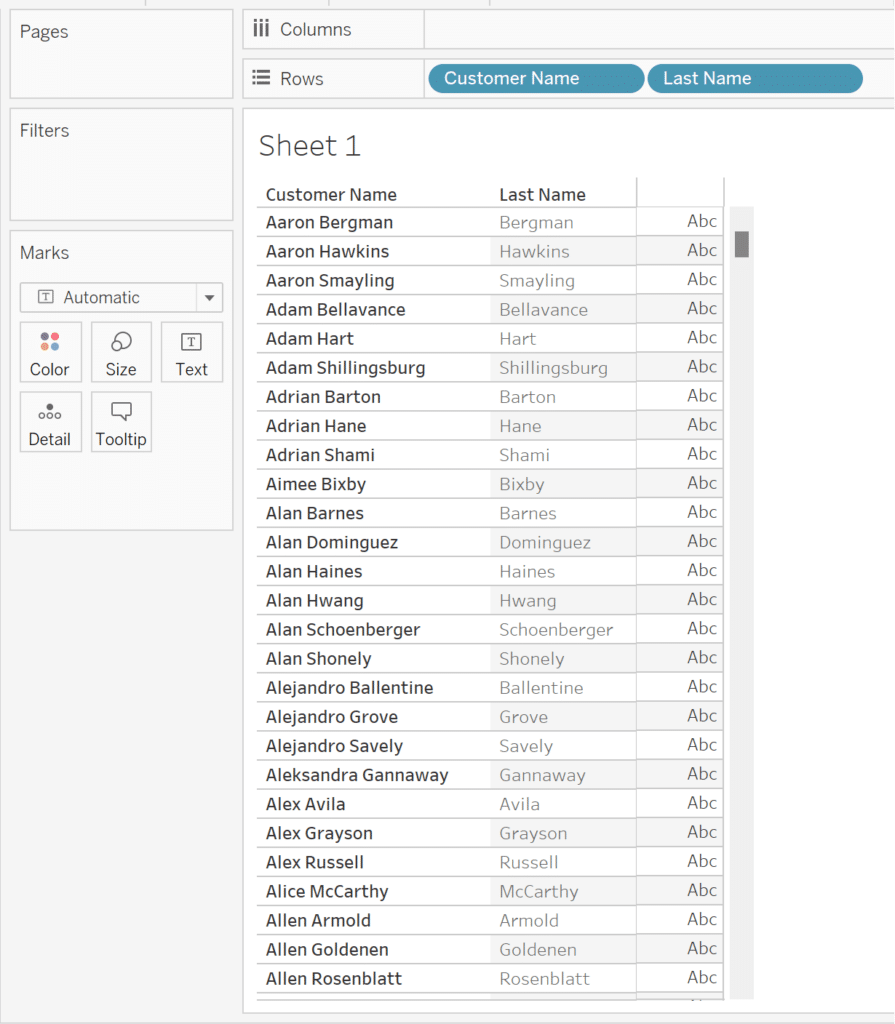
As you can see, the calculation returned the last name for every row in the data for Customer Name. This is just a basic example of a row-level calculation, but reality is typically messier. For example, your data could contain middle names which would cause problems for this simple calculation. The solution to a problem such as that would require more complex calculations, but for the sake of this tutorial, we will not get any more complex than guiding you through the behavior of the basic row-level calculation.
An Introduction to String Calculations in Tableau
Basic aggregate calculations
The second type of basic calculation is an aggregation which combines and summarizes multiple data points into a single value to provide a concise and meaningful representation of the underlying data. This is the type of calculation that most analysts think of when they are creating Tableau calculated fields. Aggregate functions such as SUM, AVG, MIN, MAX, COUNT, and COUNTD play a crucial role in extracting meaningful insights from your data within the context of your visualization and its level of detail.
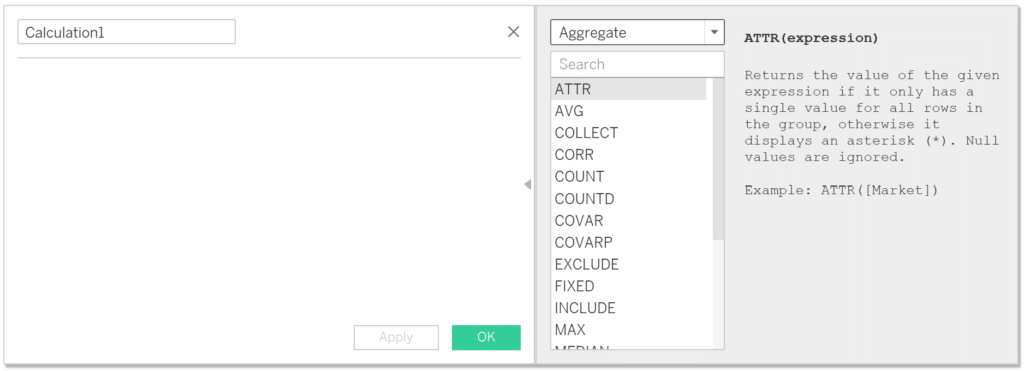
To get the full list of aggregate functions available in Tableau, you can open the calculation window, select the arrow on the right-hand side, and filter the functions to “Aggregate”.
Basic aggregate functions in Tableau calculated fields behave exactly as they are named – for example, SUM() uses addition, AVG() takes the average, etc. These calculations are performed across all rows for each mark in the view. In other words, each bar in our bar chart, dot in our scatter plot, or row in our table is a mark. These marks represent multiple rows of data. Aggregations are performed separately for each mark, using the values from each row represented by the mark.
![]()
SUM
Perhaps the most basic and commonly used aggregate function used in all visual analytics is the SUM() function. This function allows the user to add, or sum, the values of the specified measure. For example, if the sales for Office Supplies were $5, $10, $15, and $20; then the SUM(Sales) across all four orders equals $50 ($5 + $10 + $15 + $20).
AVG
The AVG() function takes the average of the values of the specified measure for each mark in the view, unless otherwise specified with a level of detail calculation or table calculation. For example, if the sales for Office Supplies were $5, $10, $15, and $20; then the AVG(Sales) across all four orders equals $12.5 ($5 + $10 + $15 + $20)/4.
MIN
The MIN() function returns the minimum value of the specified measure for each mark in the view. For example, if the sales orders for Office Supplies were $5, $10, $15, and $20; the MIN(Sales) equals $5.
MAX
The MAX() function returns the maximum value of the specified measure for each mark in the view. For example, if the sales orders for Office Supplies were $5, $15, $10, and $20; the MAX(Sales) equals $20.
COUNT
The COUNT() function returns the number of non-null records for each mark in the view. For example, if there are four sales orders for Office Supplies, four orders for Technology, two orders for Furniture, and one null order then the COUNT(Category) equals 10 because there are ten non-null records in the view.
COUNTD
The COUNTD() function returns the number of unique non-null values of the specified dimension. For example, if there are four sales orders for Office Supplies, four orders for Technology, two orders for Furniture, and one null order then the COUNTD(Category) equals 3 because there are three unique non-null categories – Office Supplies, Technology, and Furniture.
ATTR
This last one is a special Tableau function that technically counts a type of aggregation. The ATTR() function is used to return the single aggregated value of a dimension when there is only one distinct value for that dimension in the specified context. The name “ATTR” stands for “Attribute”. When multiple values would be returned, ATTR() will display a * instead.
Mathematical order of operations is critical for Tableau calculated fields
While Tableau has its own order of operations which determines what aspects of a visualization are processed in what order, the traditional mathematical order of operations that you likely learned in grade school are also critical for aggregate calculated fields. You might remember the acronym PEMDAS:
P: Parentheses: operations are performed inside parentheses first. If there are nested parentheses, start with the innermost.
E: Exponents: evaluate expressions involving exponents or powers. This includes square roots, cube roots, etc.
MD: Multiplication and Division: these operations have the same priority and should be executed in the order they appear.
AS: Addition and Subtraction: similar to multiplication and division, these operations have the same priority and should be executed in the order they appear.
It’s important to note that within multiplication/division and addition/subtraction, the operations should be performed from left to right as they appear in the expression. Failure to follow the order of operations can lead to incorrect results.
As an example, let’s say we needed to calculate operating profit margin by using the formula: revenue minus expenses divided by revenue. At first glance, it would be tempting to write the Tableau calculated field as [Revenue] – [Expenses] / [Revenue], but when we consider the rules of data aggregation and math’s order of operations, we understand that we must be very careful.
The proper way of writing the profit ratio calculation would be SUM([Revenue] – [Expenses]) / SUM([Revenue). The sum of revenue subtracts the sum of expenses, resulting in the sum of profit. The sum of profit then gets divided by the sum of revenue, thereby giving us the overall operating profit margin.
So, when the operations are inside the parentheses, rows are first aggregated, then the operation is performed on the aggregated values. When the operation is outside the parentheses, the operation is performed on each individual row, then aggregated when the calculation is brought into the view.
Because the division in this example is outside the parentheses it is important that the numerator and denominator get aggregated prior to the division operation. Otherwise, the result would be row level profit ratios that get summed up when brought into the view which isn’t the same thing as getting the overall profit ratio.
Combining aggregate and non-aggregate fields
As Tableau calculated fields progress in complexity there are more potential brainteasers for the Tableau engineer. If just one aggregated field is used – everything used in the Tableau calculated field must be aggregated.
For example, to calculate revenue per unique order it must be written as COUNTD([Order]) / SUM([Revenue]), not written as [Order] / SUM([Revenue]). Trying to combine the non-aggregated [Order] with the aggregated SUM([Revenue]) will result in an error.
Similarly, writing IF THEN calculations with aggregations can get tricky when combining dimensions, measures, and dates because again, all fields used in the calculation must be in aggregate form. For example, if I need to calculate sales for the North region, then it would seem logical to write the calculation as:
IF [Region] = ‘North’ THEN SUM(Sales) END
But this will result in an error that reads “Cannot mix aggregate and non-aggregate arguments with this function.” because sales are aggregated but region is not. Therefore, the IF THEN calculation could resemble either of the following syntax to result in a valid Tableau calculation:
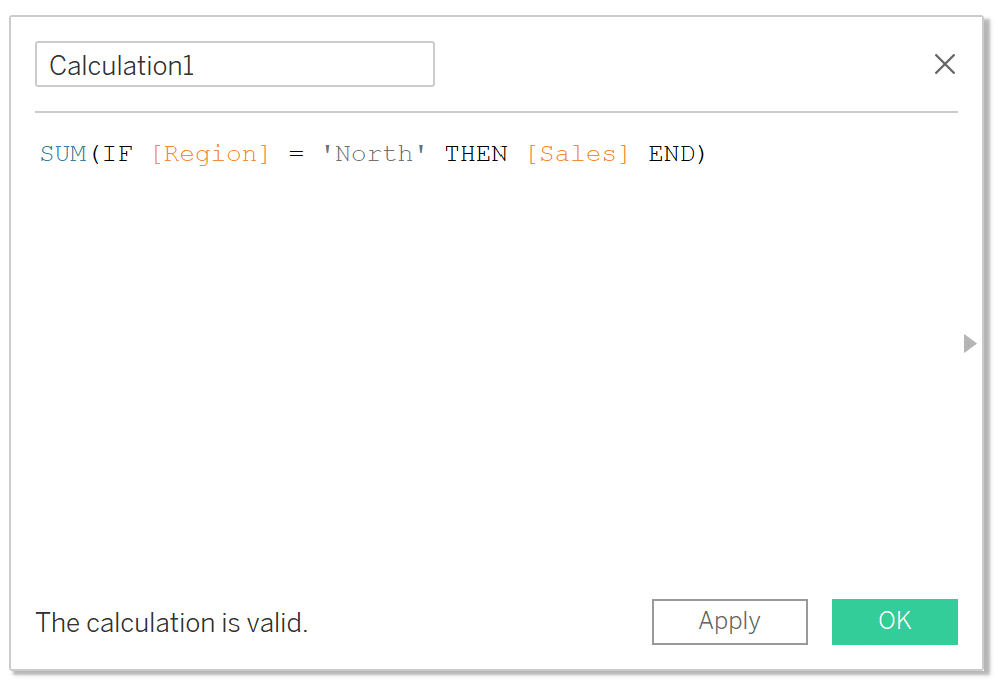
1. Wrap the entire statement in the aggregate function:
SUM(IF [Region] = ‘North’ THEN [Sales] END)
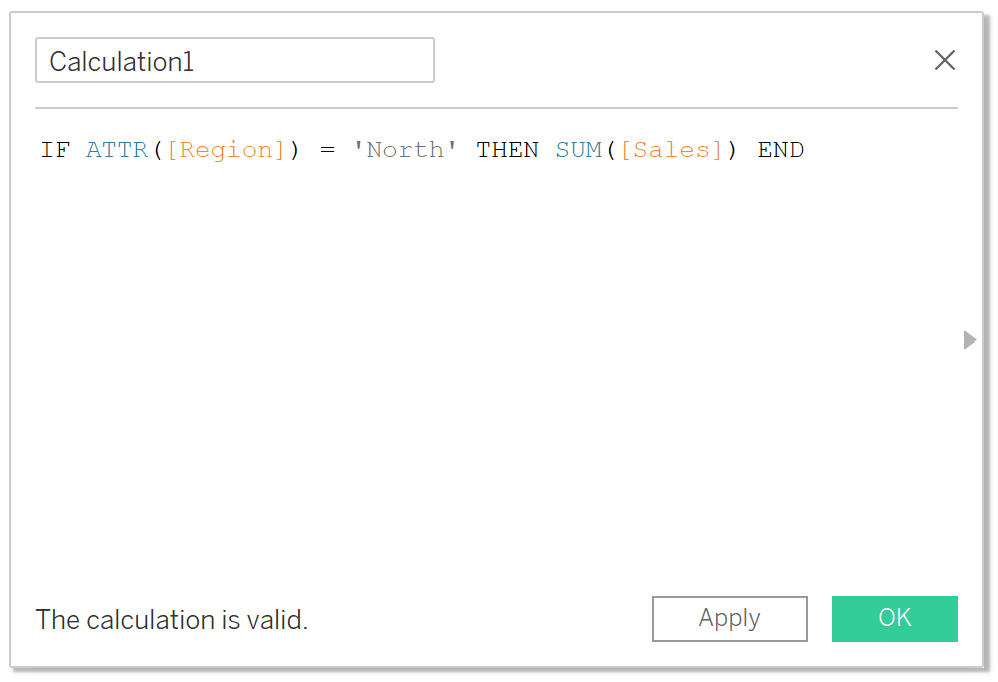
2. Wrap the region field in the ATTR function and wrap sales in the SUM function:
IF ATTR([Region]) = ‘North’ THEN SUM([Sales]) END
How to take basic calculated fields to the next level
Table Calculations
Tableau’s table calculations, while very powerful, can be both tricky and confusing to work with. These functions allow the engineer to efficiently compute aggregations within a sheet such as running totals, window sum, window max, etc. But to properly utilize table calculations, the engineer must have a firm understanding of how a table calculation behaves.
The Beginner’s Guide to Tableau Table Calculations
Level of Detail Calculations
The Level of Detail (LOD) function is a powerful feature that allows you to control the granularity or level of detail of your analysis independently of the visualization’s overall level of detail. LOD expressions enable you to perform aggregate calculations at different levels of detail, such as aggregating data at a higher level than what is displayed in your visualization.
![]()
There are three main types of LOD expressions in Tableau: Fixed, Include, and Exclude. These functions unlock a great deal of flexibility in your analyses because you can explicitly define the level of detail for different numbers in your view.
Tableau Fundamentals: An Introduction to Level of Detail Expressions
You now should have a good understanding of basic calculated fields in Tableau as well as the resources to take your knowledge to the next level. But as with anything, that knowledge only turns into skill with practice – so open up a new workbook and start vizzing!
Thanks,
Dan

Written By
Dan Bunker

Peer Review
Felicia Styer
Assoc. Director, Analytics Solutions
Related Content
The Beginner’s Guide to Tableau Table Calculations
Tableau table calculations, while very powerful, can be both tricky and confusing to work with. There are some great benefits…

Ryan Sleeper
Learn the two types of ‘Basic’ calculated fields in Tableau This video shows you how to create new fields from…
An Introduction to Calculated Fields in Tableau
Possibly the most powerful feature of Tableau is its ability to allow authors to create new data from existing data…