3 Ways to Use Tableau in the Flow
I’ve shared before that I bet my career on Tableau because of its flexibility, but a close second reason is Tableau’s user experience. One of my favorite aspects of Tableau’s user experience is the ability to update my analyses “in the flow”, without having to interrupt my line of thinking or take redundant steps to answer new questions. This provides the benefits of rapid iteration and reducing the risk of distracting stakeholders that I may be presenting to.
This post shares three of my favorite applications of using Tableau in the flow. I’ll show you (1) a clever way to reverse-engineer table calculations, (2) how to update calculations on the fly, and (3) how to save advanced calculations for future use.
3 Ways to Use Tableau in the Flow
How to reverse-engineer table calculations
To show you how to reverse engineer a table calculation, I have set up the following chart with one of my favorite applications of this feature. On the first row, we are looking at sales by month; on the second row, we are using a quick table calculation to compute the month-over-month difference in sales. With this view, the first row is a trend and in the second row Tableau is doing the math for us to visualize the month-over-month change.
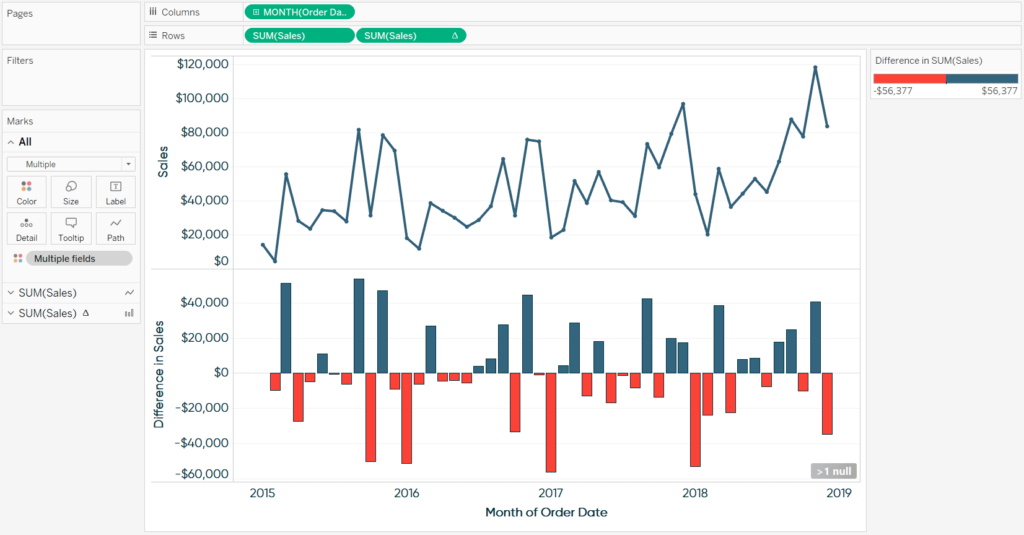
The basics of Tableau table calculations are beyond the scope of this post, so if you need a refresher, see An Introduction to Table Calculations in Tableau. Table calculations are identified with a delta (Δ) symbol on the pill they are being used on which is why we see this distinction on the second Sales pill on the Rows Shelf. Tableau comes with eleven different “quick table calculations”, including the currently used “Difference”, that allow you to do some fairly advanced formulas without needing to know how to write the syntax.
It would be great if we could see the syntax so we can reverse-engineer and learn from the computation – which is the first use of Tableau in the flow that I’m going to share!
Simply double-clicking on a pill with a delta symbol will display the underlying formula. Here’s how my view looks after double-clicking on the second Sales pill on the Rows Shelf.
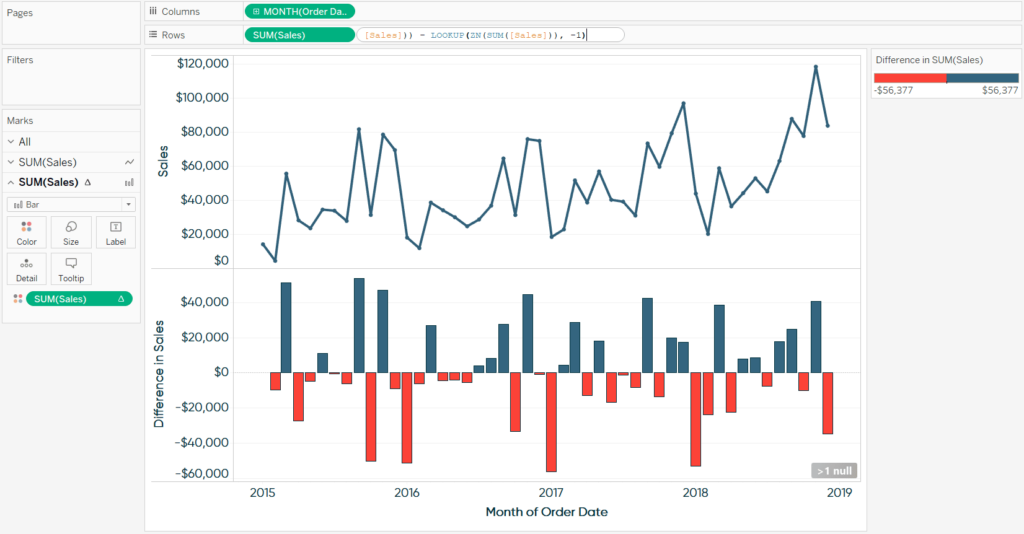
You will see different functions and operators in this formula depending on the quick table calculation being used. If you already know the functions, you can immediately reverse-engineer the formula to determine what’s happening on the second row. If the functions are new to you – that’s okay – create a calculated field and simply copy and paste the formula into the dialog box.

Any time you see something blue in a Tableau calculated field dialog box, you can click on it to get a definition and to see how it should be used in a formula. For example, here’s how the definition looks if I click on LOOKUP.

After reviewing the formula and the function definitions, I can see that the quick table calculation is taking the value in each cell minus the value at an offset of -1. Since the default addressing of a table calculation is across (from left to right), the offset of -1 means that the value will be from -1 column. From here I can either tweak the formula if needed and/or give it a name and save it for future use.
How to update calculations on the fly
Not only can you see the underlying formula of a table calculation in the flow of your analysis, but you can also update a formula. For example, if I were to double-click on the pill with a delta symbol, change the offset from -1 to -12, and hit Enter:
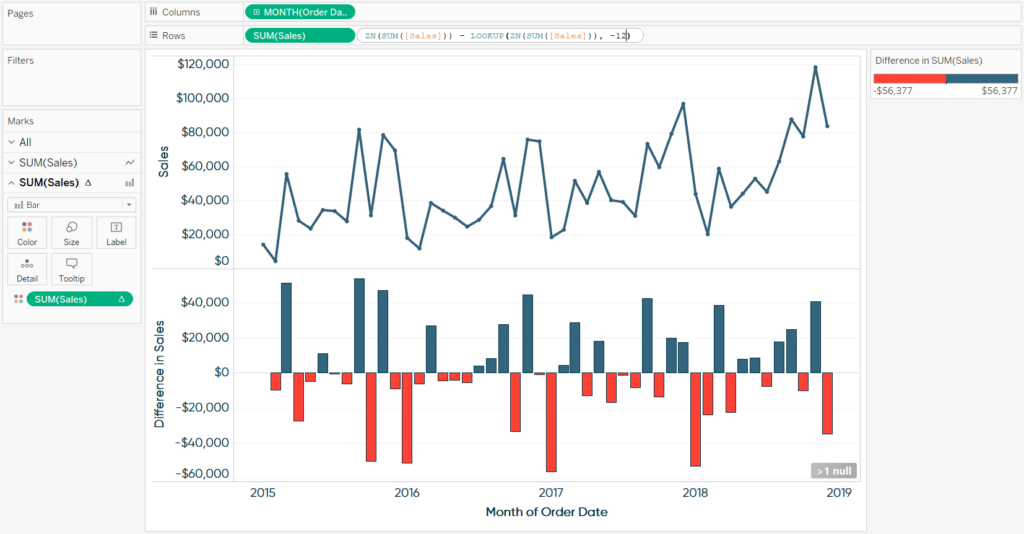
We would now have a year-over-year difference (current month’s value minus the value 12 months ago) instead of a month-over-month difference. To get the color to work properly, I had to make this same change to the table calculation on the Color Marks Card. Note the first twelve months are blank because we don’t have the historical data to do the year-over-year calculation.
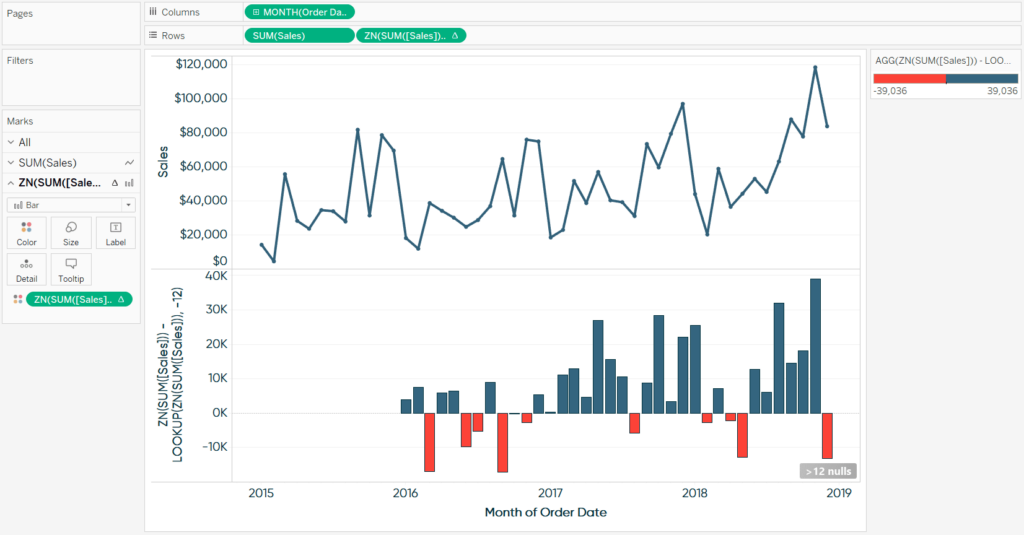
This functionality also works for non-table calculations. This is one of my favorite uses of Tableau in the flow because it helps me avoid distractions with my end users. For example, if I were to present the preceding chart in a meeting and one of the stakeholders says, “This is a great chart, but I’m much more interested in profit ratio than sales…”, I can almost instantly update the view by double-clicking on the first Sales pill on the Rows Shelf and adding SUM([Profit]) as the numerator.
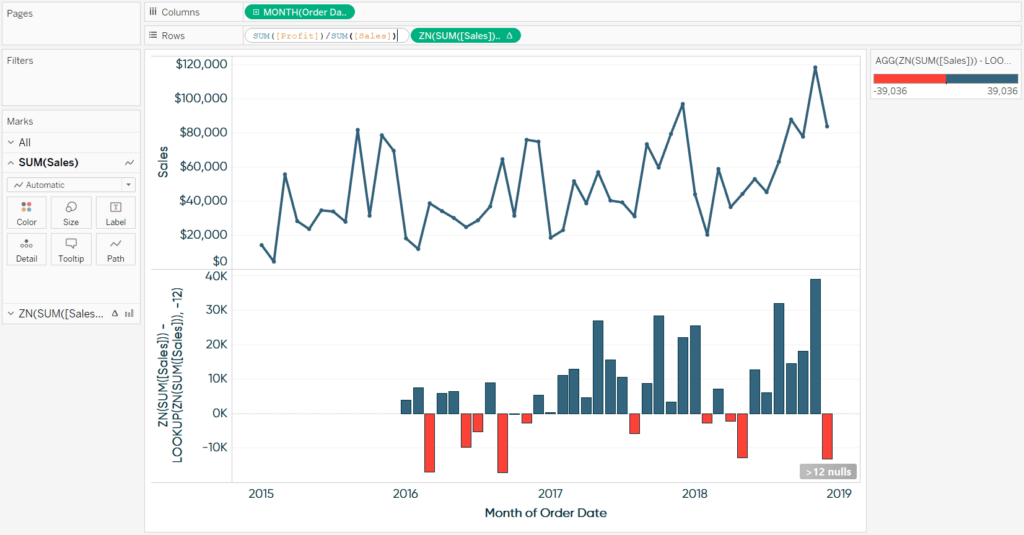
After clicking Enter, we have a completely different KPI trend on the first row!
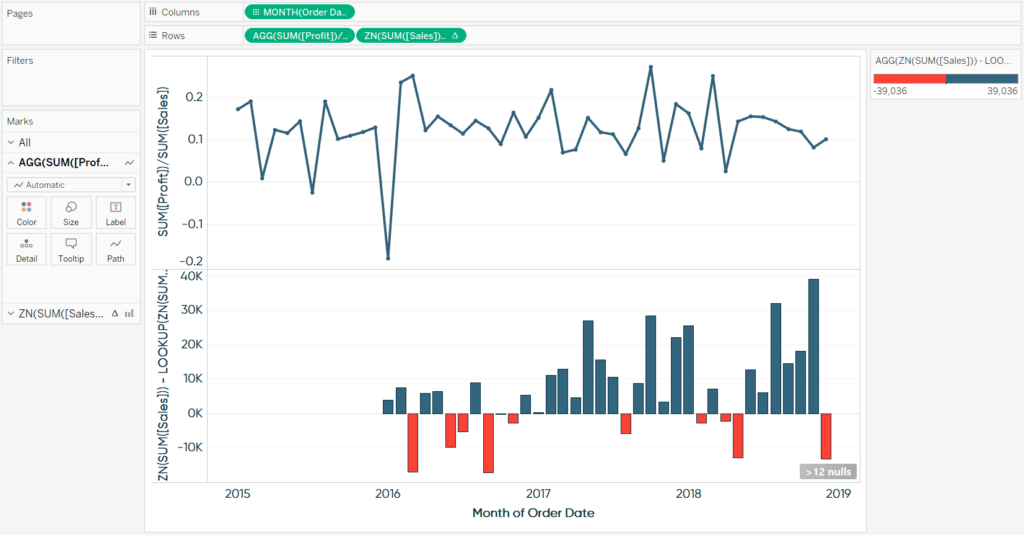
The reason I like this so much is that it removes excuses to slow us down. No, we’re not going to go back and update the data source. No, I don’t need to figure out how to add that KPI to the visualization. No, we don’t need to schedule a series of follow-up meetings to find an insight. We asked a new question in the flow of our analysis and were able to answer it on the fly in just a couple of clicks!
How to save updated calculations for future use
I showed you earlier how you can create a new calculated field and copy and paste the code from a table calculation, but there is an easier way to save a calculation for future use. In both the case of a newly created table calculation or an updated calculated field (as we did with profit ratio), simply dragging the pill into the Measures area of the Data pane will save it for future use.
Here’s how my view looks after left-clicking on the second pill on the Rows Shelf, dragging it to the Measures area of the Data pane, letting go, and giving the measure a name.
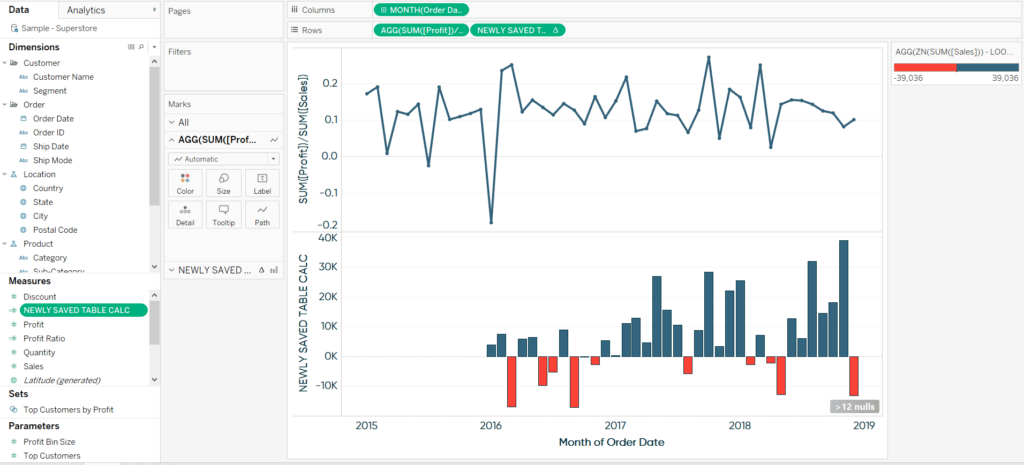
I can now use this table calculation on a different view without having to repeat the steps of adding a table calculation to a raw measure and updating the offset. This is a calculated field now, so I can also update it at any time by right-clicking on the field and choosing “Edit…”.
Thanks for reading,
– Ryan
Related Content
The Beginner’s Guide to Tableau Table Calculations
Tableau table calculations, while very powerful, can be both tricky and confusing to work with. There are some great benefits…
3 Ways the Describe Feature Can Help You Use Tableau
The “describe” feature in Tableau is one that somehow took me years to stumble upon, but is now one of…
Ryan Sleeper
Learn the two types of ‘Basic’ calculated fields in Tableau This video shows you how to create new fields from…


