An Introduction to Compounding Formulas in Tableau

I have recently come across quite a few finance projects that required me to either use a Net Present Value (NPV) calculation to bring down values that are planned 10 years down the line to their present value or the opposite, show forecasting values for the next 3-5 years of sales and profitability also called Future Value and compounding formula calculations in Tableau.
As someone with a business background, I became quite familiar with these formulas while getting my bachelor’s degree and have since learned exactly how to implement them in Tableau. Now let’s get started and dive in!
Level up your advanced analytics with Playfair+
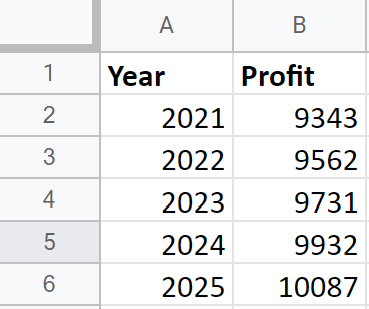
PS: Before we get started, I wanted to give a brief introduction into the dataset. I created a very simple and basic mock data set with one date dimension and one measure that I called profit. The values are completely made up and will guide us through the calculations to make it easier to understand and track.
Net present value calculations
Net present value, or NPV, calculations are especially useful to determine the current worth of investments, planned projects and a series of cash flows. When calculating net present value for cash flows, you are taking into account the timing e.g., the year or month of each income stream as this has a major impact on the current value of your investment.
![]()
To calculate NPV, one needs to discount / use factoring for monetary cash flows for two major reasons:
1. The time value of money. Money will not have the same value in 15 years as it does today. Inflation, interest rates, price increases and other opportunity costs can potentially impact its value. Simply said, money received as soon as possible is worth more than money received in an uncertain future.
2. Another reason for the discounting is to take risks into consideration. The longer cash flow is planned out for, the more risk there is that your prediction could potentially be wrong.
So, to calculate the NPV formula you will need a date dimension and a measure that can be discounted to its current value. For this example, I am using the sample dataset that I quickly previewed in the introduction of the blog. The years 2022, 2023, 2024 and 2025 are profit estimates and we want to know how much their monetary value is in the year 2021 as this is a baseline.
Continue reading with a free account, or login.
Unlock this tutorial and hundreds of other free visual analytics resources from our expert team.
Already have an account? Sign In
By continuing, you agree to our Terms of Use and Privacy Policy.
Let’s get started with the basic formula of a net present value:
Measure (e.g., Sales / Profit) / (1 + % Rate) ^ Compounding Value
The compounding value is helping us determine by how many years we need to compound downwards. Instead of writing a long IF statement, we can create logic to make this compounding value dynamic like the picture below:
CASE YEAR([Year])
WHEN 2021 THEN 0
WHEN 2022 THEN 1
WHEN 2023 THEN 2
WHEN 2024 THEN 3
WHEN 2025 THEN 4
END
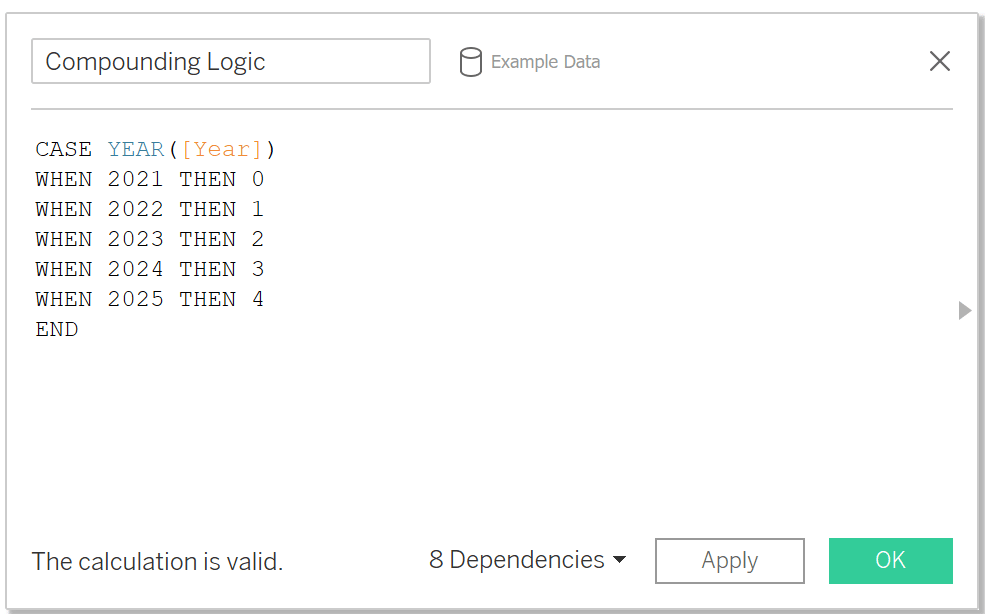
Because we have chosen 2021 to be our baseline year, the measure does not need to be brought down to a net value, or current value, as it is already displayed in today’s dollar.
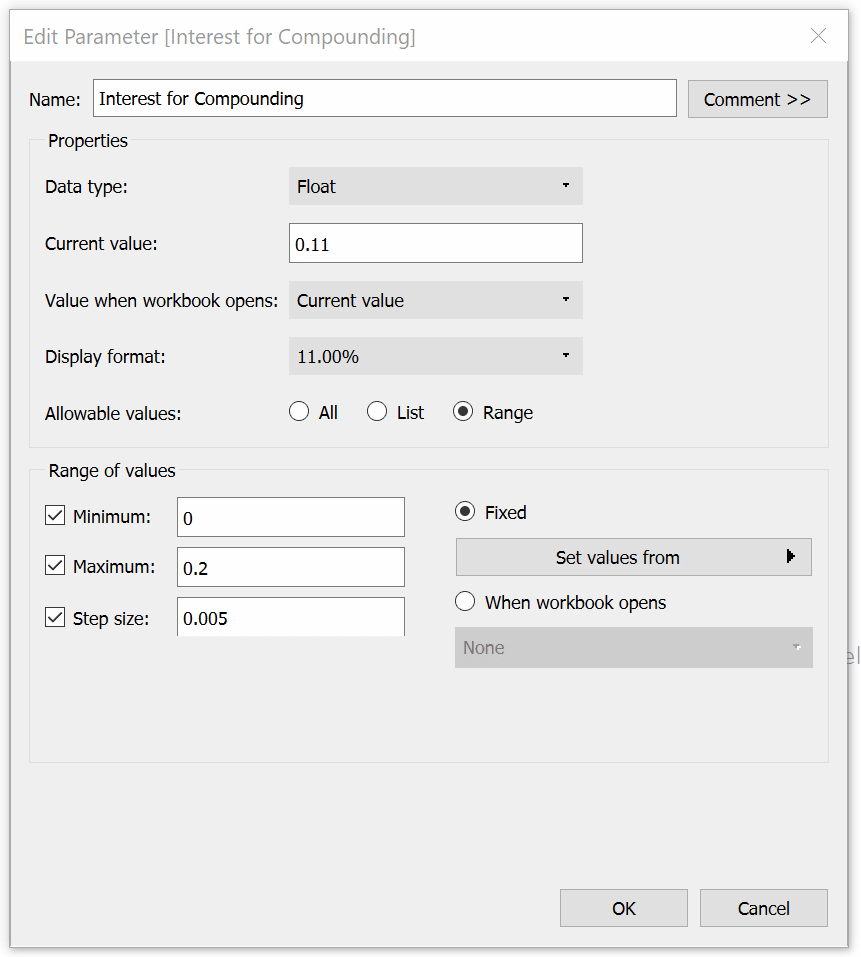
Another trick when using the NPV formula is to parameterize the decompounding interest rate to be easily adjustable by your Finance Department or other stakeholders because different teams might use a different baseline for an interest rate and might use indicators such as the yearly inflation rate, the current interest rate between federal banks or other market KPIs to set the interest rate to be as meaningful as possible.
To create the parameter, I click anywhere in an empty space in the Data pane and select “Create Parameter”. It is important to keep the parameter as a Float and to make it easier for the user, change the display format to percentage. I personally also like to opt for a Range parameter to make sure I set appropriate limits to what value the interest rate can take, for example, it has to be within 0 and 20% with a step size of 0.5%. This allows me later on to include and show the parameter as a slider on the dashboard and the user can simply drag the value to its desired interest level without much hassle.
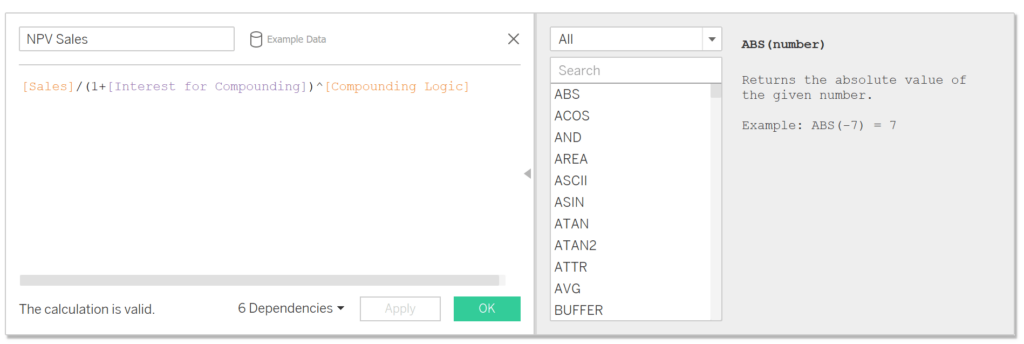
In the end, I am bringing together my compounding value formula as well as my parameterized interest rate and re-create the NPV calculation in Tableau.
[Sales]/(1 + [Interest for Compounding])^[Compounding Logic]
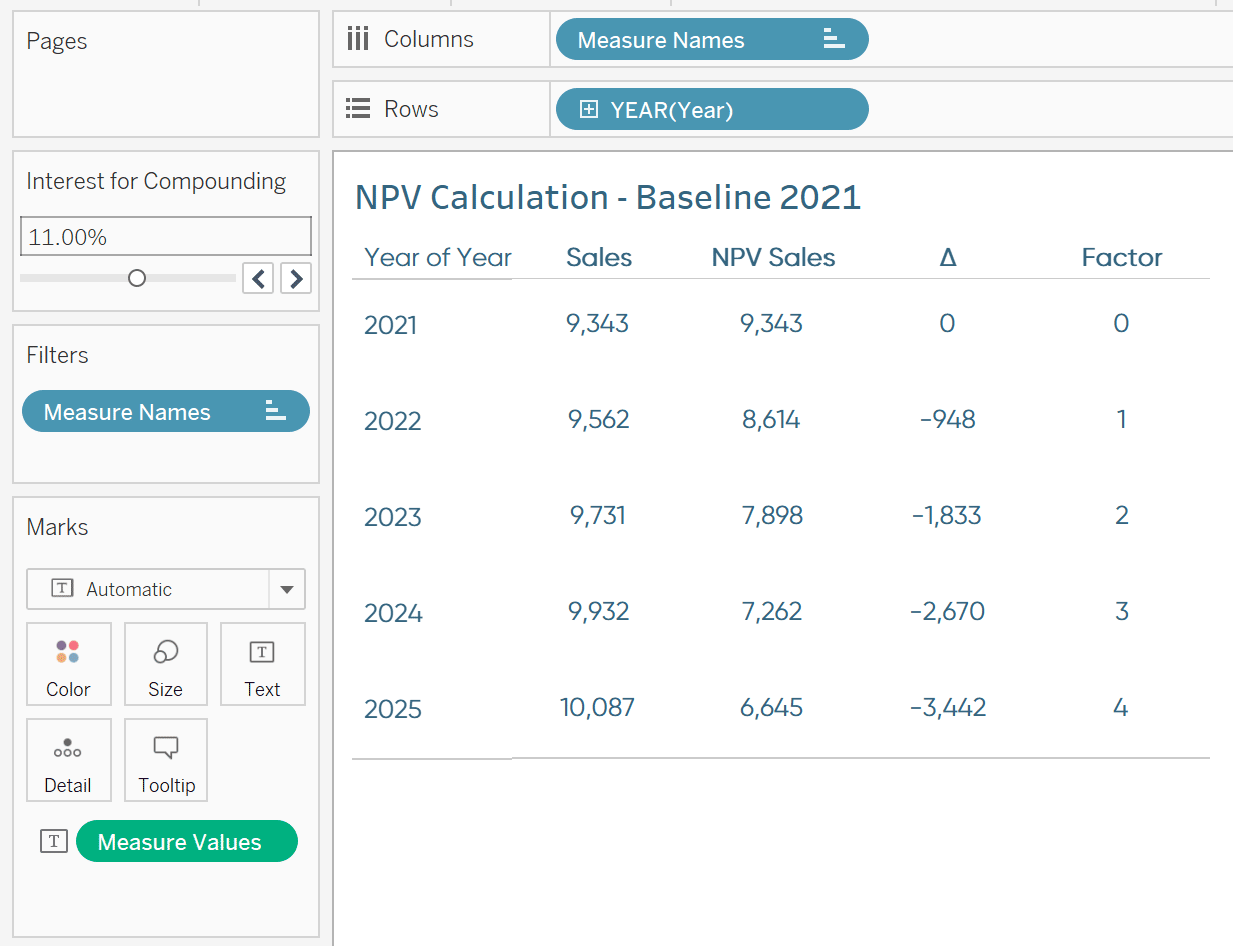
I can now also drag all my relevant measures onto the view and show my users immediately what profit in e.g., 2025 is worth in today’s dollar (end of 2021). To illustrate the difference even better between the forecasted profit and the NPV, I added a calculation that shows the difference and formatted it appropriately. In addition, I am showing the compounding value with the alias Factor and adding the compounding interest parameter to the view.
Future value calculations
The Future Value calculation helps you determine the future value of a current asset by using an estimated rate of growth. Now, the Future Value calculation is mostly used in finance for financial planning to determine how much a lump-sum investment with monthly, quarterly or yearly payments will end up being after, let’s say 10 years.
However, I have used this formula in a different setting as well, assuming prices for a specific asset for the next 5 years during forecasting season. Now instead of only estimating growth, the interest rate that we are setting should also take into account inflation, price increases of material and labor as well as strategic price changes of our assets.
Knowing the future value of an asset or a financial investment allows us to make better informed decisions and help us understand our profit margins when we, for example, have a strategic decision to keep prices the same but need to increase costs to reflect all the increases happening in the current economic environment.
In comparison to the NPV calculation, we are now multiplying our measure and end up with a formula that looks something like this:
Measure (e.g., Sales / Profit) * (1 + % Rate) ^ Compounding Value
The way I am using this formula is giving me a simple answer to the question:
“How much sales / profit will I have if my annual growth rate is X% over the next 5 years?”
To bring the formula into Tableau, we can make use of the previously created Compounding Parameter and the Compounding Logic calculation. I then created a new calculated field that I called Future Value Sales.
![]()
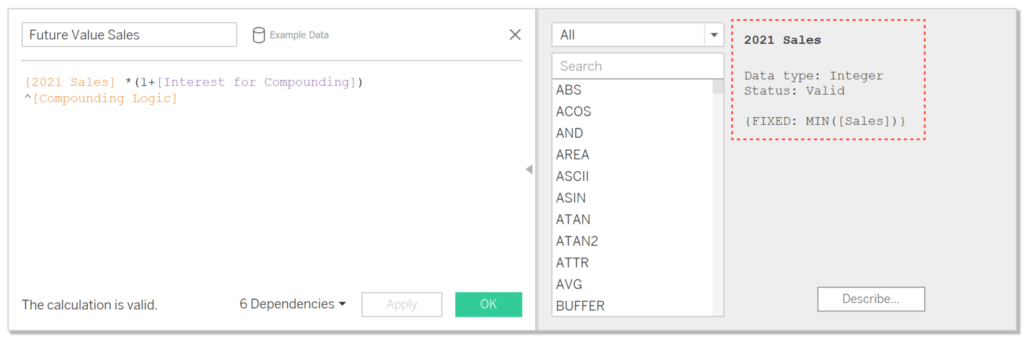
In order to create a baseline of Sales, I created a FIXED LOD on MIN([Sales]) which is displaying the sales of 2021 and helping me to have the same starting point for all the years.
2021 Sales:
{FIXED: MIN([Sales])}
Future Value Sales:
[2021 Sales] * (1+[Interest for Compounding])^[Compounding Logic]
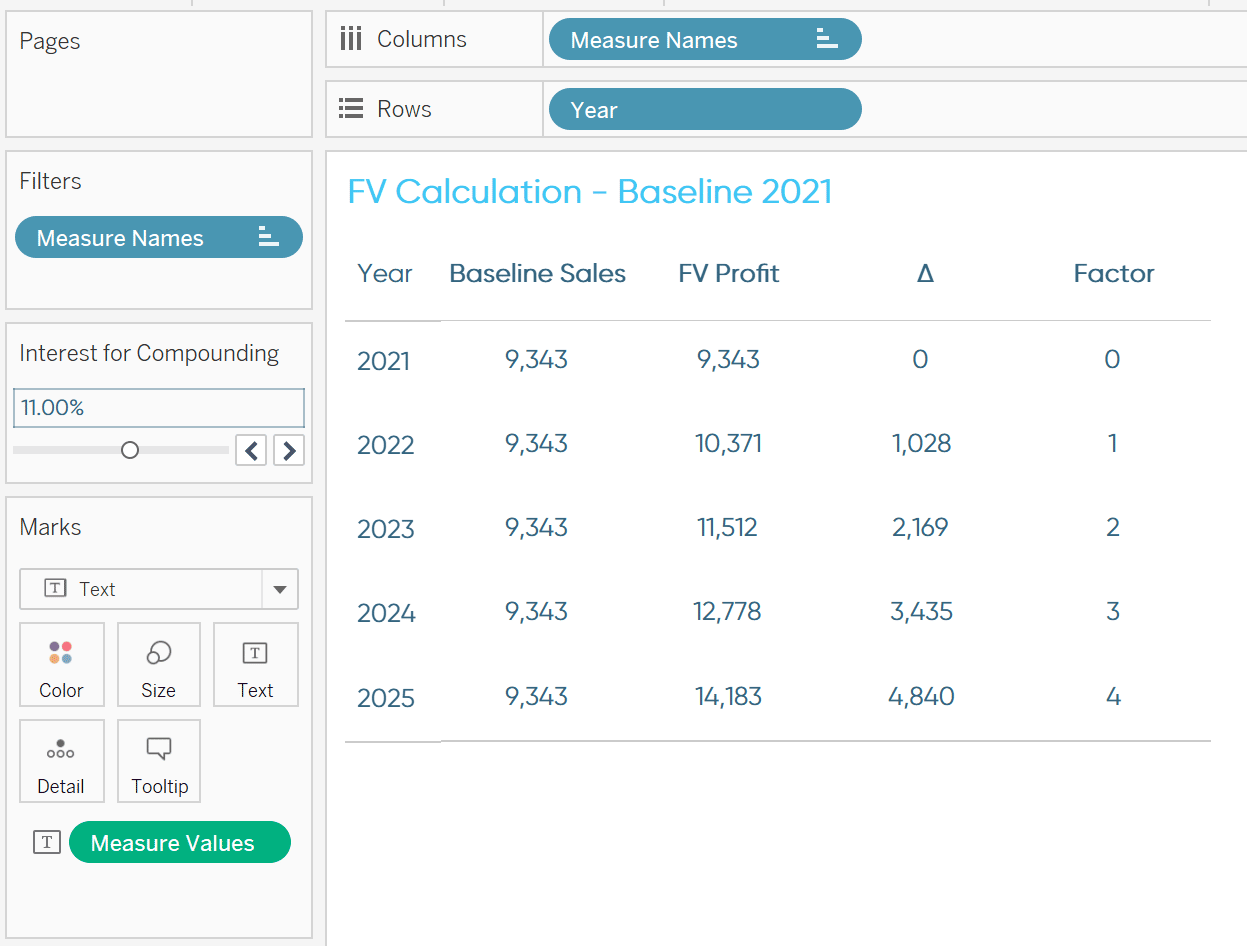
After setting my starting point and getting the calculation set up, I only need to drag the appropriate fields on the view again to show the impact of the Future Value calculation.
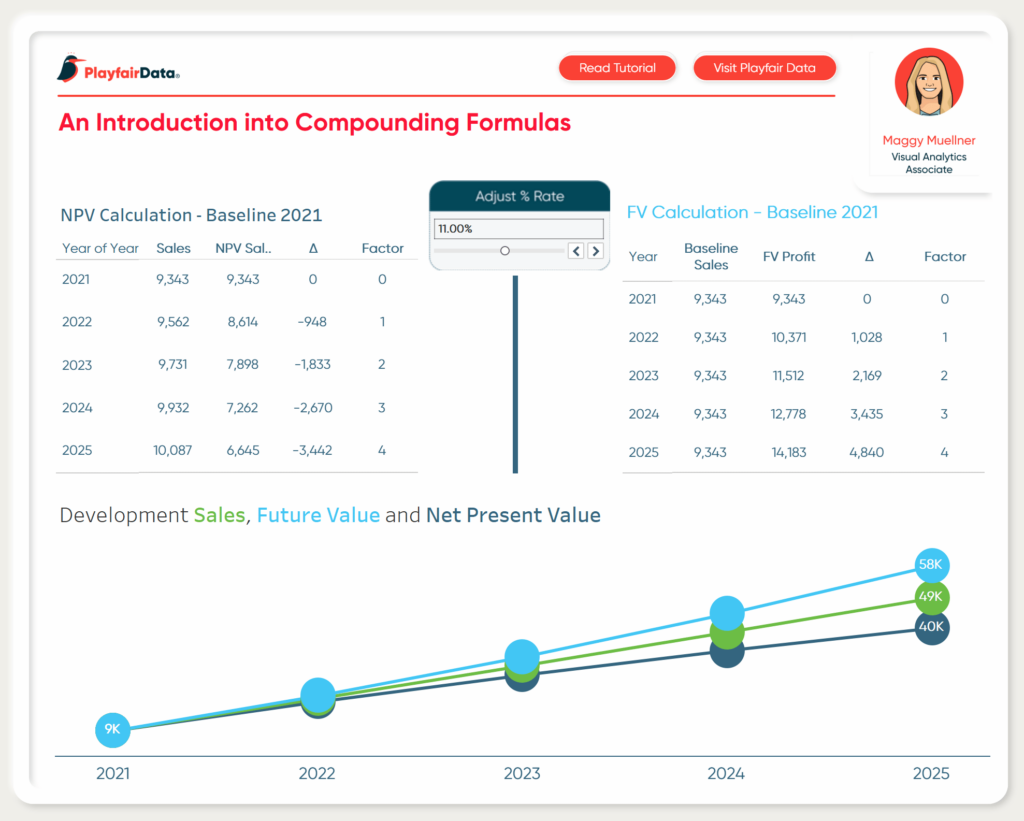
Combining NPV and FV on the view
In the end, I just combined both of my visuals on a dashboard and also created a multi-line chart to show how Sales differentiate if we calculate the Future Value or the Net Present Value for better visualization. I also highlighted that the user can adjust the interest rate based on their preferences and put a background image behind it to call it out even more.
And that’s it! I hope you liked this tutorial and can use some of this logic next time you have to deal with compounding formulas!
Stay hungry,
Maggy

Written By
Maggy Muellner

Graphic Design
Dan Bunker
Manager, Decision Engineering
Related Content
3 More Ways to Make Lovely Line Graphs in Tableau

Tableau line graphs are one of the most widely used visualizations on dashboards today – it’s hard to beat a…
How to Flag Rows of Interest in Tableau

A “row of interest” can vary from project to project. A simple example would just be to mark rows where…

Ryan Sleeper
Learn the two types of ‘Basic’ calculated fields in Tableau This video shows you how to create new fields from…