How to Add 14 Custom Tableau Maps with Mapbox
If you’ve ever had to look up the X / Y or latitude / longitude coordinates to create a custom map in Tableau, you’re grateful for the powerful map features that come out of the box with the software. By simply double-clicking a dimension that Tableau recognizes as a geographic field, thousands of locations are instantly plotted on a map. This saves you the countless hours required to look up the coordinates manually or the need to purchase additional licensing to use maps. This post shares how to use 14 additional map styles in Tableau for free, and with very little effort using a service called Mapbox.
Mapbox is an integration that shipped with Tableau 9.2. I wanted to write this tutorial because even though the feature came out three versions ago, I don’t see many users taking advantage of it. Custom map styles are a great way to add style to your data visualization, and this tutorial will show you how easy it is to integrate Mapbox with your Tableau maps.
Watch the Related Video with Playfair+
Continue reading with a free account, or login.
Unlock this tutorial and hundreds of other free visual analytics resources from our expert team.
Already have an account? Sign In
By continuing, you agree to our Terms of Use and Privacy Policy.
How to add 14 custom Tableau maps with Mapbox
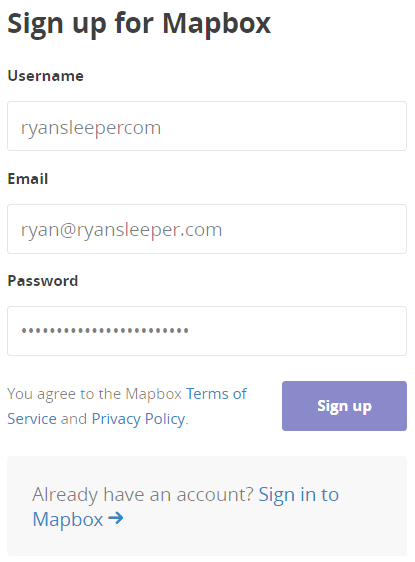
1. Sign up for a free account at Mapbox at https://www.mapbox.com/studio/signup/
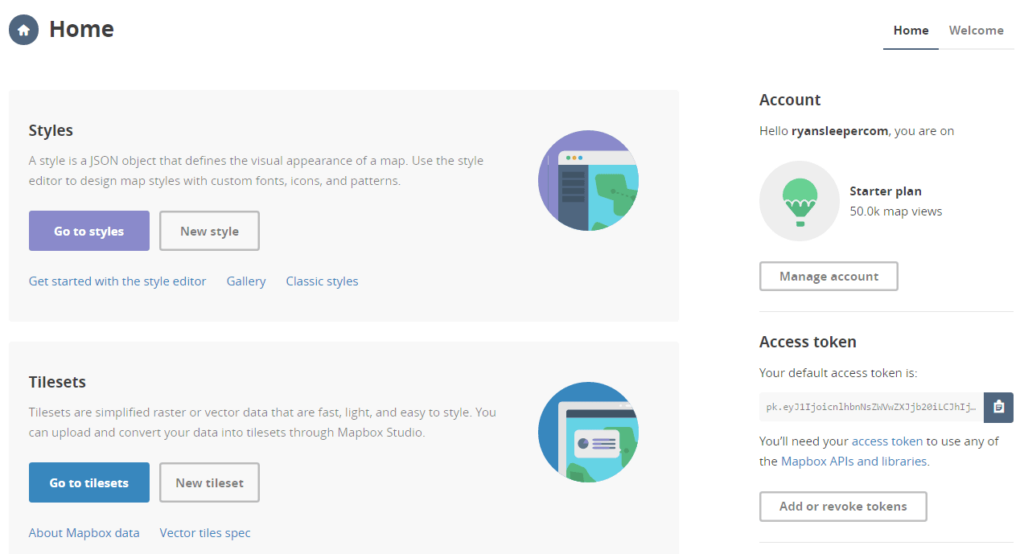
2. From the Home tab within your Mapbox account, note the Access Token on the right side of the page
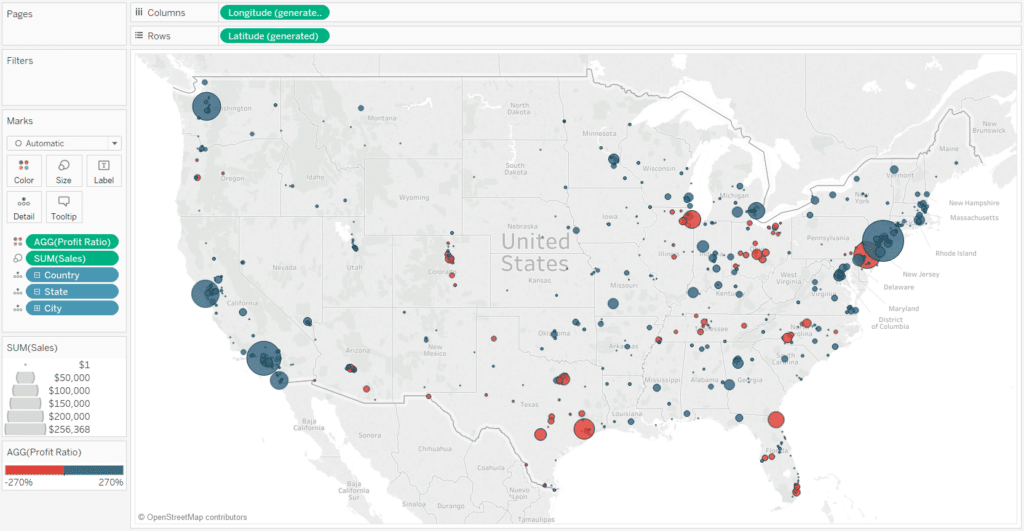
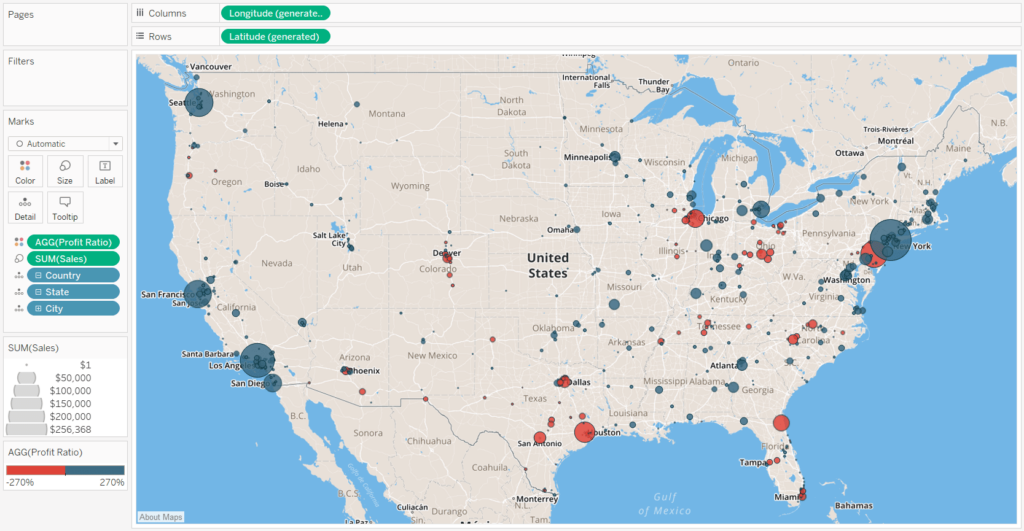
3. Create a map in Tableau. Here is an example Tableau map looking at Sales and Profit Ratio by City in the Sample – Superstore dataset.
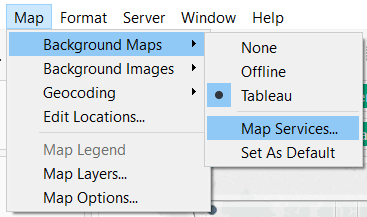
4. Navigate to Map > Background Maps > Map Services in the top navigation.
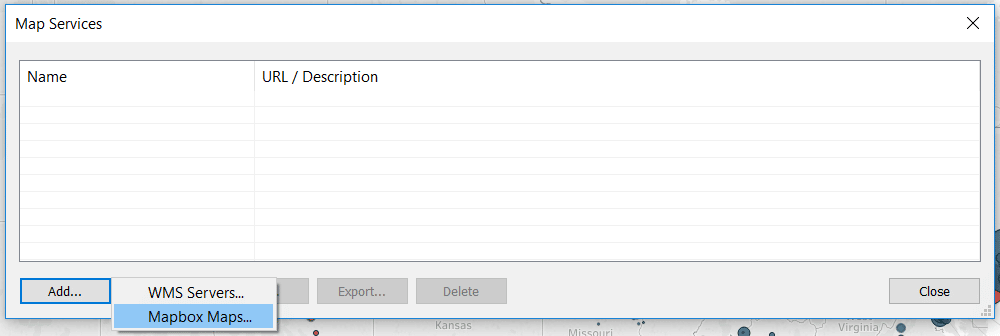
5. After the dialog box appears, click Add and choose “Mapbox Maps…”.
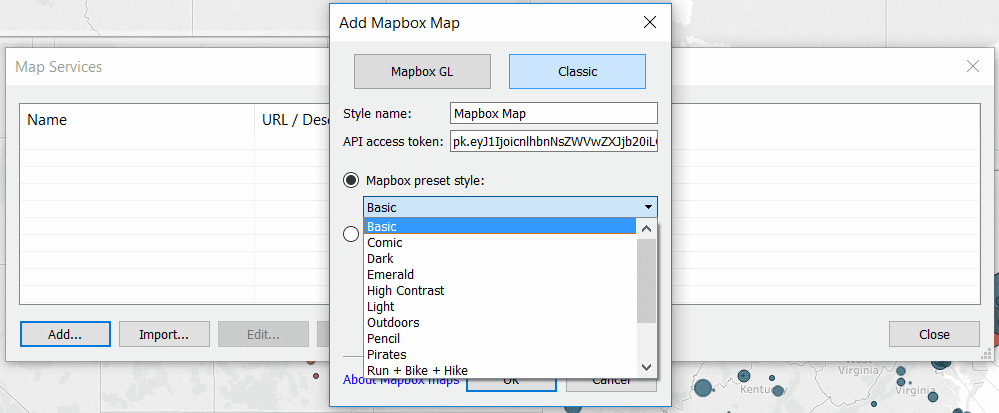
6. Navigate to the Classic tab, give the map a name, paste your access token noted in step 2 above, and choose your style!
![]()
Here’s how my final Tableau map looks after choosing the Basic style, clicking OK, and closing the Map Services dialog box.
Thanks for reading,
– Ryan
This content is excerpted from my book Practical Tableau: 100 Tips, Tutorials, and Strategies from a Tableau Zen Master published by O’Reilly Media Inc., 2018, ISBN: 978-1491977316. Get the book at Amazon.

Written By
Ryan Sleeper
Related Content
3 Ways to Make Magnificent Maps in Tableau
Maps are one of the most effective chart types in Tableau and are also among the easiest chart types to…
How to Make Hub and Spoke Maps in Tableau
Hub and spoke maps not only plot locations on a map, but they draw connecting lines between the origin and…

Ryan Sleeper
How to Access 17 Additional Styles for Tableau Maps Tableau Desktop 2019.2 adds three new map styles, bringing the total…