How to Make Hub and Spoke Maps in Tableau
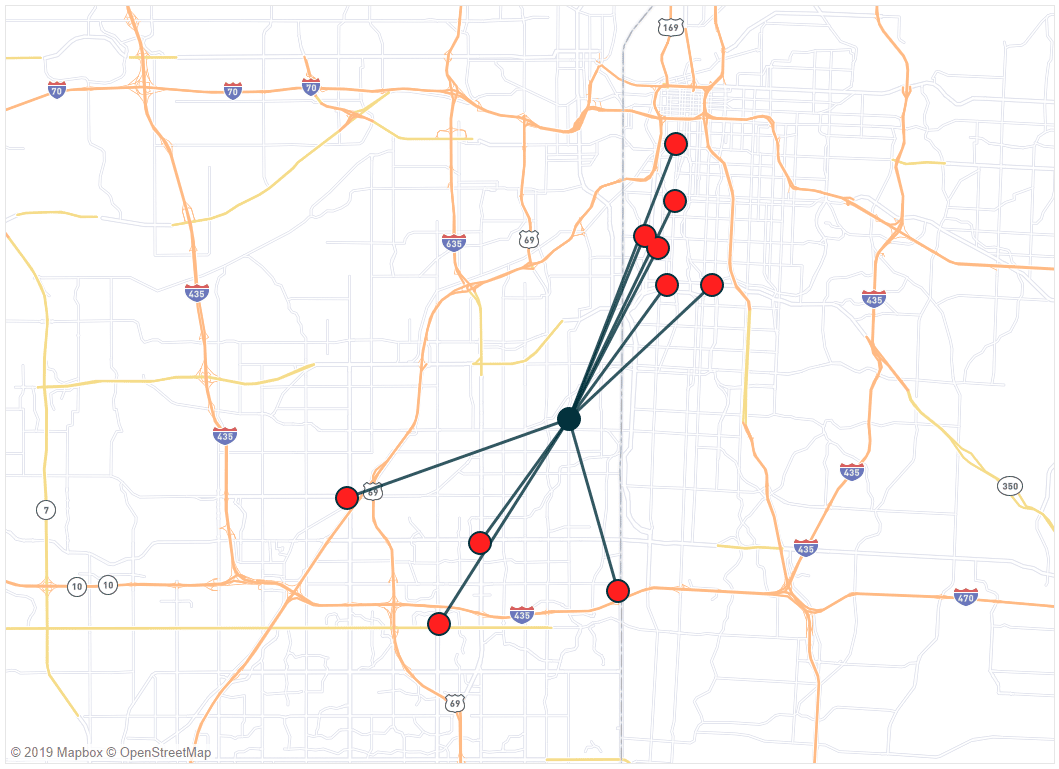
Hub and spoke maps not only plot locations on a map, but they draw connecting lines between the origin and one or more destinations. This type of map can be used to visualize connecting flight routes, travel schedules, migration patterns – or in the following case – the path between our office and my ten favorite barbecue restaurants!
This type of map has become remarkably easy to create with the introduction of the MakePoint and MakeLine functions available as of Tableau 2019.2. I’ve shared before 3 Ways to Make Magnificent Maps, but Tableau keeps innovating, so I’m adding to the series.
This post will show you how to make hub and spoke maps in Tableau with the MakePoint and MakeLine functions, but I’ll be taking this a step further and sharing: (1) how to use these functions without adding extra rows or columns to your dataset and (2) when not to use these new functions.
How to Use Tableau’s MAKEPOINT and MAKELINE Functions
The data source for hub and spoke maps
By the end of this post, you will be able to make a hub and spoke map connecting any origin to one or more destination points.
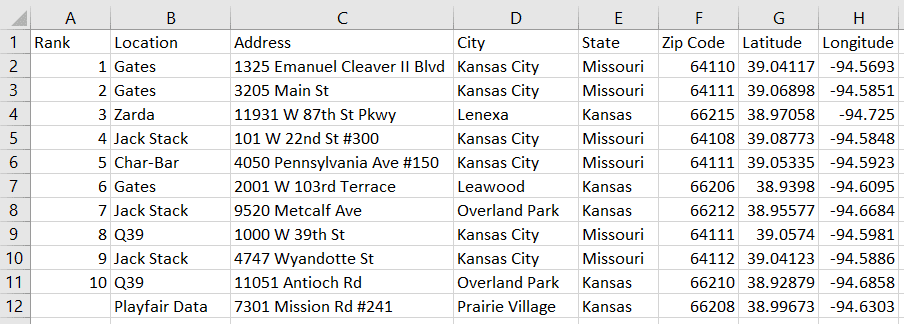
For this tutorial, I will be using this CSV file containing the addresses of my ten favorite barbecue restaurants and Playfair Data’s office.
Continue reading with a free account, or login.
Unlock this tutorial and hundreds of other free visual analytics resources from our expert team.
Already have an account? Sign In
By continuing, you agree to our Terms of Use and Privacy Policy.
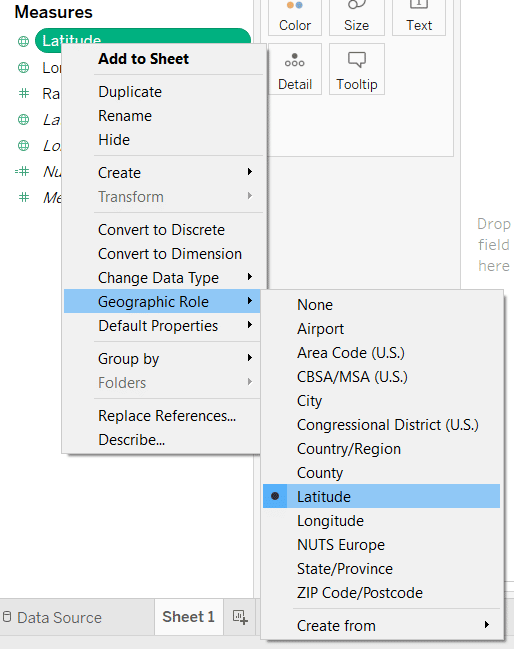
Note my dataset contains a column for Latitude and Longitude, so we will be using these coordinates instead of the versions that Tableau automatically generates. If Tableau doesn’t automatically recognize your coordinates as Latitude and Longitude, you can assign them geographic roles by right-clicking on each field, hovering over “Geographic Role”, and choosing Latitude or Longitude.
Tableau’s MAKEPOINT function
We will start with the MakePoint function which will, well, ‘make points’, for our origin and destinations. You don’t need this function if you are simply creating a symbol map plotting each location at its respective intersection of Latitude and Longitude. However, making points in this manner can be used with the MakeLine function in the next step to ‘connect the dots’ between locations with a line.
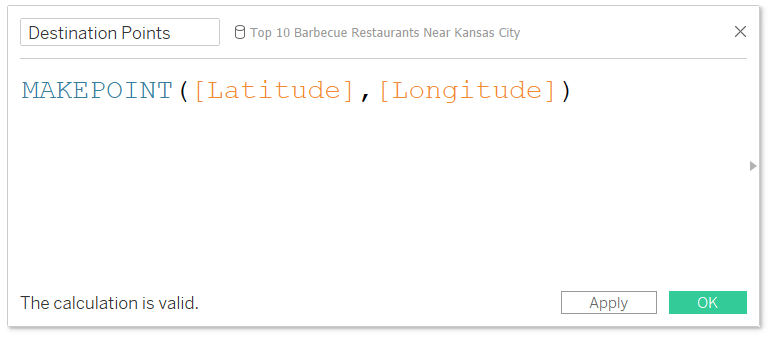
The Syntax for the MakePoint function is MAKEPOINT([Latitude],[Longitude]). We need to use this function in two calculated fields; one for our origin and one for our destination(s). As you can see in my dataset, I only have one set of Latitude / Longitude coordinates, so I’ll start with those. This calculated field will eventually make points for my destinations:
MAKEPOINT([Latitude],[Longitude])
Next, we will need a calculated field that creates the point for our origin. Your dataset may have four columns for geographic coordinates (Origin Latitude, Origin Longitude, Destination Latitude, and Destination Longitude), in which case you would use the Origin coordinates with the MakePoint function to create your Origin points and your Destination coordinates with the MakePoint function to create your Destination coordinates.
However, as promised in the post’s introduction, I’m going to show you how to isolate the coordinates for the origin without the need for those two extra columns. To create the origin point, I’m going to use a FIXED level of detail expression to isolate the coordinates for Playfair Data’s office. The formula is:
MAKEPOINT({AVG(IF [Location] = “Playfair Data” THEN [Latitude] END)},{AVG(IF [Location] = “Playfair Data” THEN [Longitude] END)})
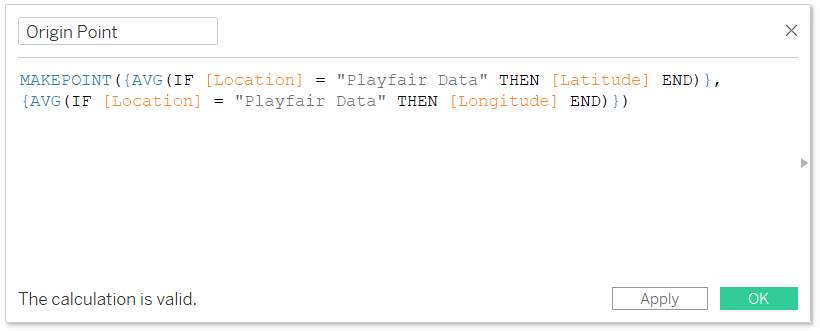
Note you don’t see the expression, FIXED, in the calculated field. FIXED is the default level of detail expression and when you’re not addressing any specific dimension, you don’t need to include the word. This is a trick I picked up from my friend Carl Allchin at The Information Lab.
In case it’s easier for you to understand what this is doing, this calculation can also be written as:
MAKEPOINT({FIXED: AVG(IF [Location] = “Playfair Data” THEN [Latitude] END)},{FIXED: AVG(IF [Location] = “Playfair Data” THEN [Longitude] END)})
Tableau’s MAKELINE function
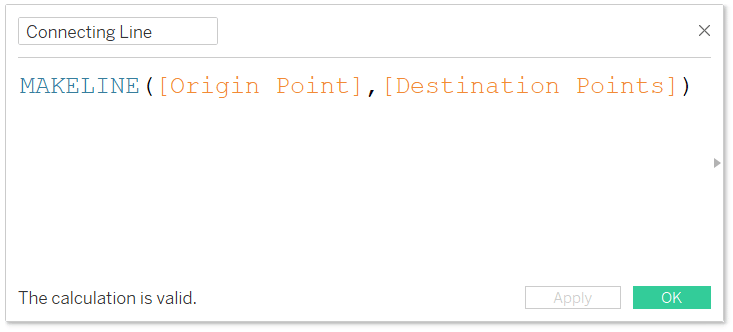
We are now ready to make our connecting lines using the MakeLine function. The syntax for the MakeLine function is MAKELINE([Start Point],[End Point]). I will make another calculated field and plug in my [Origin Point] and [Destination Points] calculations.
MAKELINE([Origin Point],[Destination Points])
You can also nest the calculations required to create the origin point and destination points, but I find it easier to manage when these are separated into their own calculated fields. If you would prefer to have everything in one calculation, the formula would be:
MAKELINE(MAKEPOINT({AVG(IF [Location] = “Playfair Data” THEN [Latitude] END)},{AVG(IF [Location] = “Playfair Data” THEN [Longitude] END)}),MAKEPOINT([Latitude],[Longitude]))
Creating the hub and spoke map
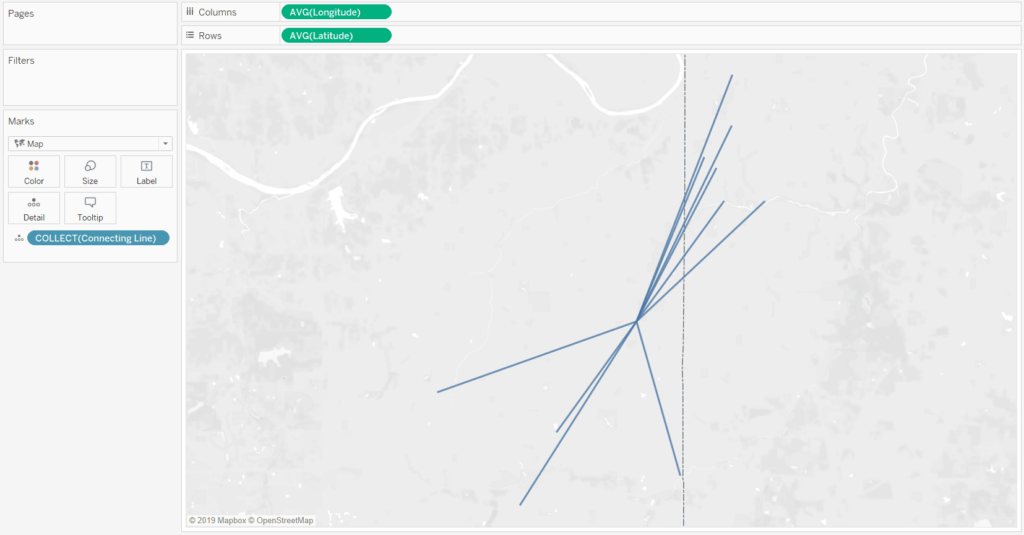
We’re now ready to make the hub and spoke map! First, place your Longitude measure on the Columns Shelf and Latitude measure on the Rows Shelf.
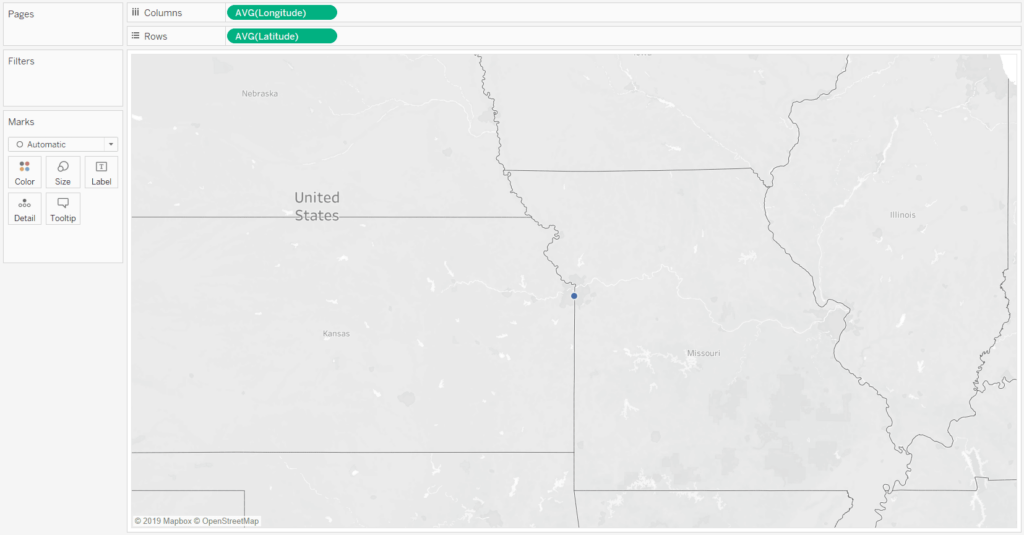
By default, this creates a symbol map with one circle. That one mark represents the intersection of the average Longitude and average Latitude across the entire data source.
When you are creating a map from fields with geographic roles like we are, ensure you change the mark type from the default, Circle, to Map.
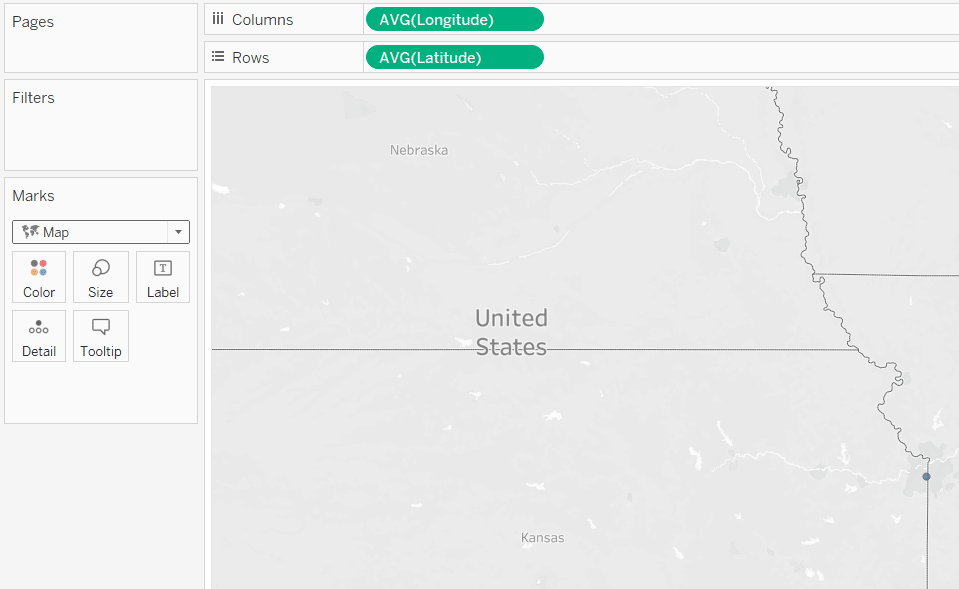
After changing the mark type to Map, simply placing the calculated field created with the MakeLine function to the Detail Marks Card will draw a line between the origin and each destination!
Note you do not always need to use the MakePoint and MakeLine functions to connect locations with a line. The approach outlined in this post is the most efficient way to make a hub and spoke map, but if you are simply wanting to connect points in a sequential order, you are better off changing the mark type to Line and adding a field for point order to the Path Marks Card. For a detailed tutorial on this approach, see How to Make a Sequential Path Map in Tableau.
There are some optional steps if you want to match the hub and spoke map pictured in this post’s introduction including:
– Make a dual-axis map with the second axis containing a symbol map. This technique is used to make the larger circle marks at the end of each ‘spoke’.
– Change the map style to Streets (available as of Tableau 2019.2) by navigating to ‘Maps > Map Layers…’ in the top navigation and changing the option selected in the Style dropdown menu on the Map Styles pane.
– Color the marks by whether they are an origin or destination.
– I did not do this in my example, but you can parameterize the origin by simply replacing the hardcoded location (“Playfair Data” in my example) with a parameter containing allowable values that match each potential origin.
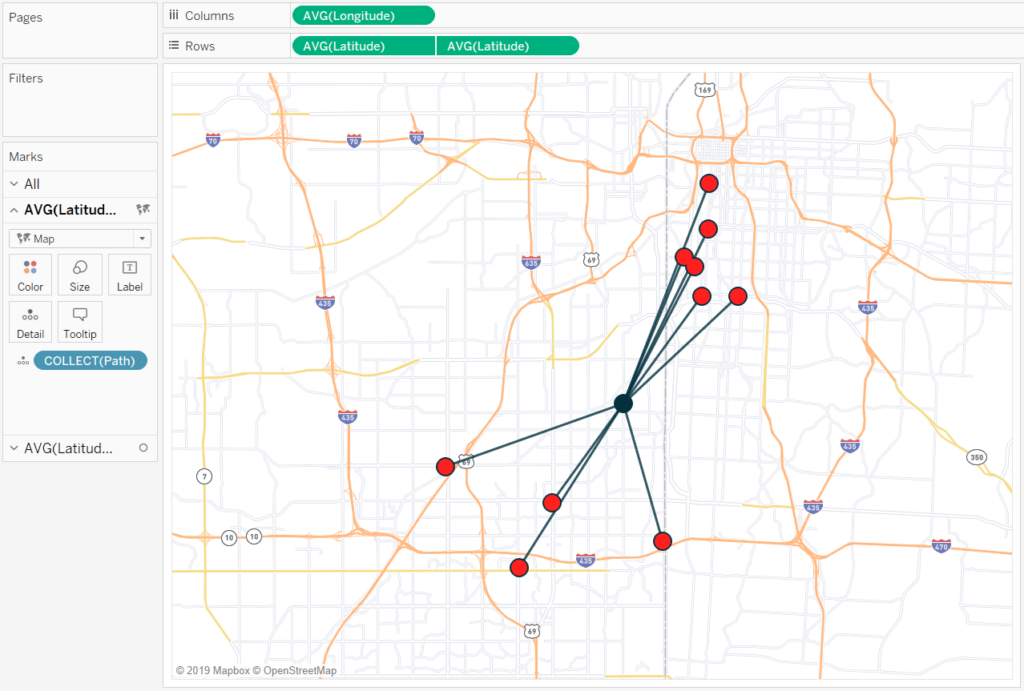
As you can see, Playfair Data is strategically located between my ten favorite barbecue restaurants in Kansas City!
Thanks for reading,
– Ryan


Written By
Ryan Sleeper
Related Content
How to Make a Sequential Path Map in Tableau
As with most features in Tableau, maps are flexible enough to meet many different analysis needs. One of the most…
3 Ways to Make Magnificent Maps in Tableau
Maps are one of the most effective chart types in Tableau and are also among the easiest chart types to…

Ryan Sleeper
Using Tableau Mapping Functions to Find Barbecue in Kansas City You will learn how to (1) use the MAKEPOINT function…