How to Analyze A/B Tests in Tableau Using Z-Tests

So you’ve completed an A/B test in Tableau, now what? It’s easy to determine which version performed better, but is the outcome statistically significant? You could use an online calculator to find out. Search for a calculator, type in the test results, and it will tell you whether the results are significant. When you analyze just a few tests, these calculators will work well. But this method becomes tedious, invites typos, and limits choice as you increase the number of tests to analyze. Building the statistical test in Tableau takes more time upfront but eliminates the tedium and risk of manual entry. You also gain control of the confidence level and statistical method used.
Learn Advanced Analytics with Playfair+
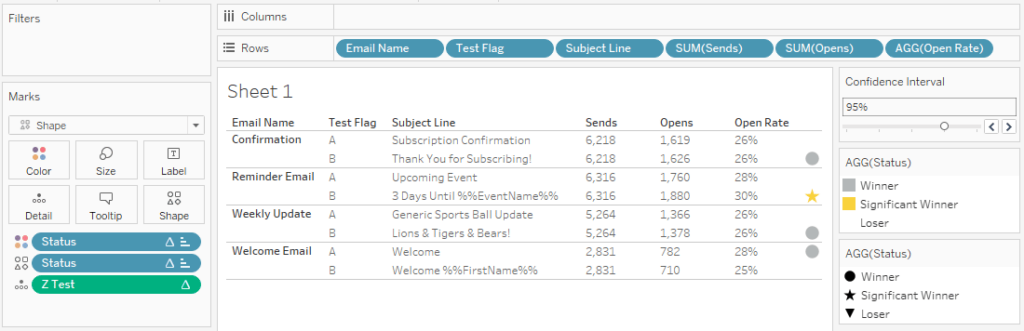
This workbook applies a two-tailed z-test to a sample dataset of email opens. It flags each email winner and indicates whether the test was statistically significant. You can download the workbook as-is and replace the dataset with your own or keep reading for instructions to build your copy.
This is the fourth post in a series on statistical analysis in Tableau. For other applications, see How to Isolate Linear Regression Equations in Tableau.
An introduction to the statistics
This paragraph briefly reviews the statistics and is completely optional. A z-test determines if the means of two populations have a statistically significant difference when the population size is at least 30. A two-tailed test will consider both over and underperformance, making it ideal for A/B testing. For z-tests, we need two metrics, the z-score, and the z-test result. The z-score is the threshold for statistical significance and is determined by the confidence level. Two-tailed tests have higher thresholds than one-tailed tests. These values come from lookup tables. Next, we use the observations to calculate the z-test result. If the result of the z-test is greater in magnitude than the z-score then we can state that the populations are significantly different.
![]()
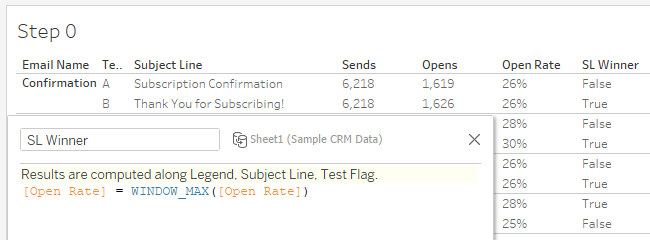
First, create a calculation to determine which subject line performed better.
Continue reading with a free account, or login.
Unlock this tutorial and hundreds of other free visual analytics resources from our expert team.
Already have an account? Sign In
By continuing, you agree to our Terms of Use and Privacy Policy.
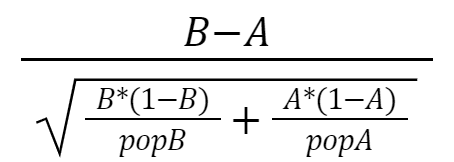
This is the z-test calculation we’re going to translate into Tableau. Here, A and B represent our open rates, while popA and popB represent emails sent.
Calculating the z-test
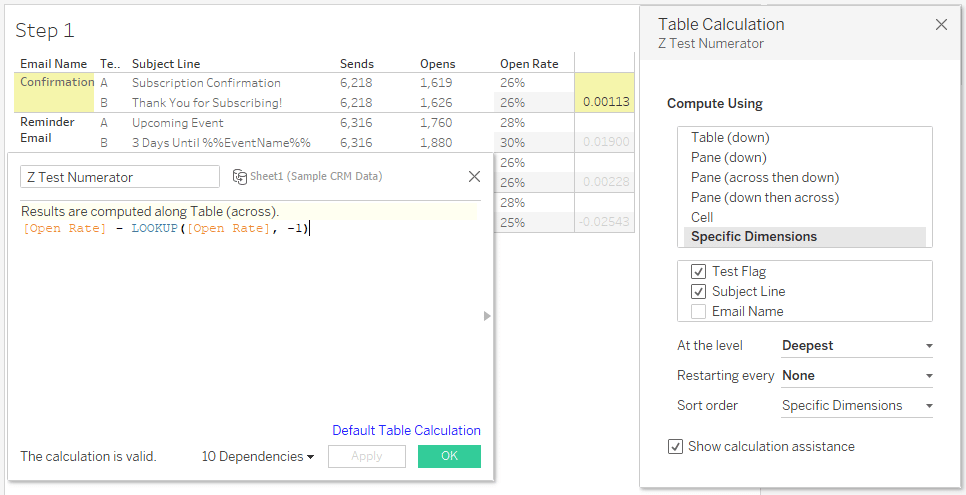
First calculate the numerator. Make sure that your table calculation includes both A and B and is calculated separately for each email.
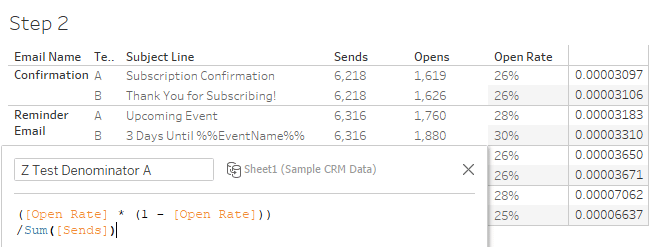
Next, calculate the first part of the denominator.
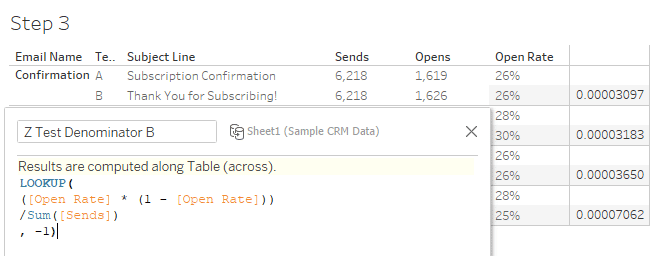
Then we calculate the second part of the denominator, wrapping the same calculation in a lookup function.
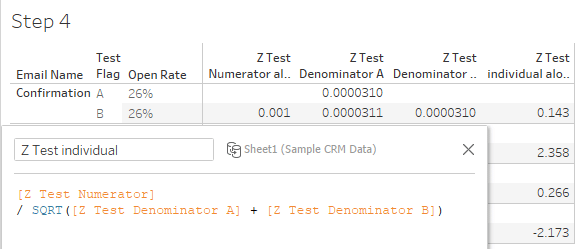
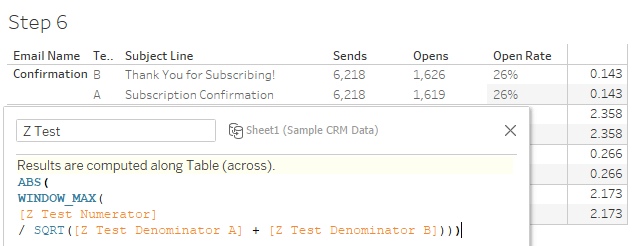
Now that we’ve calculated the Numerator and both parts of the denominator, it’s time to bring them together. Divide the numerator (step 1) by the squareroot of denominator A (step 2) plus denominator B (step 3).
Check the calculations by switching the sort order, moving B before A. The z-tests should change signs and otherwise remain unchanged.
To generalize the significance across both A and B sets, we use Window Max and take the absolute value.
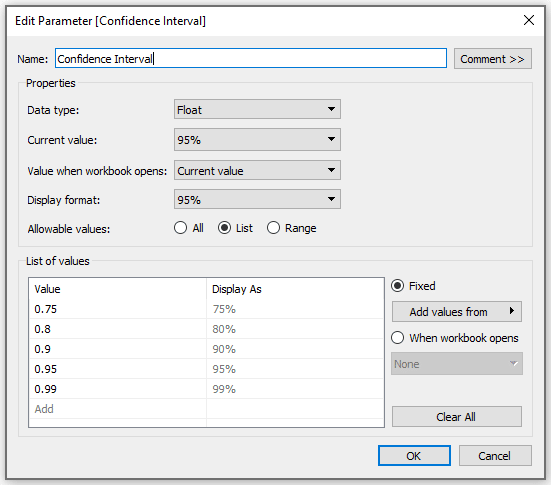
Next, create a confidence interval parameter.
An Introduction to Parameters in Tableau
Comparing z-test results to the z-score
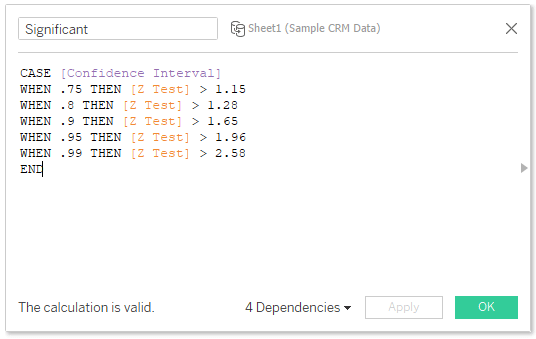
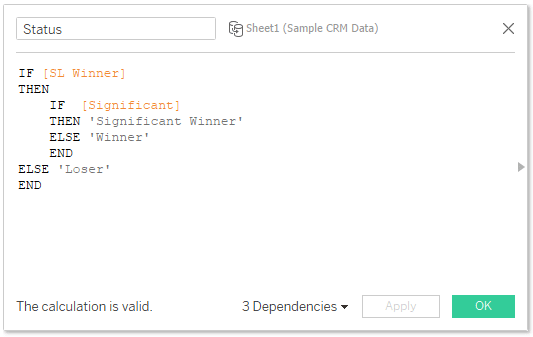
Determine significance by comparing the z-test result to the z-score. The z-score values in the calculation come from lookup tables for two-tailed z-tests. You’ll need to update these values if you want to use a one-tailed test. Then use tSignificance and SL Winner to indicate winners and significant winners.
![]()
Finally set up your worksheet!
For each A/B test we now know which subject line performed better, and whether the test was statistically significant. With this information we can prioritize updating emails and focus future testing on emails with uncertain results. I hope this tutorial saved you some time.
Thanks for reading!
– Felicia

Written By
Felicia Styer

Peer Review
Maddie Dierkes
Manager, Decision Science

Peer Review
Ethan Lang
Director, Analytics Engineering

Graphic Design
Dan Bunker
Manager, Decision Engineering
Related Content
3 Meaningful Ways to Visualize Margin of Error in Tableau
When creating a new dashboard, it is important to add context to our data. While Tableau provides a few good…

Ryan Sleeper
Highlight insights by adding statistical context to your line graphs Do you ever experience unnecessary stakeholder panic or jubilation when…
The Beginner’s Guide to Tableau Table Calculations
Tableau table calculations, while very powerful, can be both tricky and confusing to work with. There are some great benefits…