How to Default to the Most Recent Dynamic Max Date in Tableau

I recently worked on a dashboard with two main filters – Date and Team. The view focused on a single point in time, so the date filter was a single select date dropdown. Each user was interested in just their team’s data. When the workbook was opened, the date filter automatically filtered to the max date in the Tableau dataset, and the team filter automatically selected the user’s team.
Unfortunately, this caused the view to go blank when the most recent date didn’t apply to the user’s team! Users had to update the date filter almost every time they used the workbook, and some thought the view was broken. Instead of the filter defaulting to the most recent date in the dataset, we needed it to select the most recent date relevant to the user. Users also needed to filter the view to older dates occasionally and didn’t want to see any dates irrelevant to their team.
How to Use Dynamic Parameters in Tableau
The solution was a filter based on both a date parameter and the max relevant value (i.e. the most recent date for the user’s team). The filter would try the date parameter first, but if the parameter value was irrelevant it would be overridden with the max relevant date. This filter would never cause the view to go blank – it would always show a date relevant to the user. It automatically shows the most recent date relevant to the user, and the user can see older dates by changing the parameter value. If the dashboard was filtered to another team, the date filter would automatically reset to a relevant date preventing the view from going blank.
This method can be adapted to show the earliest relevant date instead of the most recent. It can also be used on numeric or string filters, e.g. the first relevant Sub-Category when Category is filtered. This method is best suited to single value filters. It will not work for multi-select filters, and could theoretically be extended to work for continuous ranges, but relevancy is less critical for those cases.
![]()
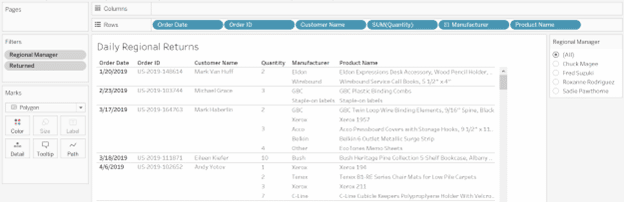
For this tutorial, suppose that Superstore is building a Daily Regional Returns table where each regional manager can quickly access details on the most recent returned products.
Creating the max date relevant value filter
First, let’s set up the worksheet. Add [Order Date], [Order ID], [Customer Name], SUM([Quantity]), [Manufacturer], and [Product Name] to the Rows shelf. Be sure to convert SUM([Quantity]) from Continuous to Discrete. Add [Returned] to the Filters shelf and select TRUE. Finally, add [Regional Manager] to the Filters shelf and set up controls as a single value list. Add both filters to context.
Continue reading with a free account, or login.
Unlock this tutorial and hundreds of other free visual analytics resources from our expert team.
Already have an account? Sign In
By continuing, you agree to our Terms of Use and Privacy Policy.
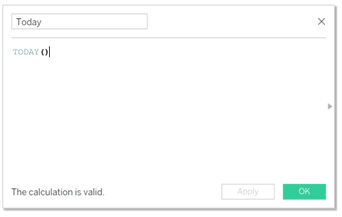
Next, create a calculation that returns the current date using TODAY().
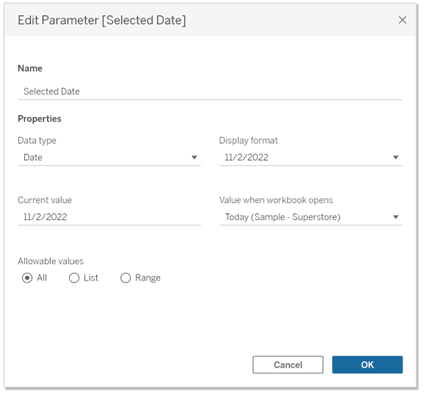
Now we can build a date parameter that defaults to the current date.
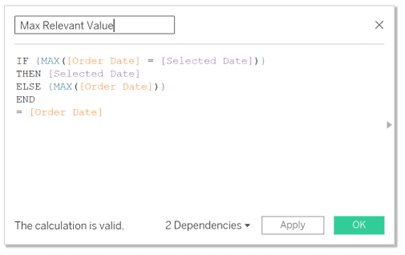
The core of this date filter calculation is {Max([Order Date] = [Selected Date])}. This section will check whether any Order Date values match the date parameter. If there is a match, then the aggregation will be true. The curly braces turn the aggregation into a Fixed LOD, running the aggregation across all rows in context.
The IF statement returns the parameter value when there is a relevant matching Order Date. When there’s no match, it instead returns the maximum Order Date value in context. Whichever date is chosen is then compared to [Order Date].
Adding [Returned] and [Regional Manager] filters to context is critical because it controls how this calculation aggregates the parameter comparison and max date sections.
After building the calculation, test it out by adding it to the Columns shelf of your worksheet. One date should always be true, and the rest false, even as the manager filter is changed. If the date parameter is set to a date in the view, that date should become the TRUE date. Finally, add [Max Relevant Value] to the Filters shelf and include TRUE values only.
Setting up the UX
Now that the filter is working, let’s set up the UX. Our goal is to assemble a dropdown menu of date values using a list of relevant dates, and a frame displaying the date displayed alongside a button to show the list.
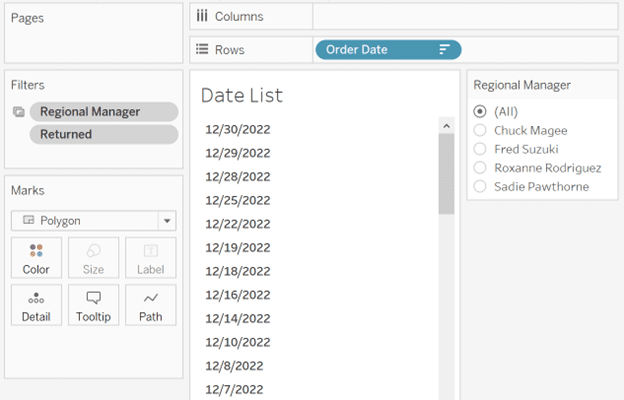
To create the list of relevant dates, duplicate your main worksheet and remove all dimensions except [Order Date] from the Rows shelf. Remove [Max Relevant Value] from the Filters shelf to show all relevant values. Then sort the Order Date values in descending order and hide the header.
Create a third sheet for the dropdown frame. Just like the original returns list sheet, apply the [Returned], [Regional Manager], and [Max Relevant Value] filters. Create two Marks cards by adding Min(-5) and Min(1) to the Columns shelf. The first Marks card, Min(-5), will be our displayed date value and the second will be the button to reveal the date list. Create a synchronized dual axis and fix the axis range to -8 and 2. On the first Marks card, set the Mark type to Text and add [Order Date] to the Label property. On the second, set the Mark type to Shape and change the mark color to something neutral. Finally, format the gridlines, zero line, and borders so that the sheet resembles a dropdown menu.
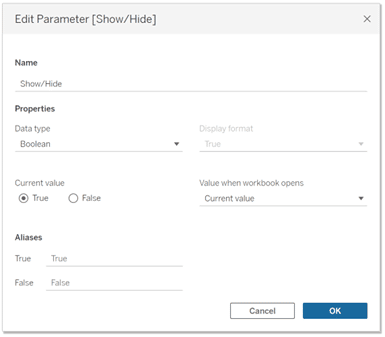
Now that the sheets have been built, we’ll lay the groundwork for a parameter action to show and hide the date list. First set up a Boolean parameter. When the parameter is TRUE, the list will be shown, and when it is FALSE, the list will be hidden.
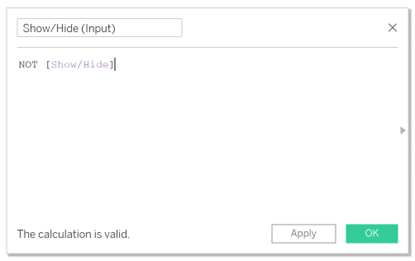
Next, we’ll create a calculation that returns the opposite value of the parameter, using NOT [Parameter Name].
Add this calculation to the Detail property of the second Marks card of the Frame worksheet, and the Detail property of the Date List worksheet. While the parameter is set to TRUE, add the calculation to the Filters shelf of the Date List worksheet and set the filter to include FALSE only. Test the setup by changing the parameter value. The sheet should become empty when the parameter is FALSE.
Setup the dashboard
Bring all three sheets onto your dashboard, positioning the Date List below the Dropdown Frame. Add the Regional Manager filter control if it is not already present. Apply the filter to all sheets on the dashboard to ensure that all three sheets are focused on the selected manager.
![]()
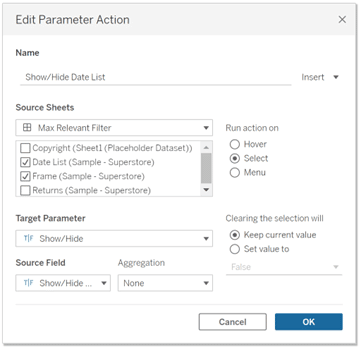
Set up a parameter action using both the Frame and Date List as source sheets, [Show/Hide (input)] as the input value, and the [Show/Hide] parameter as the target.
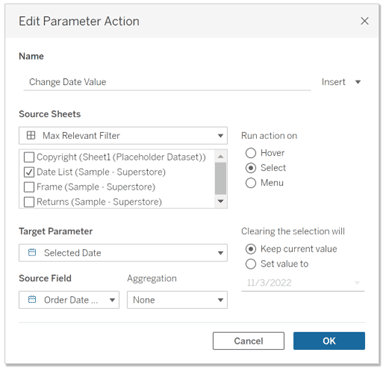
Finally, create a second parameter action using the Date List as the source sheet, [Order Date] as the source field, and [Date Selected] as the target parameter.
Test the actions by clicking on the frame to show and hide the date list, and clicking on a date in the date list to update the display date and hide the list. Now that the dashboard is complete we can see the whole thing in action! As the Regional Manager filter is updated the displayed date changes. The view never goes empty – if the parameter date is not relevant to the manager the most recent relevant date will be displayed instead. Even if the dataset is updated, it will always open to the most recent date.
This approach is a great addition to row-level security. If the Regional Manager filter was a user filter instead, whenever a manager opened the workbook, it would automatically load their most recent date, and the dropdown would only show relevant dates. Using a standard filter or parameter control could get the same effect for the manager with the most recent record, but all other managers would see an empty page until they select a relevant date value.
Thanks for reading,
Felicia


Written By
Felicia Styer

Peer Review
Alyssa Huff
Assoc. Director, Information Design
Related Content
How to Add a Date Period Notification to a Tableau Dashboard
When you show a date filter or the parameter controls for a start date and an end date, the end…
3 Essential Ways to Use Dynamic Parameters in Tableau

Dynamic parameters were introduced with Tableau Desktop version 2020.1 and rightfully created a lot of buzz among Tableau authors due…

Ryan Sleeper
Automatically Compare the Last Two Partial Weeks or Months Ryan shares the three calculated fields required to automatically compare the…