How to Do Button Swapping with Parameters in Tableau
One of the best ways to take a dashboard to the next level is to incorporate interactivity beyond what’s available out of the box in Tableau. One example of this is Tableau button swapping, which allows the use of images to filter marks on a view with separate images for the selected and unselected states of each button. Previously, Ryan shared a post on button swapping utilizing set actions. Today, I’ll walk you through creating the same functionality – but this time using parameters.
How to Show Selections with Button Swapping in Tableau
Set up your images for button swapping in Tableau
By the end of this post, you’ll be able to set up button swapping using parameters for your own dashboard. My example uses images sourced from The Noun Project and the World Indicators dataset from Tableau, but you can use any images and data source you like to follow along. I decided to filter population data by region, so I chose a filled in image to represent a selected region and an outline image to represent an unselected region.
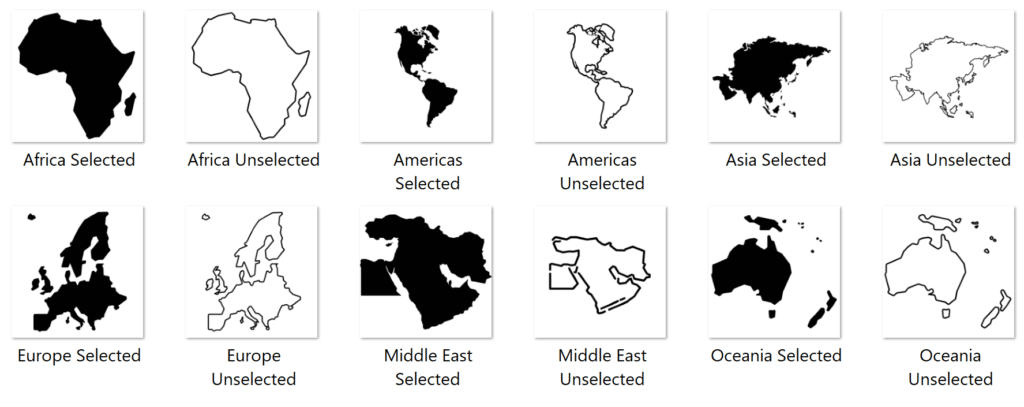
Once you’ve sourced your images, save them to the following location on your computer: Documents > My Tableau Repository > Shapes. Either save your images in an existing folder, or create a new folder and give it a name relevant to your project. I saved my images under a folder named “Geography”.
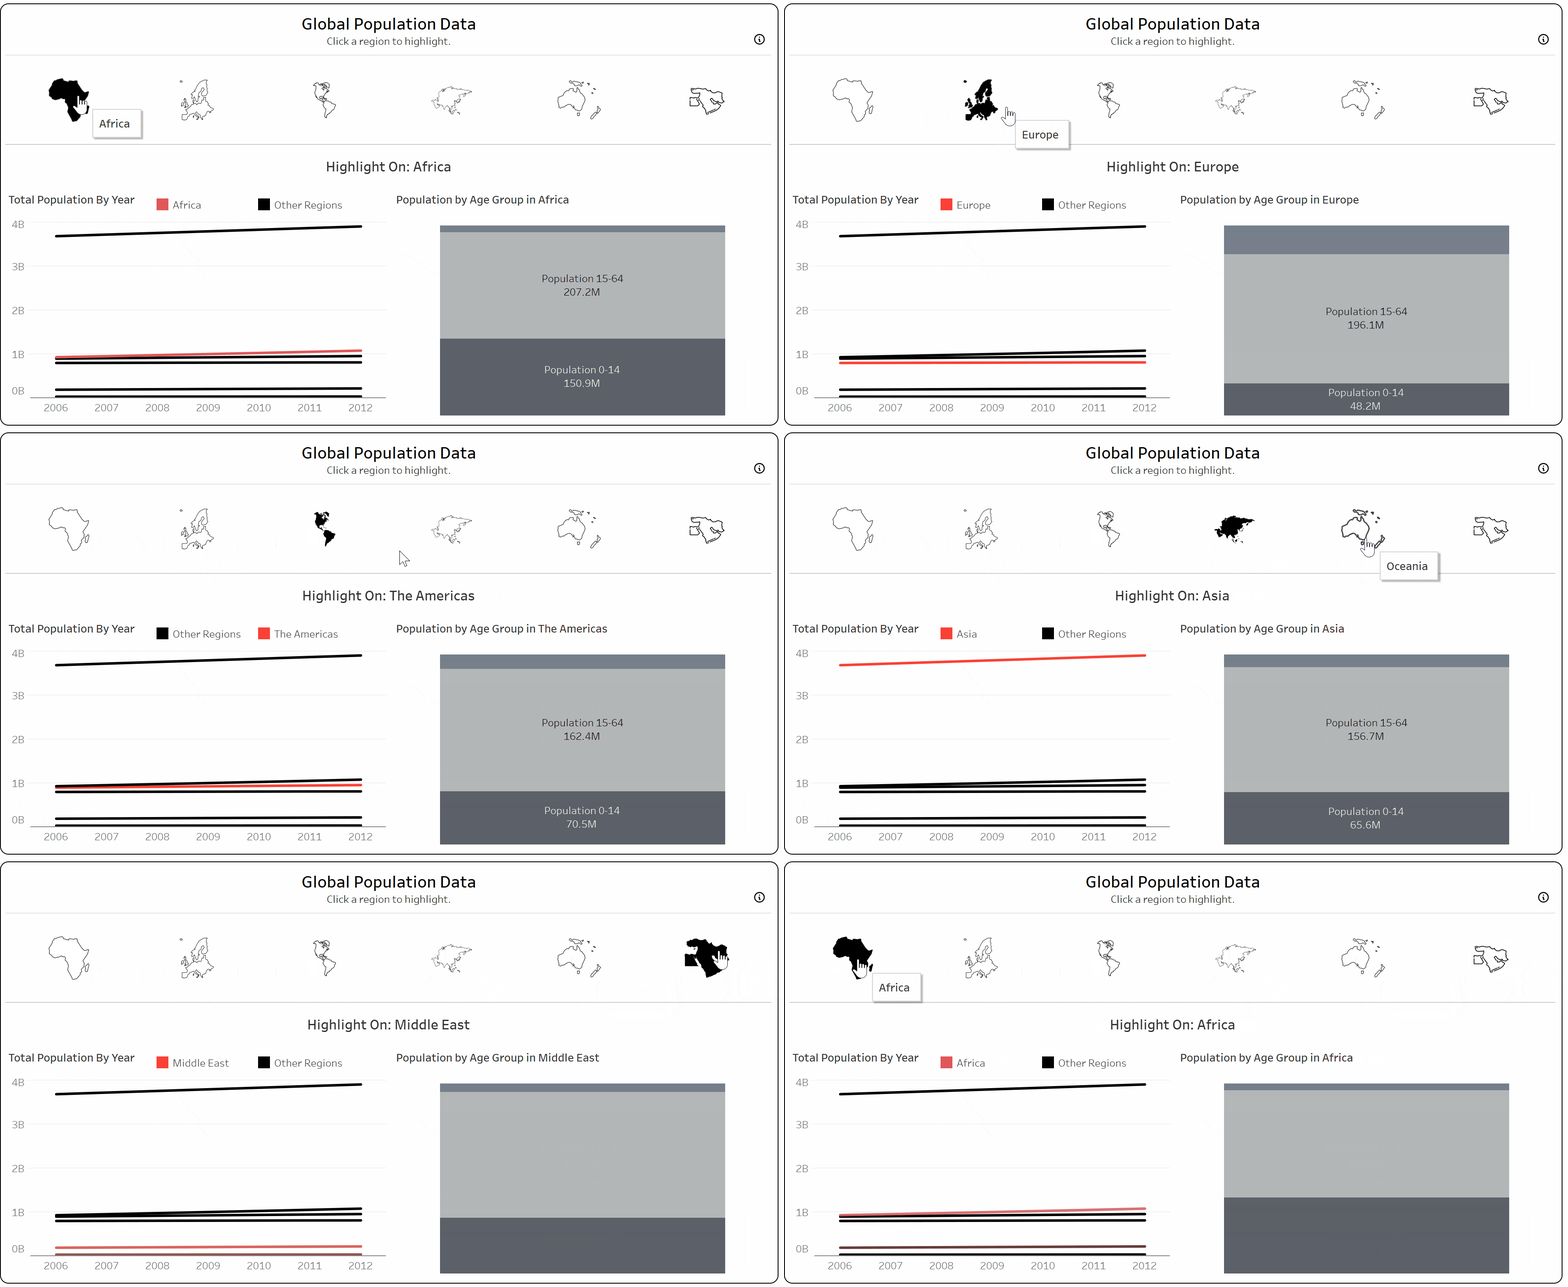
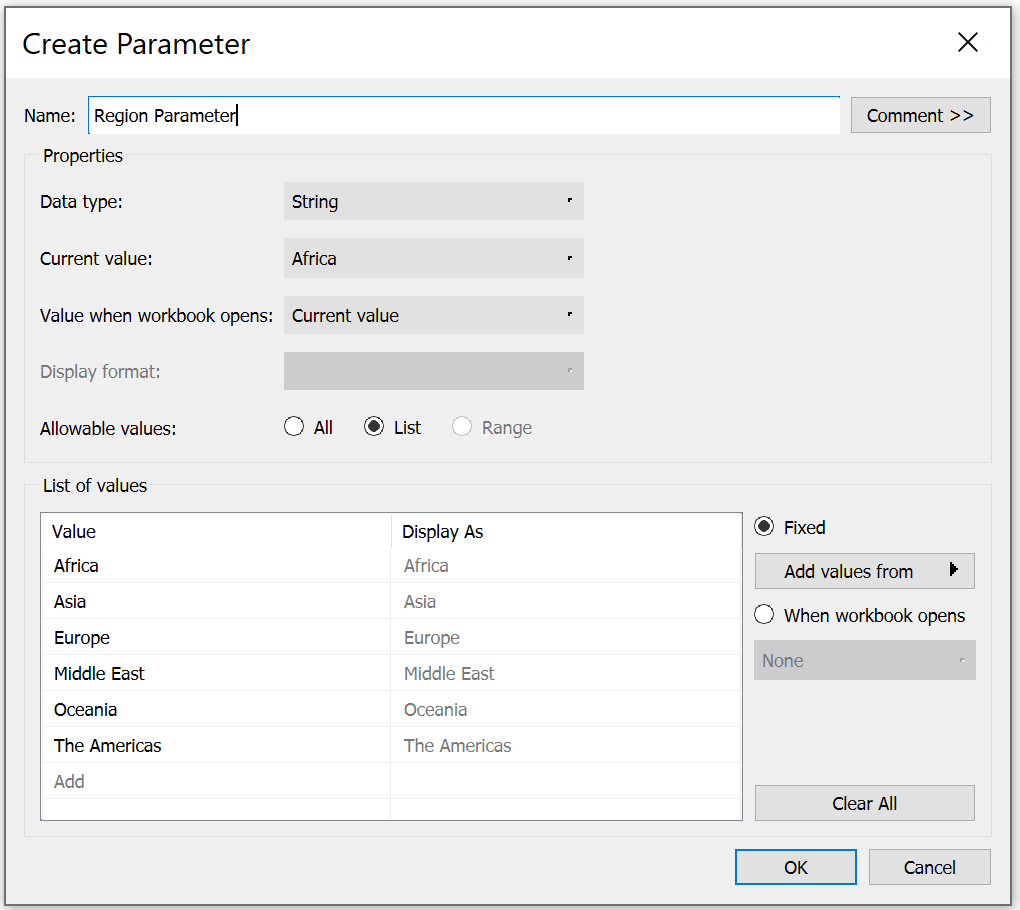
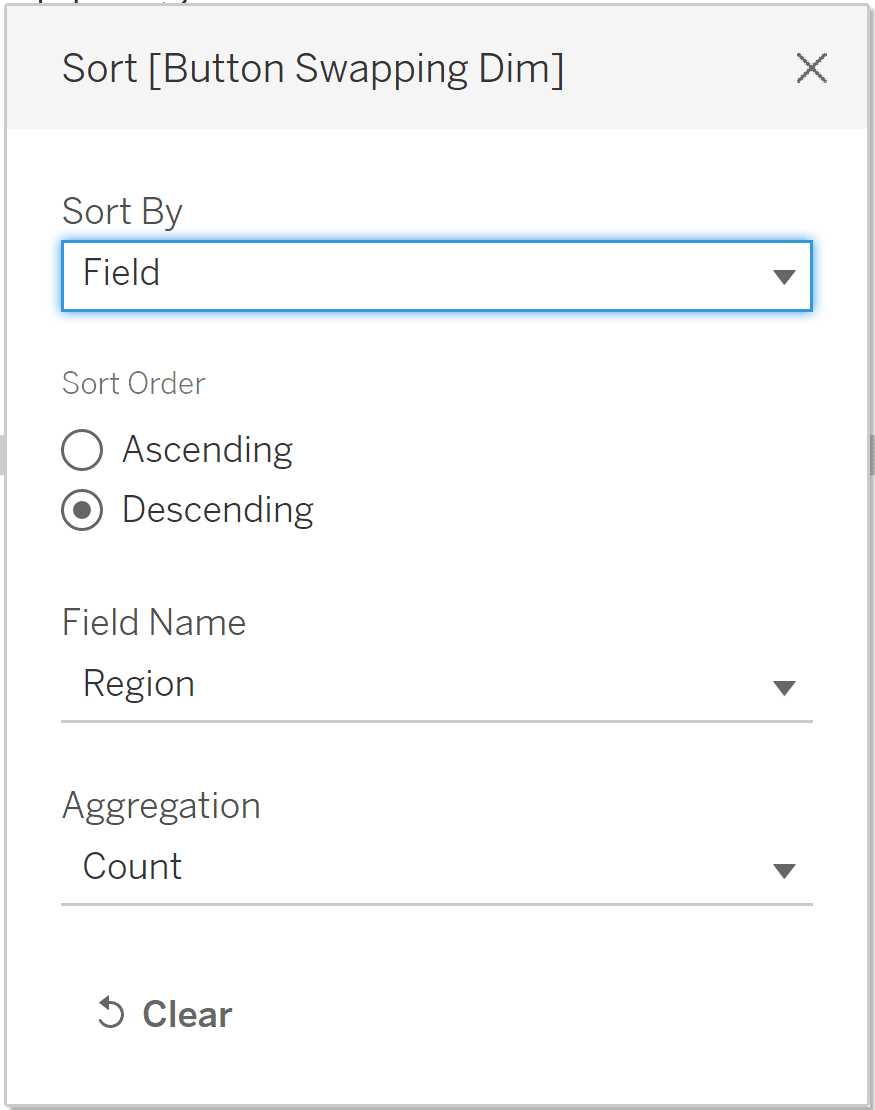
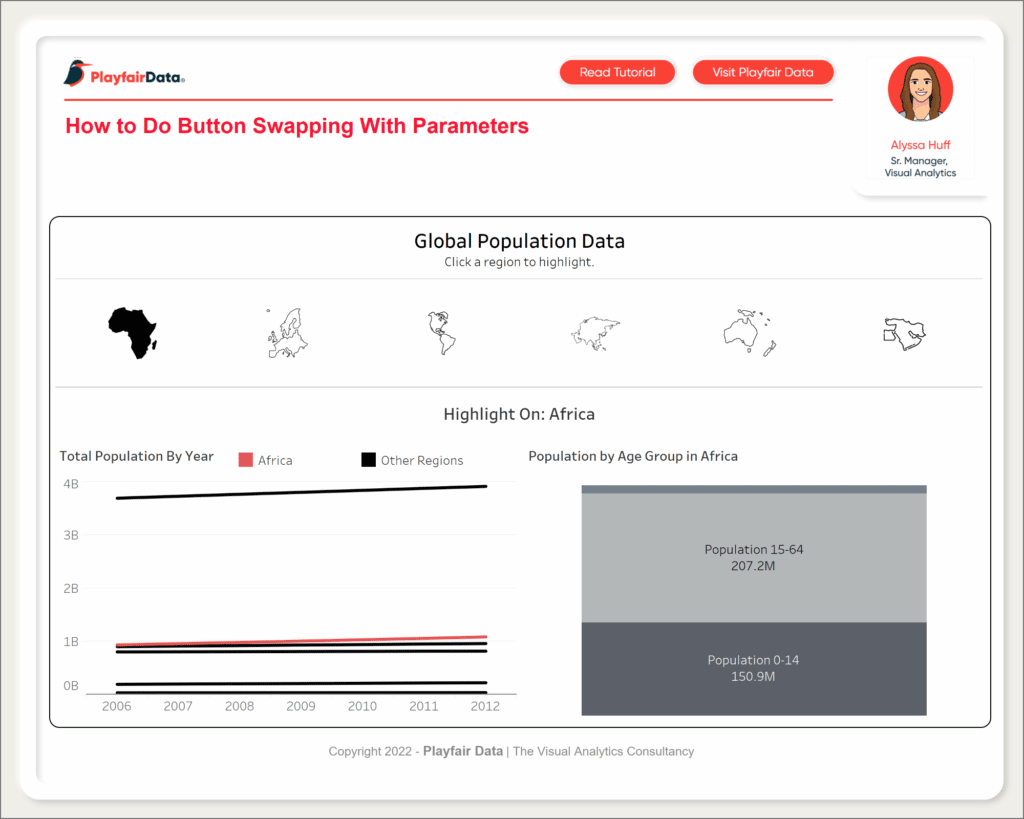
Unlock this tutorial and hundreds of other free visual analytics resources from our expert team. Already have an account? Sign In To set up the infrastructure of this interactivity, we’ll first set up a parameter. Later on, we’ll use this parameter to set up a dashboard action that will allow us to click a button, swap the image to represent a selected state, and filter the dashboard on that dimension. To do this, I’ll right-click on the Region dimension, hover over “Create”, and choose “Parameter”. I renamed my parameter “Focus Region”, but choose whatever name makes sense to you. Everything else in the parameter settings will remain as is. Next, I set up two calculated fields. The first is a Boolean calculation that checks whether or not a region equals the parameter selection. The logic is as follows: [Region]=[Focus Region] The second calculation creates the button swapping effect by placing a “t” or an “f” in front of the Region name. A “t” will represent the selected state since one dimension member will match our parameter selection, and the remaining dimension members will be assigned an “f”. Since only one Region can be selected at a time with the parameter, I’ll use this on the Shape property of the Marks Card to denote a selected or unselected Region by assigning the custom shape palette accordingly. I’ll go into more detail in the next step. I named this calculation “Button Swapping Dim”, and here’s the logic: STR([Region Filter])+[Region] Now we’ll set up our control sheet that will contain our buttons and can be used to filter our dashboard. On your sheet set the Mark type to Shape. Drag the Button Swapping Dim onto the Columns shelf and the Shape property of the Marks card. Tableau will choose the default shapes for our buttons, so next we need to map our custom shapes to the correct dimension members in our view. To do this, click Shape on the Marks card and select the custom shape palette you created. If you already had Tableau open while you created your shape palette, click “Reload Shapes” and your palette will appear in the dropdown. Show the parameter control on your sheet and swap through each value in the parameter to map all of the selected and unselected state images. Note the “t” and “f” in front of your dimension members, and remember that “t” denotes the selected state of a button. Here’s what my view looks like with all my shapes mapped and Africa selected: As you click through your buttons, you’ll see that they change positions on your view. This is due to the default sort order Tableau applies, and it isn’t the best user experience. To ensure your buttons stay in the same order, right click on the Button Swapping Dim on the Columns shelf and click “Sort”. Instead of the default, sort by Field, and choose your focus dimension (Region in my case). I chose to sort in descending order, but pick whatever makes the most sense for your view. To get this to work with the parameter action in the next step, we need to add Region to the Detail property of the Marks card.
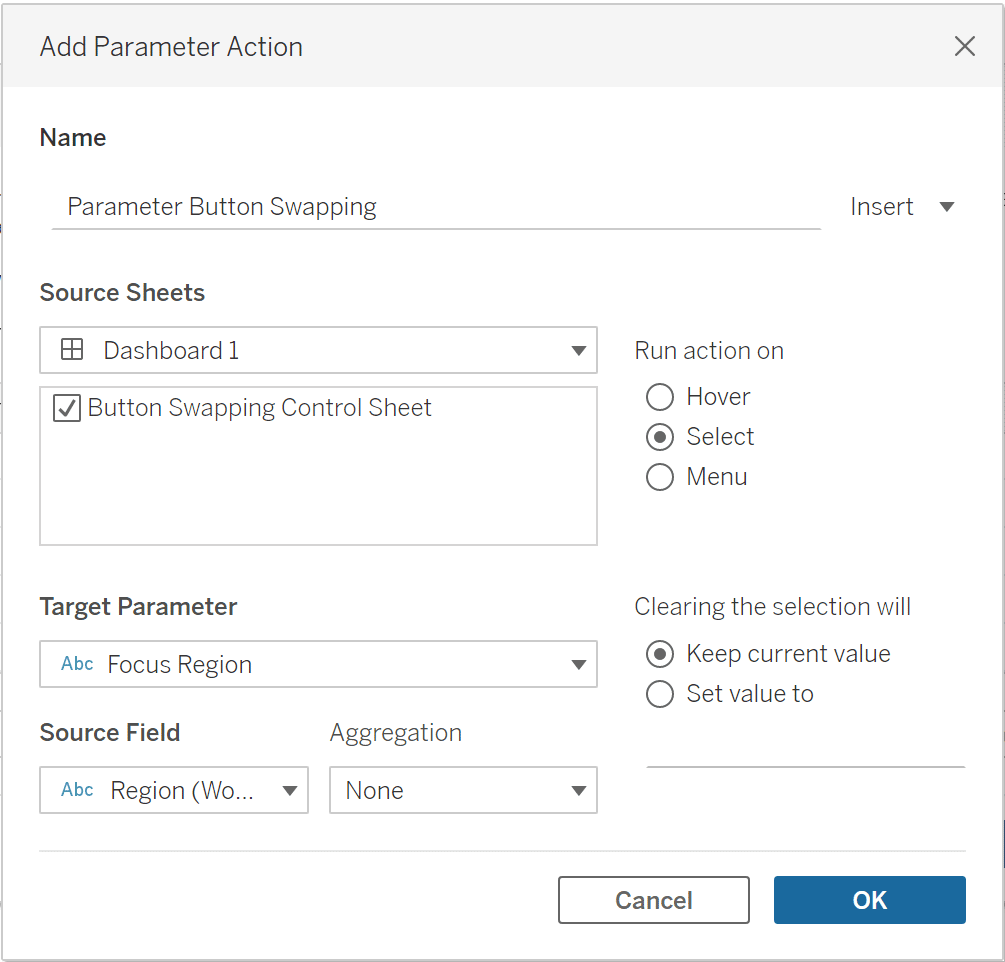
The final step in this process is to add the control sheet to the dashboard and set up a parameter action to create the interactivity. Click “Dashboard” and then “Actions” from the toolbar at the top of the screen. Click “Add Action” and choose “Change Parameter”. For your source sheet, pick your button swapping control sheet, and run the action on Select. Select your target parameter, in my case it’s called “Focus Region”, and add your source field, which for me is Region. Behind the scenes, Tableau is adding a “t” or “f” in front of the dimension member based on your selection. This swaps the button image you see as you change the highlighted dimension member with each click. Additionally, as you click through the buttons on your control sheet, the other views on your dashboard will filter as well. Voila, button swapping with parameters!Create a free account, or login.
Set up parameter and calculated fields for button swapping in Tableau
Set up your control sheet

Create your dashboard and add interactivity
Happy vizzing,
Alyssa
Related Content
How to Do Advanced Dynamic Zone Visibility in Tableau
Released with version 2022.3, Dynamic Zone Visibility is a relatively new feature in Tableau. In a previous post, Playfair Data…
3 Creative Ways to Use Tableau Parameter Actions
I have always described Tableau parameters as a Swiss Army knife due to their infinite applications. In case you are…
Ryan Sleeper
Data source filters > context filters > dimension filters > measure filters See how the different types of Tableau filters…


