How to Do Customer Segmentation with Dynamic Clustering in Tableau

Tableau has a few different built-in analytics features that allow you to both summarize and model your data in various ways. One of those features is clustering. Tableau clustering uses K-Means as the clustering algorithm and groups data based on the mean values of the cluster. Tableau clustering allows you to group and find underlying trends in your data. However, the built-in clustering does so based on the dimensions in the view.
Why is that an issue? For instance, let’s say I want to explore customer segmentation. Then I would want to cluster my customers into groups and explore those groups at a high level. Unfortunately, I am not able to do that with the built-in clustering because if I remove customers from the view, I will lose the clusters as well.
In this blog I am going to show how to manually cluster your data and allow you to dynamically update them. This example will use a simplified version of the k-nearest neighbors algorithm, where we will cluster data points based on their distance to the center point of a cluster. Be warned, this blog will contain some simple regex calculations, but it should be easy to follow.
Create parameters
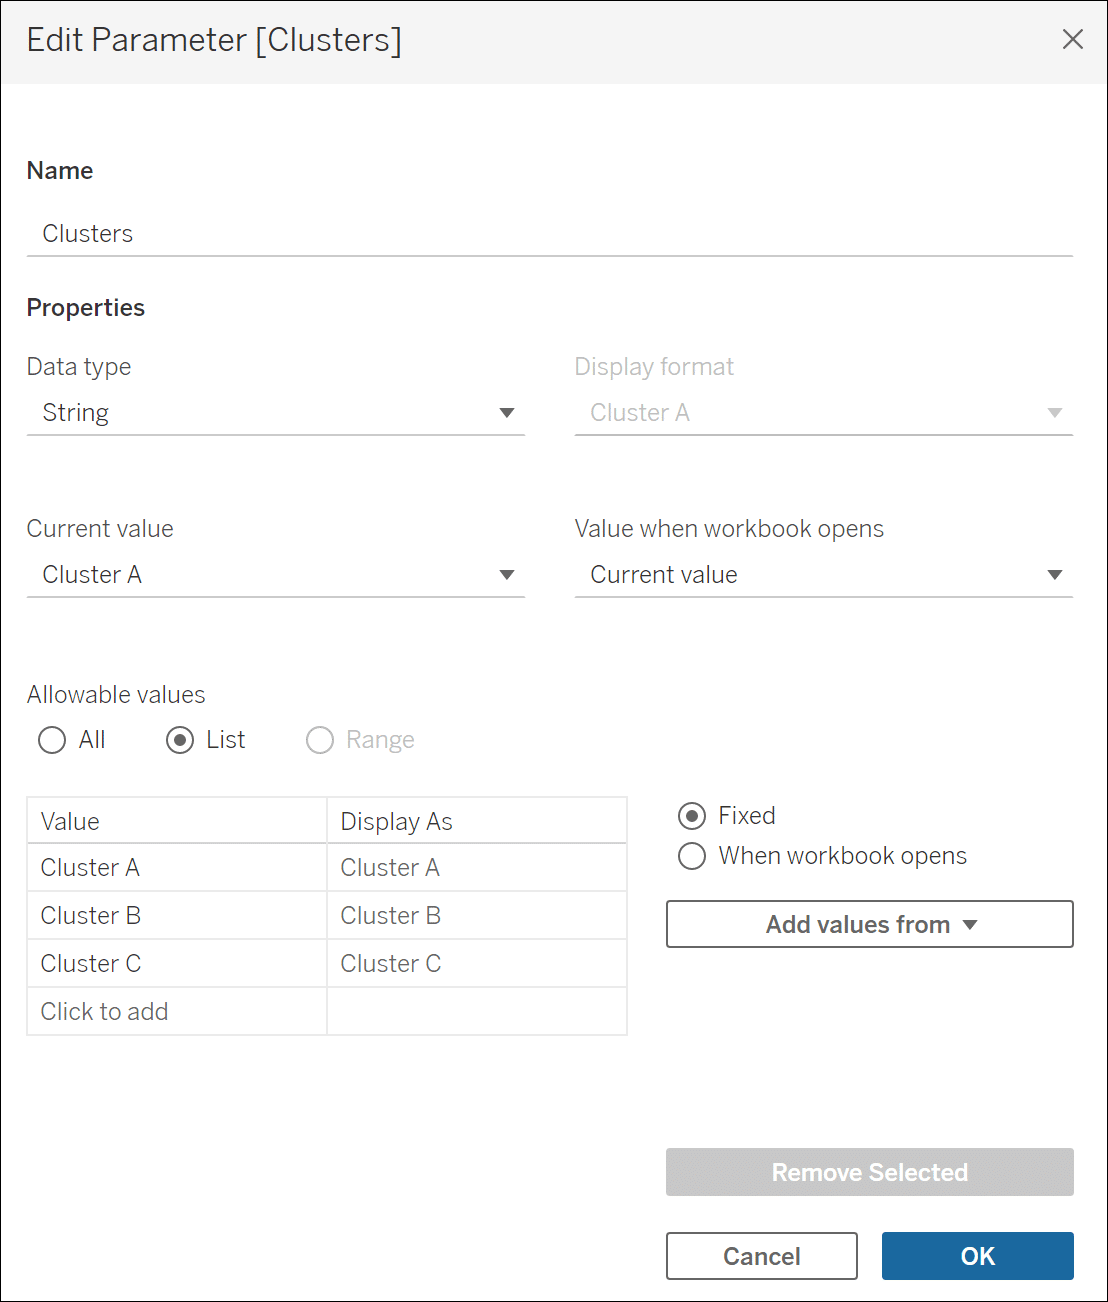
To begin, I am going to load in the Superstore data set and create a few different parameters. The first parameter is a String parameter that contains the names of your clusters. For this example, I am going to create three clusters. If you want more, make sure to account for them in this parameter list.
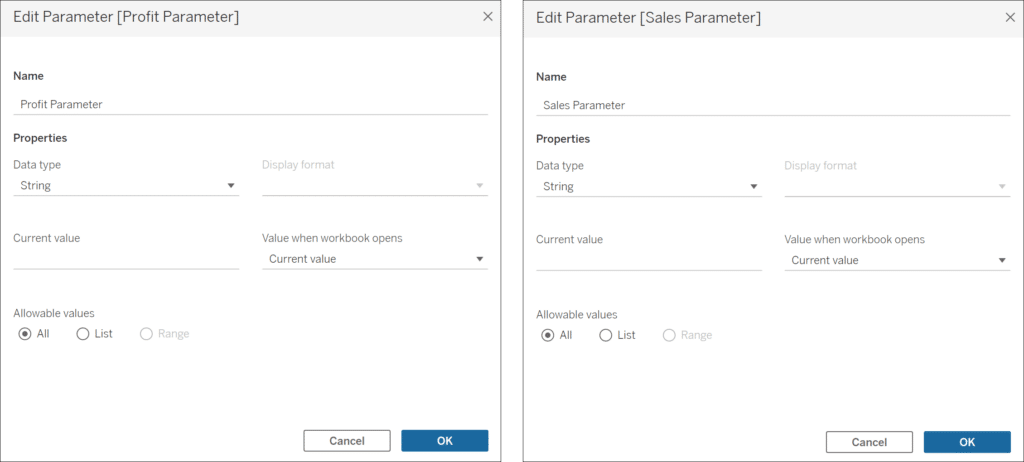
Next, I am going to create two empty String parameters. In this example, I want to cluster my customers based on their total sales and total profit, so I need a parameter to house the center point of each cluster for both profit and sales.
![]()
These parameters will be the source of our regex calculations that we will need later on in this tutorial.
Continue reading with a free account, or login.
Unlock this tutorial and hundreds of other free visual analytics resources from our expert team.
Already have an account? Sign In
By continuing, you agree to our Terms of Use and Privacy Policy.
Creating clusters
Now I am going to begin creating the calculations. First, I am going to create two LOD calculations Fixed on Customer Name: one for sum of Profit, and one for sum of Sales.
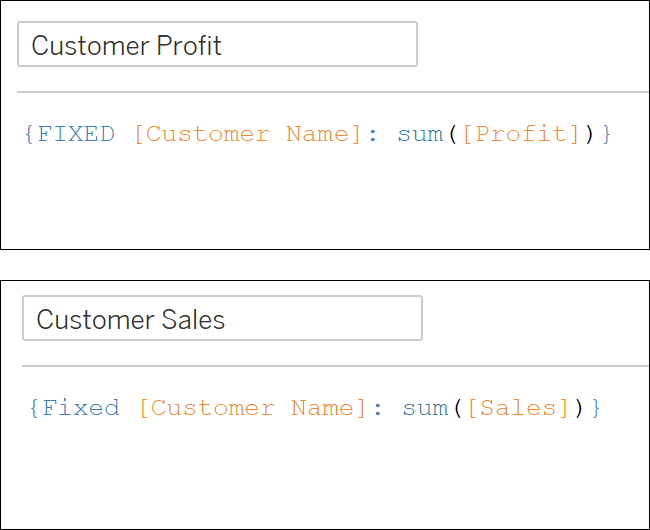
{FIXED [Customer Name]: sum([Profit])}
{FIXED [Customer Name]: sum([Sales])}
These calculations will be important when creating the center points for the clusters. Now I am going to create two calculations for the string values we will add to our Sales and Profit parameters:
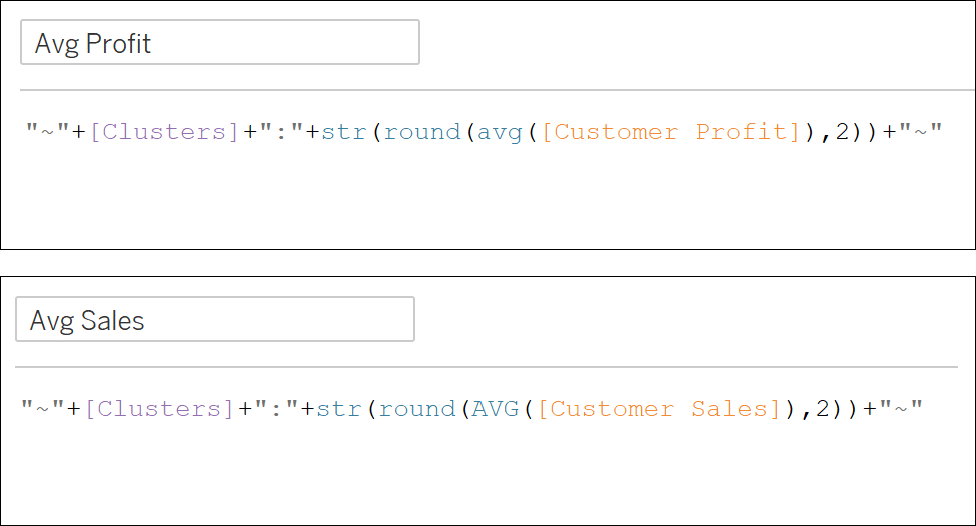
“~”+[Clusters]+”:”+str(round(avg([Customer Profit]),2))+”~”
“~”+[Clusters]+”:”+str(round(AVG([Customer Sales]),2))+”~”
The calculations concatenate a tilde, the name of the cluster chosen in our Cluster parameter, the average of our Customer Sales and Profit LODs, and another tilde. The goal here is to use the Sales and Profit parameters created earlier to store the center points for our clusters. We will use the Clusters parameter to choose a specific cluster, then use the Avg Sales and Avg Profit calculations to set that specific cluster’s centerpoint. We are able to accomplish this with dashboard actions later on, but first, we will need to create calculations that will allow us to append the value to the parameter, or if the selected cluster already has a stored center point, replace it.
First, create the append calculation, which will simply concatenate the current parameter value and the value of Avg Profit or Avg Sales:
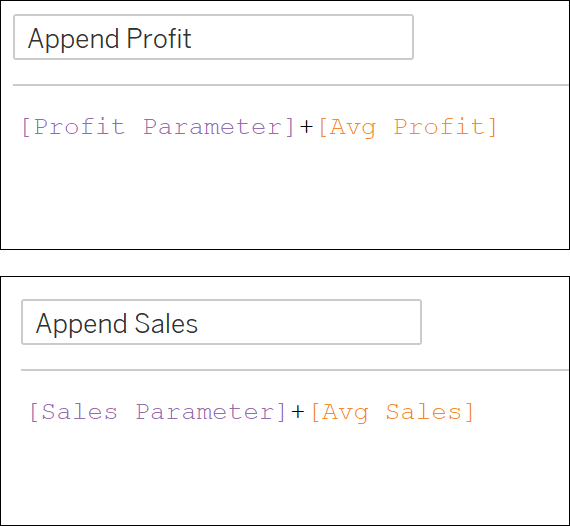
[Profit Parameter]+[Avg Profit]
[Sales Parameter]+[Avg Sales]
Now we need to be able to replace the value for a cluster if it already exists in the parameter string. To do so, we will need to utilize Regex. I won’t get too into the weeds on regex but for more detailed information check out this blog by Ken and Kevin Flerlage on regex. First, I want to extract the entire string for that cluster. I will do so using these equations:
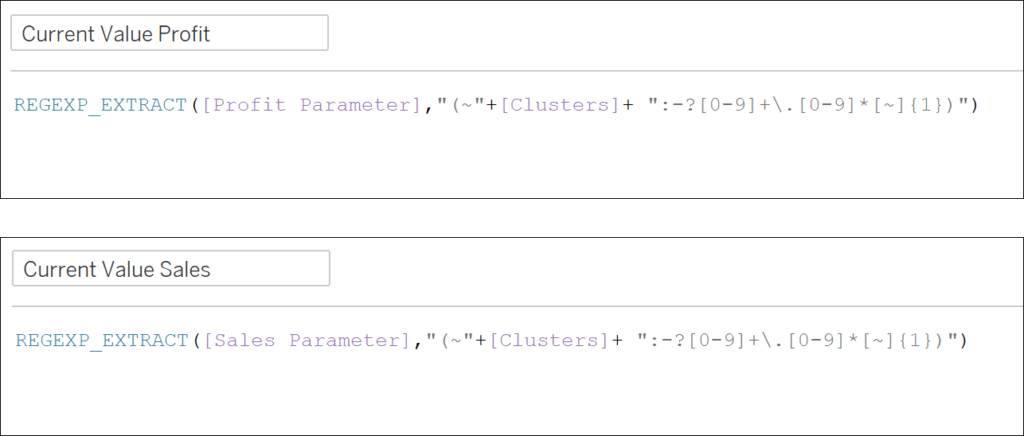
REGEXP_EXTRACT([Profit Parameter],”(~”+[Clusters]+ “:-?[0-9]+\.[0-9]*[~]{1})”)
REGEXP_EXTRACT([Sales Parameter],”(~”+[Clusters]+ “:-?[0-9]+\.[0-9]*[~]{1})”)
These equations are parsing through the parameters to match the pattern after the equation. Basically, they are saying that the start of the string will be a tilde followed by the selected cluster, a colon, and then any combination of numbers including decimal. Then the end will be marked by another tilde. Now I will create the equations that replace that value with the new center point:
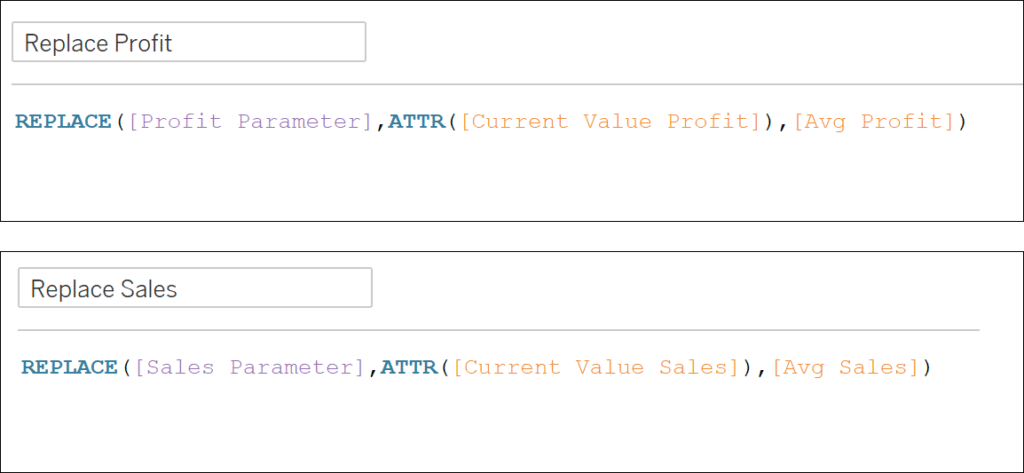
REPLACE([Profit Parameter],ATTR([Current Value Profit]),[Avg Profit])
REPLACE([Sales Parameter],ATTR([Current Value Sales]),[Avg Sales])
Now we can use those two calculations to create the equation that will check if the parameter contains the chosen cluster and then either append the new value to the parameter, or replace the old value:
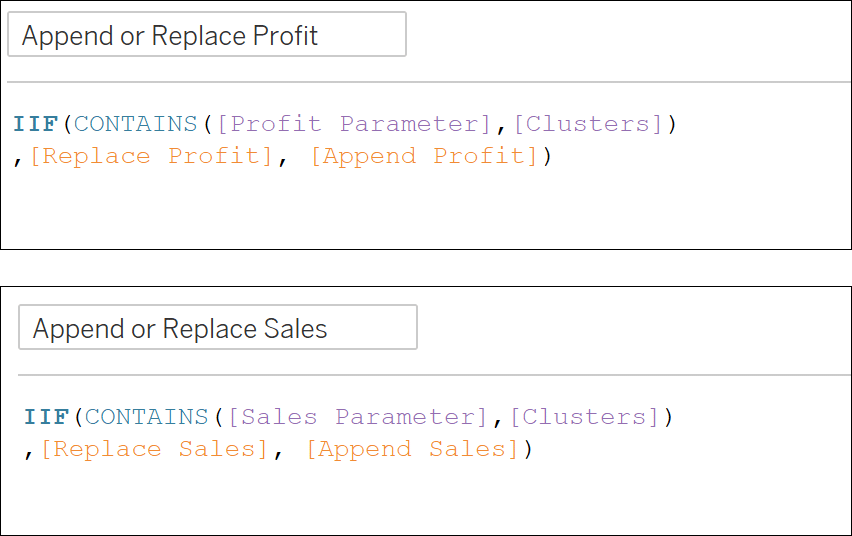
IIF(CONTAINS([Profit Parameter],[Clusters])
,[Replace Profit], [Append Profit])
IIF(CONTAINS([Sales Parameter],[Clusters])
,[Replace Sales], [Append Sales])
Assigning Tableau clusters
Next, we need to assign the customers to a cluster. After we have three center points in our parameters (I will show you the UX for that when we create the dashboard), we will need to find the distance between each customer and each center point and assign it to the nearest cluster. First, create six calculations that will extract the Profit and Sales centerpoints for each cluster. Since I have three clusters and am clustering based on two dimensions, I will have six calculations. If I wanted five clusters based on three dimensions, I would have to create 15 calculations, so this method does have its limitations:
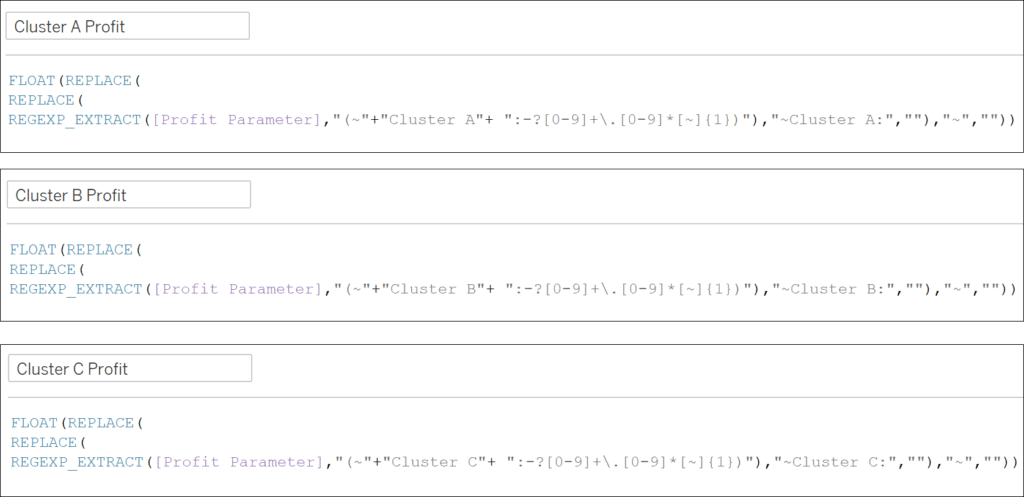
FLOAT(REPLACE(
REPLACE(
REGEXP_EXTRACT([Profit Parameter],”(~”+”Cluster A”+ “:-?[0-9]+\.[0-9]*[~]{1})”),”~Cluster A:”,””),”~”,””))
FLOAT(REPLACE(
REPLACE(
REGEXP_EXTRACT([Profit Parameter],”(~”+”Cluster B”+ “:-?[0-9]+\.[0-9]*[~]{1})”),”~Cluster B:”,””),”~”,””))
FLOAT(REPLACE(
REPLACE(
REGEXP_EXTRACT([Profit Parameter],”(~”+”Cluster C”+ “:-?[0-9]+\.[0-9]*[~]{1})”),”~Cluster C:”,””),”~”,””))
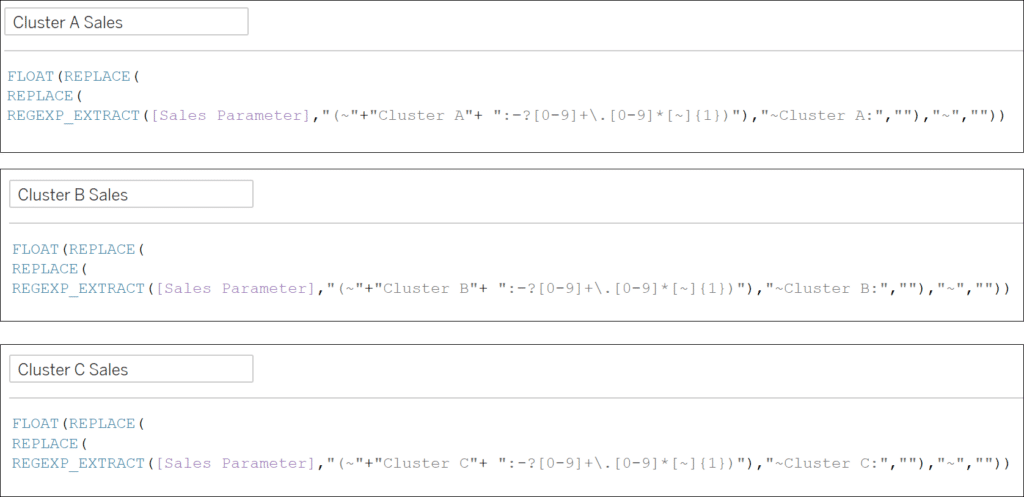
FLOAT(REPLACE(
REPLACE(
REGEXP_EXTRACT([Sales Parameter],”(~”+”Cluster A”+ “:-?[0-9]+\.[0-9]*[~]{1})”),”~Cluster A:”,””),”~”,””))
FLOAT(REPLACE(
REPLACE(
REGEXP_EXTRACT([Sales Parameter],”(~”+”Cluster B”+ “:-?[0-9]+\.[0-9]*[~]{1})”),”~Cluster B:”,””),”~”,””))
FLOAT(REPLACE(
REPLACE(
REGEXP_EXTRACT([Sales Parameter],”(~”+”Cluster C”+ “:-?[0-9]+\.[0-9]*[~]{1})”),”~Cluster C:”,””),”~”,””))
These equations extract the entire string for each cluster, from tilde to tilde. I am using Replace to remove any part of the string that isn’t the centerpoint value. Then the equation converts the remaining string to a Float.
Now that we have our centerpoints, we will need to calculate the distance from each customer’s Sales and Profit to each center point. We will be doing so using the equation for Euclidean distance:
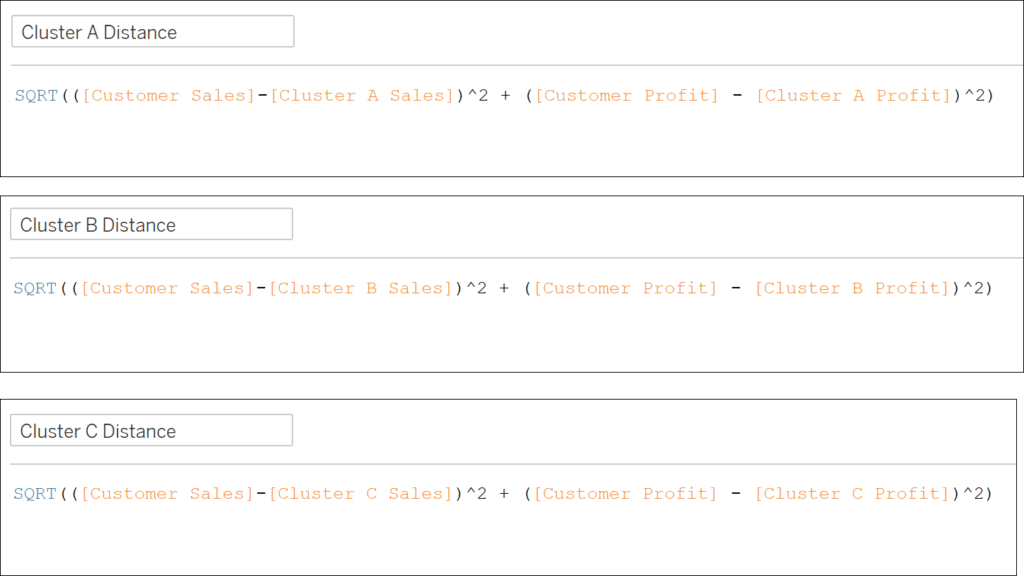
SQRT(([Customer Sales]-[Cluster A Sales])^2 + ([Customer Profit] – [Cluster A Profit])^2)
SQRT(([Customer Sales]-[Cluster B Sales])^2 + ([Customer Profit] – [Cluster B Profit])^2)
SQRT(([Customer Sales]-[Cluster C Sales])^2 + ([Customer Profit] – [Cluster C Profit])^2)
Then calculate the min distance between each of the distance values:
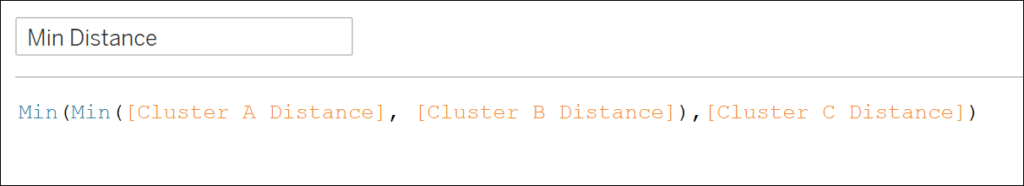
Min(Min([Cluster A Distance], [Cluster B Distance]),[Cluster C Distance])
Finally, create the calculator that will assign each customer a cluster based on which distance is equal to the minimum distance:
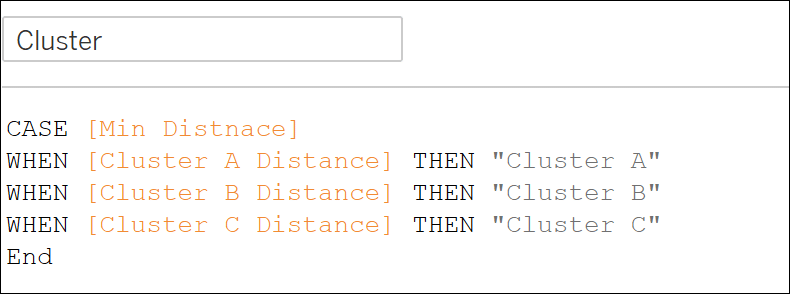
CASE [Min Distance]
WHEN [Cluster A Distance] THEN “Cluster A”
WHEN [Cluster B Distance] THEN “Cluster B”
WHEN [Cluster C Distance] THEN “Cluster C”
End
Dashboard creation for Tableau clustering
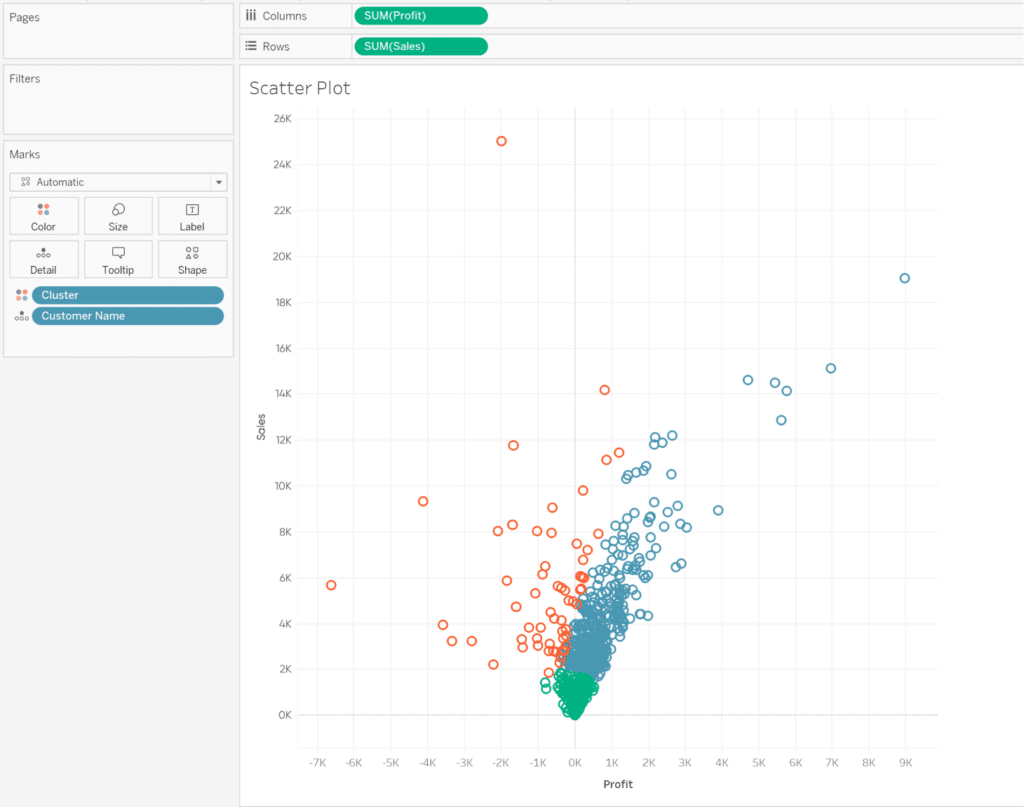
Now that we have all of our calculations, we need to assemble our dashboard. First, create a scatter plot. Drag Profit to the Columns shelf and Sales to the Rows shelf. You can switch these if you like, this is just my preference. Drag customer to the Detail property of the Marks card and Cluster to Color. There you have your customers segmented into different clusters. Open up a dashboard and add it to the view:
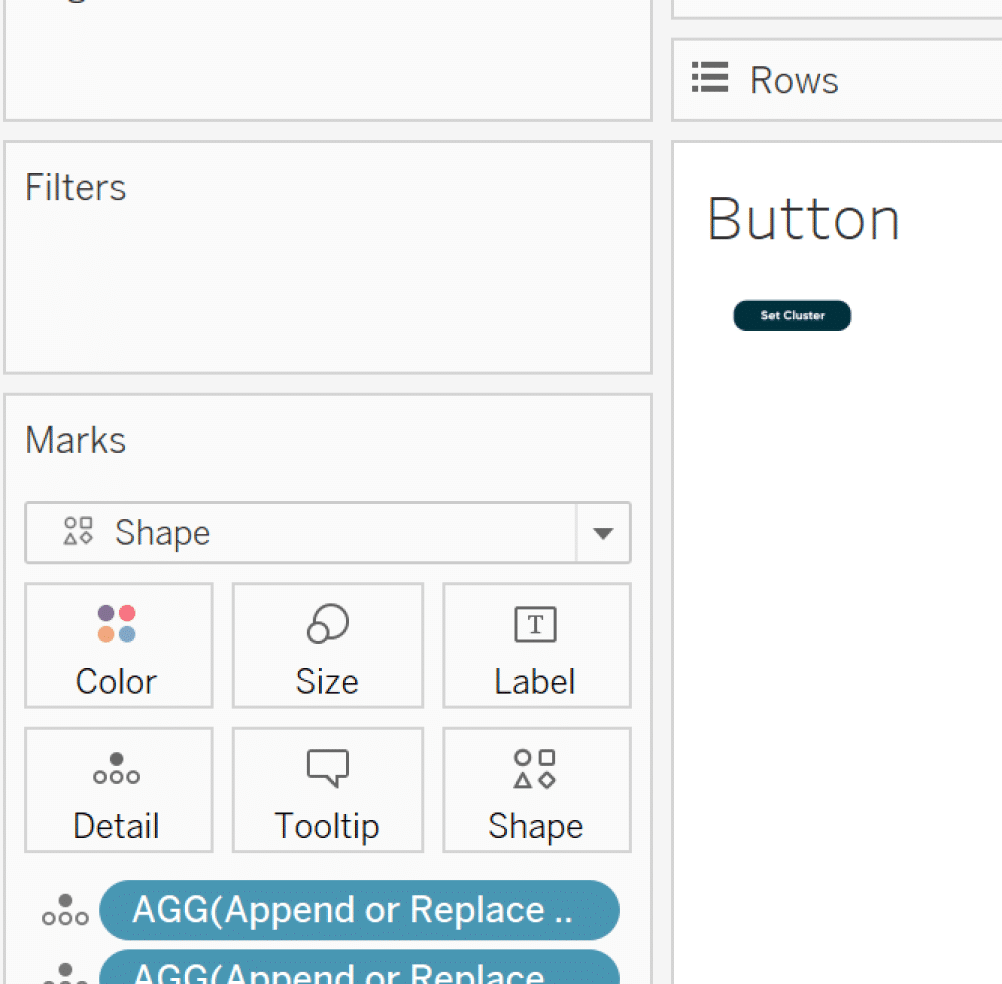
Now create another sheet and drag both the Profit and Sales Append and Replace equations to the Detail property of the Marks card. Change the Mark type to Shape. I created a button that says “Set Cluster” but use any shape you would like.
Add it to the dashboard:
This next step is optional, but I am going to create a simple text table showing the Average of both the Customer Sales and Customer Profit fields so I can see on the dashboard what I am setting as my centerpoints. Add it to the dashboard:
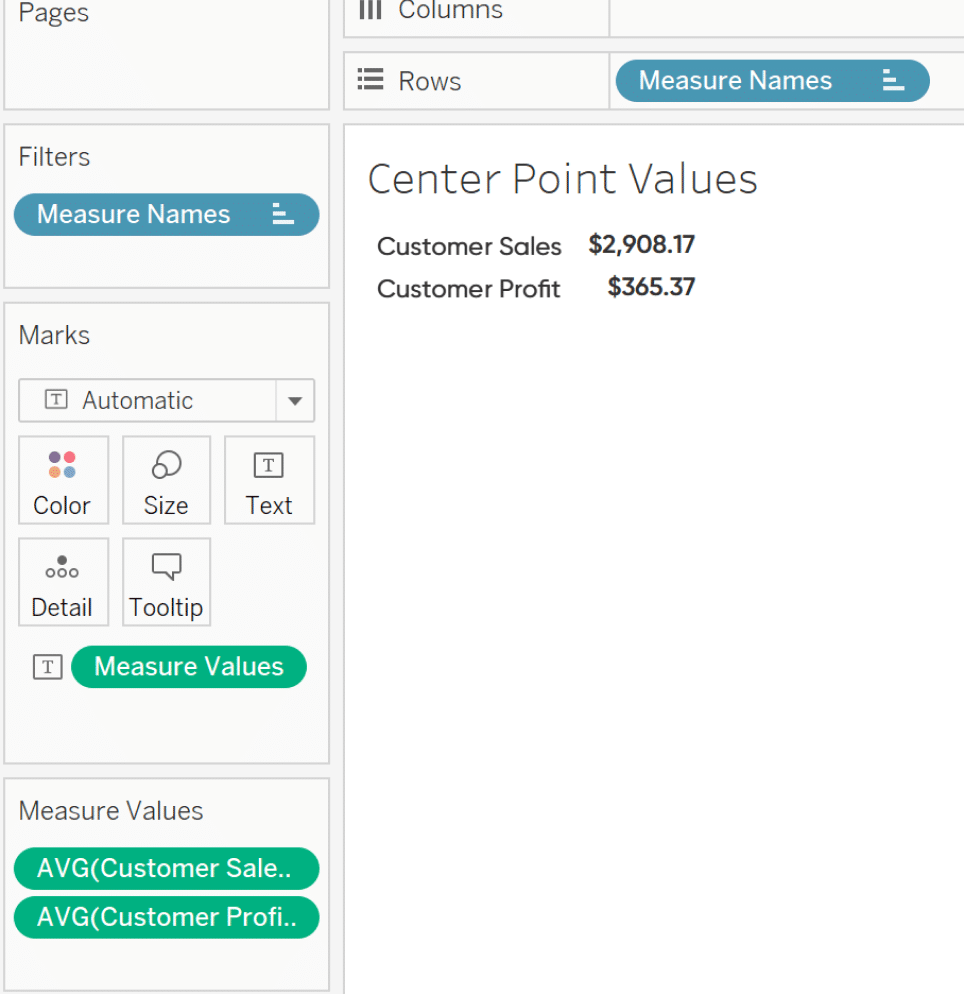
Finally, we will create three dashboard actions. The first is a filter action using the scatter plot to filter the Button Sheet and Centerpoint Values sheet . The user can highlight a section of the scatter plot and then set the average of those customers as the centerpoint for the selected cluster:
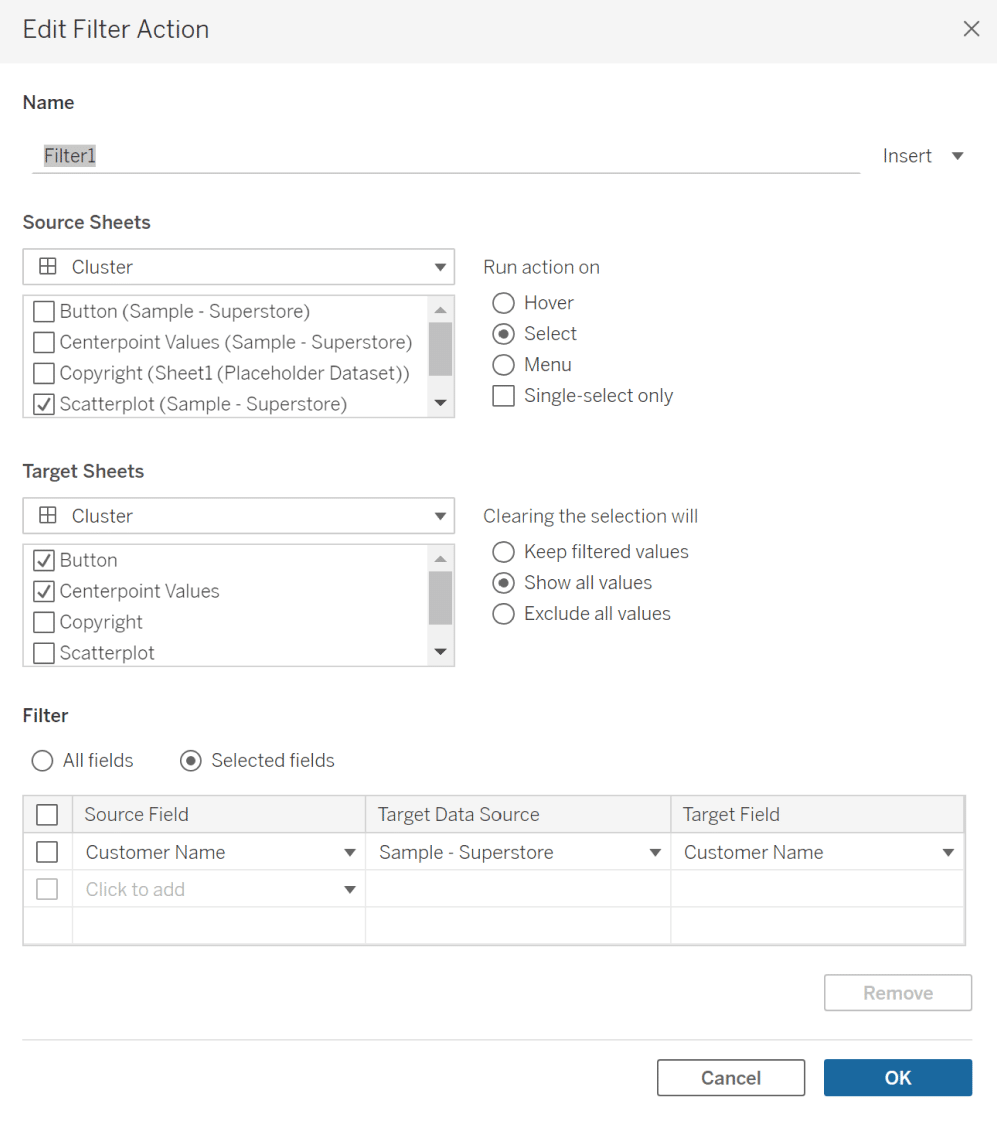
Make sure the Run Action on is set to Select and Clearing the Selection will be set to Show All Values. Also, change the filter to Selected Fields and make both the Source and Target Field Customer Name.
An Introduction to Tableau Dashboard Actions
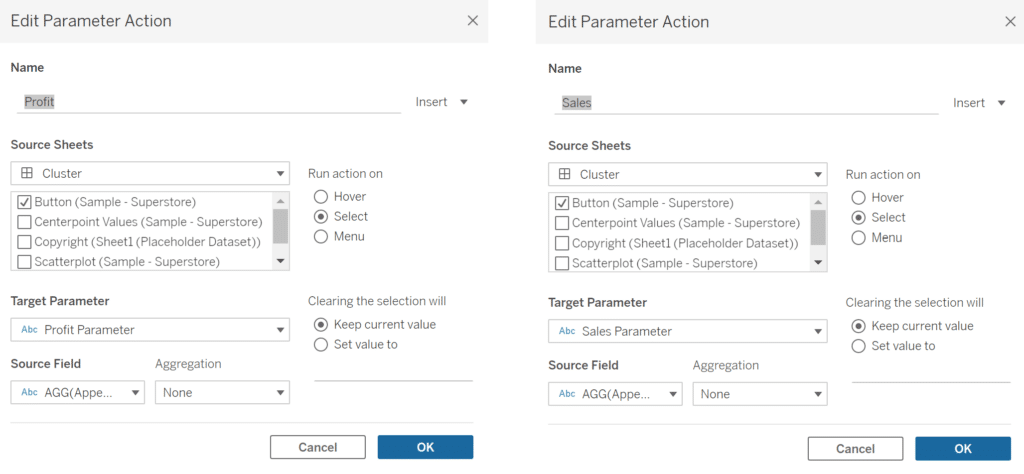
Next, create two parameter actions with the Button sheet as the Source Sheet. Use the Profit and Sales Parameters as the Target Parameters, and then use the corresponding Append or Replace calculation as the Source field:
How to Use Tableau Parameter Dashboard Actions
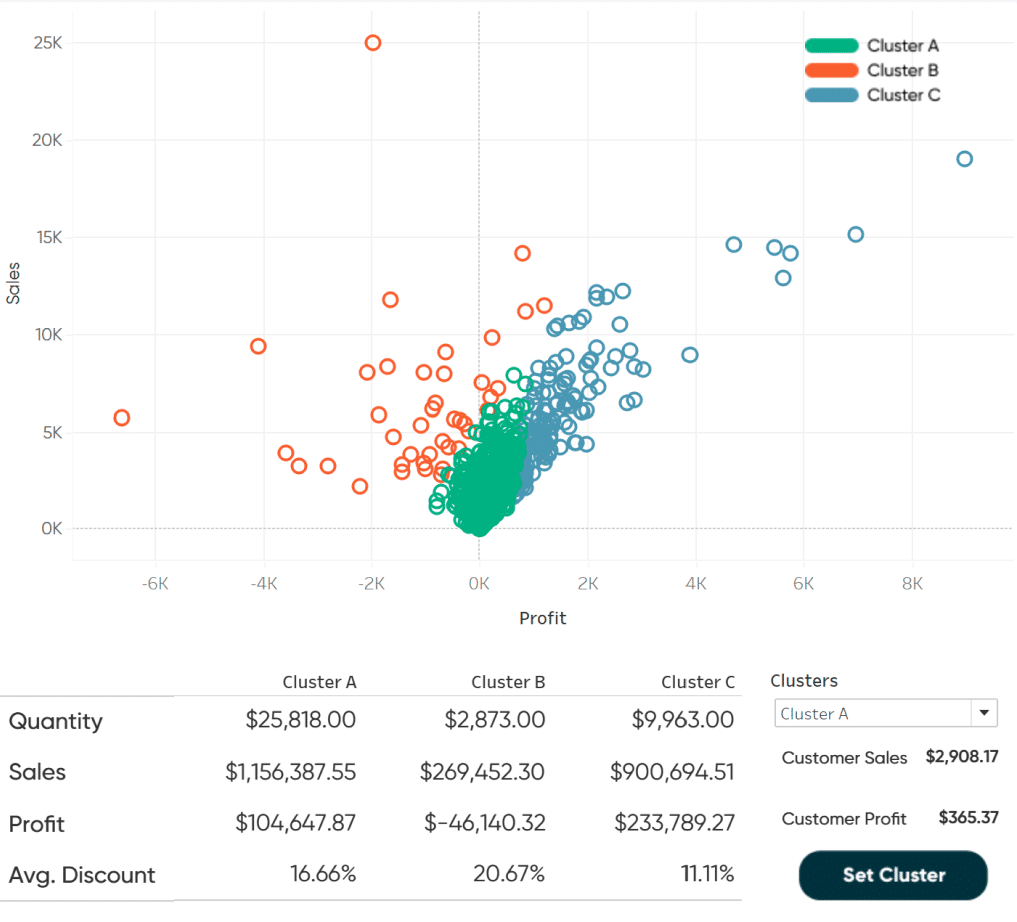
Now you are done! You can easily use the scatter plot and set button to set your different cluster centerpoints. Just select your cluster in the drop-down, highlight approximately where you want your cluster centerpoint to be, and then hit “Set Cluster”.
![]()
I am going to add a text table to analyze the Quantity, Sales, Profit and Discount for each cluster but feel free to create whatever you want to benefit your analysis.
Stay After It,
Maddie


Written By
Maddie Dierkes

Peer Review
Megan Spengler
Manager, Decision Intelligence
Related Content
How to Zoom Into Scatter Plot Quadrants in Tableau

Scatter plots are a great way to see a lot of individual data points and consider the bigger picture at…
Statistical Tableau: How to Analyze Distribution with Histograms

There are many times when performing data analysis when we may want to view the distribution of our data. One…

Ryan Sleeper
Create custom row-level calculations from text using string functions Learn how to access all the different string functions from within…