How to Zoom Into Scatter Plot Quadrants in Tableau

Scatter plots are a great way to see a lot of individual data points and consider the bigger picture at the same time. Most chart types can’t accommodate hundreds of marks, but a scatter plot can fit them with ease. Our brains naturally find patterns in the scatter, and adding attributes like size, shape, and color can help us draw deeper insights from the chart. To take a scatter plot to the next level, consider adding a zoom feature to quadrants.
How to Make a Zoomable Scatter Plot in Tableau
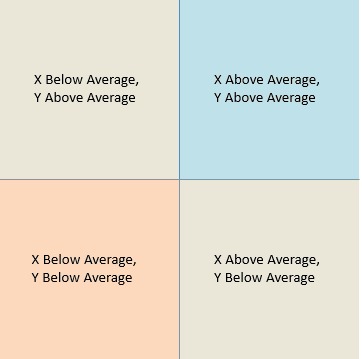
By segmenting marks above or below average we can compare individual marks to overall averages, and see patterns within each group. Zooming enhances this by letting us focus on just one quadrant at a time. In this demo we will build a scatter plot with average lines, and when the user clicks on a mark the view zooms to just that quadrant. The average lines can recalculate to subdivide the selected quadrant, or remain stable and continue to reflect all marks. We’ll work through both options in the tutorial.
Set up a basic scatter plot
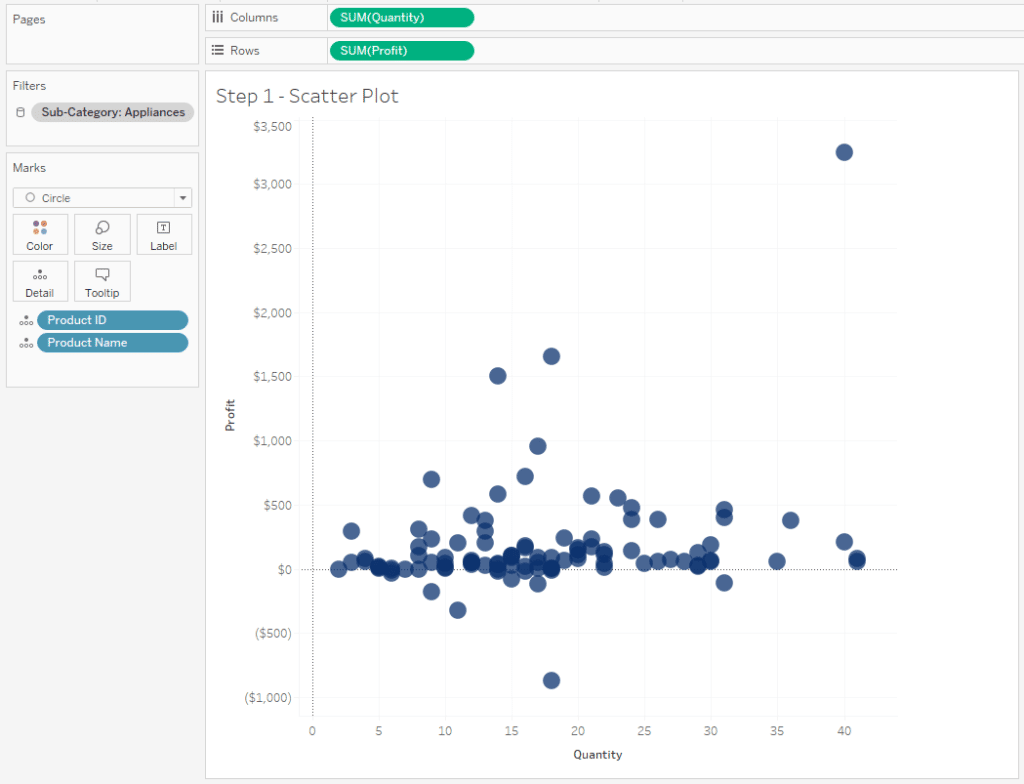
The first step to building this chart is setting up a scatter plot. Add measures to the Columns and Rows shelves to set up the axes. Add relevant dimensions to the details shelf to add marks to the plot. Here I’m using Quantity on Columns, Profit on Rows, and Product ID and Product Name on the Detail property of the Marks card.
Establish scatter plot quadrants
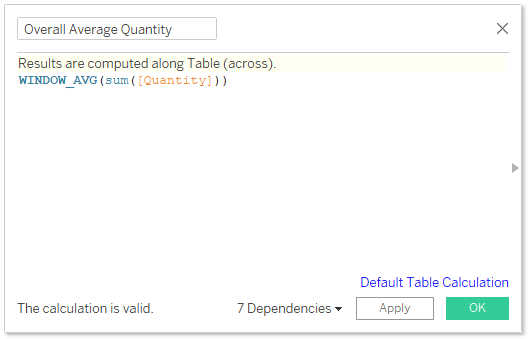
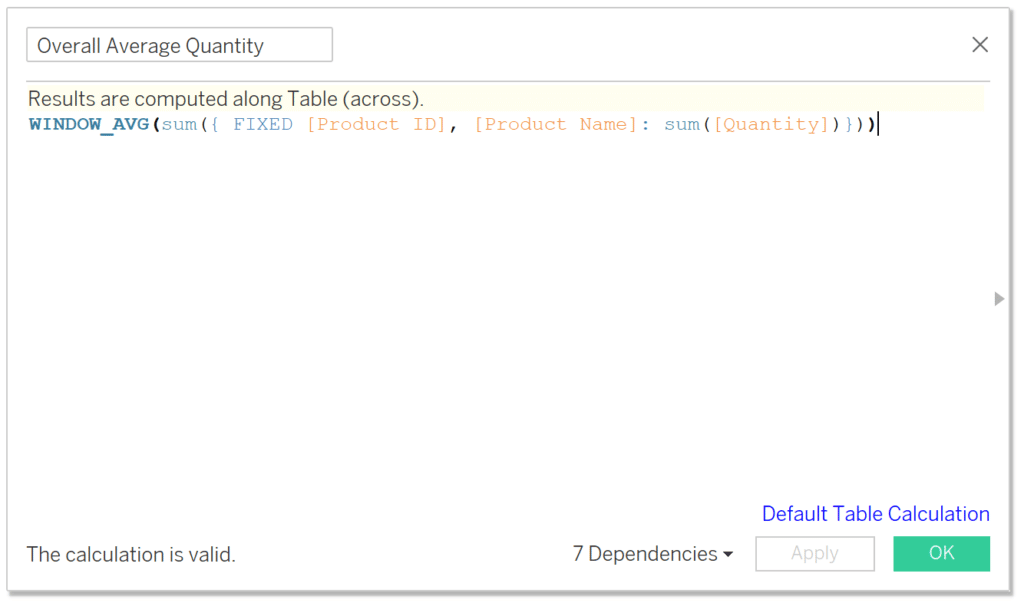
Next, we’ll create quadrants for the scatter plot. Navigate to the Analytics pane and add vertical and horizontal average lines to the plot. Then we’ll create three calculations: The average of the x-axis, the average of the y-axis, and the quadrant assignment. First we use window average to find the overall average of the x-axis measure.
Continue reading with a free account, or login.
Unlock this tutorial and hundreds of other free visual analytics resources from our expert team.
Already have an account? Sign In
By continuing, you agree to our Terms of Use and Privacy Policy.
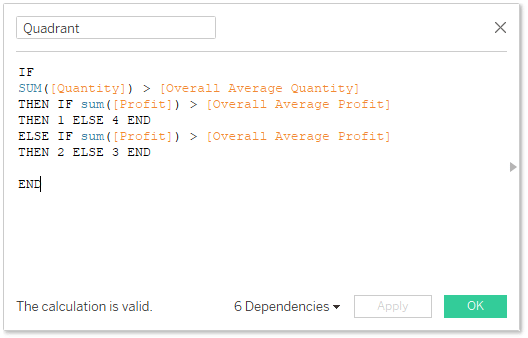
Repeat the calculation for the y-axis. Next, we compare the values of each mark to the overall average to assign marks to quadrants.
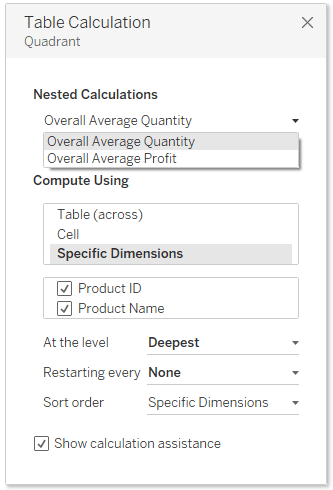
Test the calculations by adding the new quadrant calc onto the Color property. Each quadrant on the plot should show just one color. If you’re seeing more than one color per quadrant you may need to adjust the table calculation settings. Make sure that all partitions are removed by selecting all dimensions in the ‘Specific Dimensions’ list. Note that this needs to be done for both of the nested calculations in the menu.
Create the zoom action
Finally, we’ll set up the zoom action. The zoom action can be based on Filter Actions or Parameter Actions. Though it is a slightly more complicated build, I prefer the Parameter Action because it allows the user to unselect the mark without immediately zooming out again. With a filter action you can immediately move forward with setting up the action, but with a parameter we’ll need to build the parameter, a filter based on the parameter setting, and a parameter input calculation before we can set up the action.
![]()
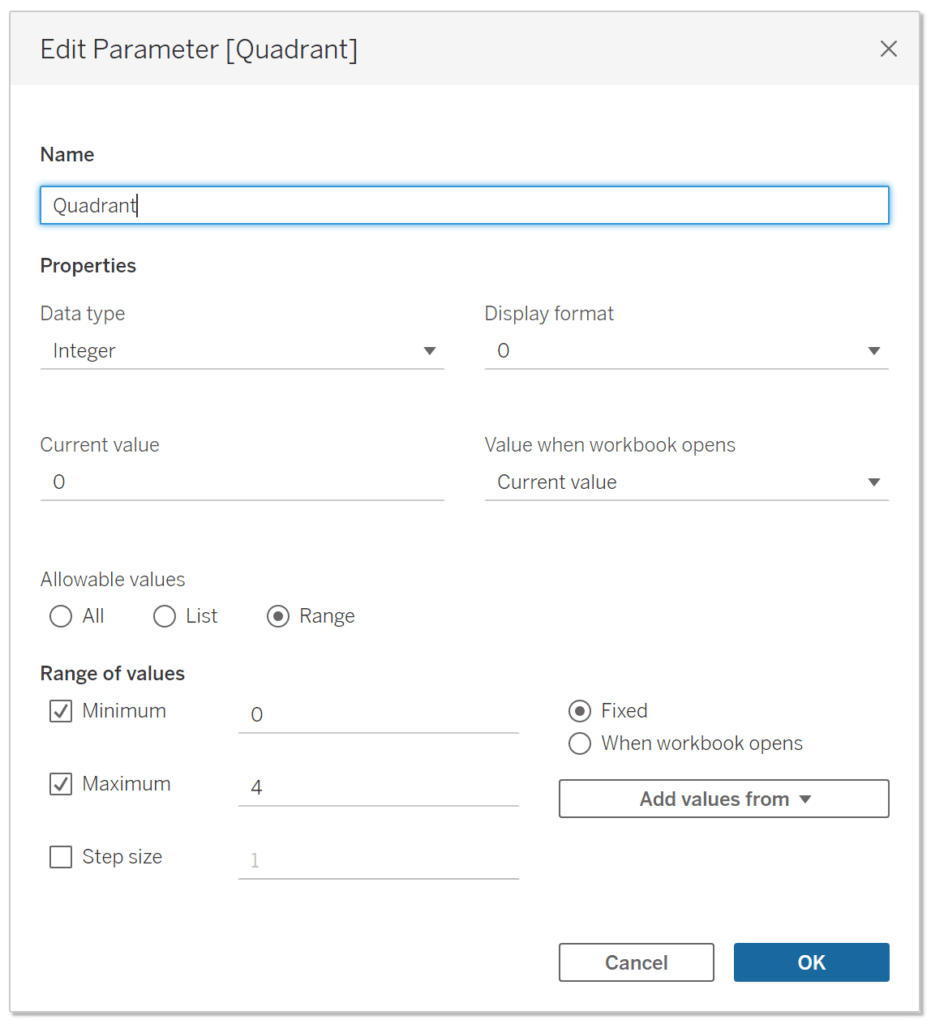
The parameter needs five values – one to zoom in on each of the four quadrants and a fifth value to zoom out.
Next, we’ll create the filter calculation. This calculation needs to return TRUE when the parameter is set to zoom out, and return TRUE for just the selected quadrant when the parameter is set to zoom in.
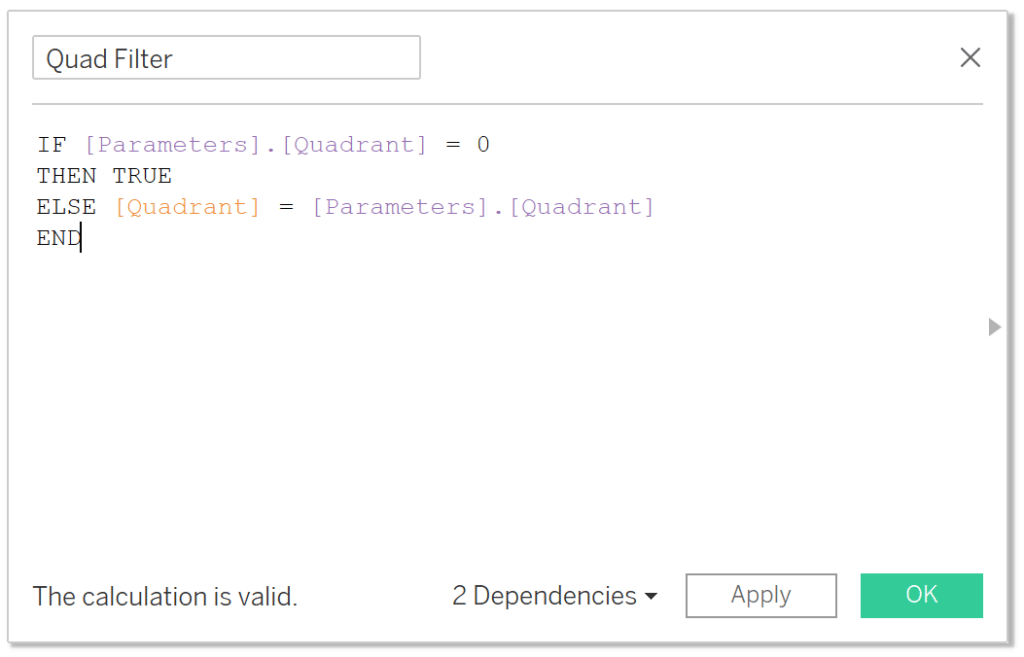
Now that we have all of the elements required to set up the filter, add the filter calculation, Quad Filter, to the Filters shelf and select TRUE. Then test the parameter values to see the view zoom into each quadrant and back out.
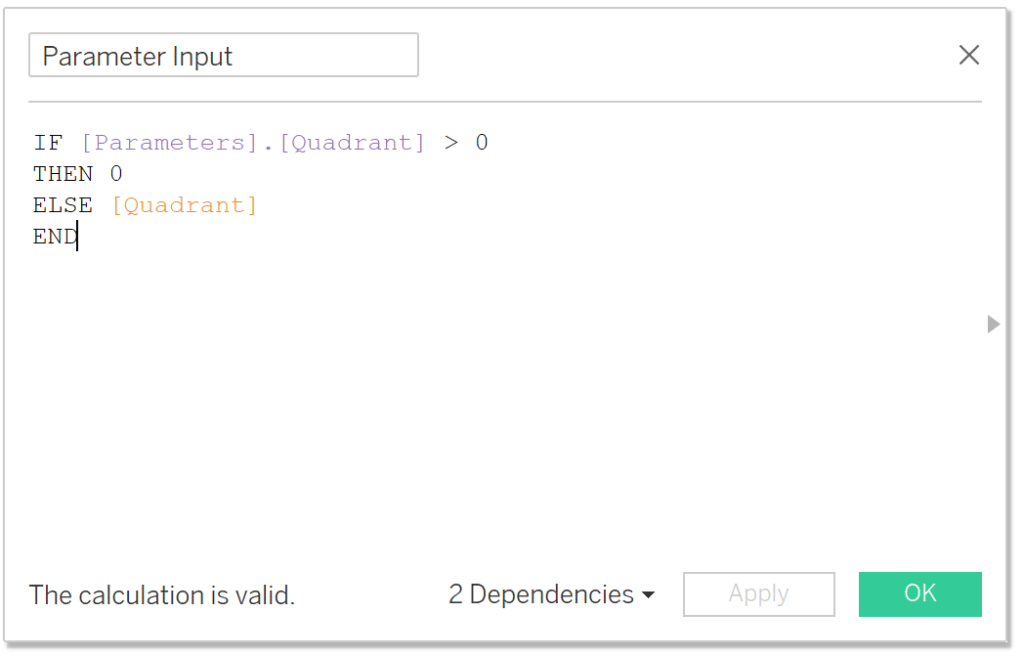
The last piece we need before creating the action is a calculation to provide an input value to the parameter. When zoomed out it should return the quadrant value of each mark, and when zoomed in it should return the zoomed-out parameter value.
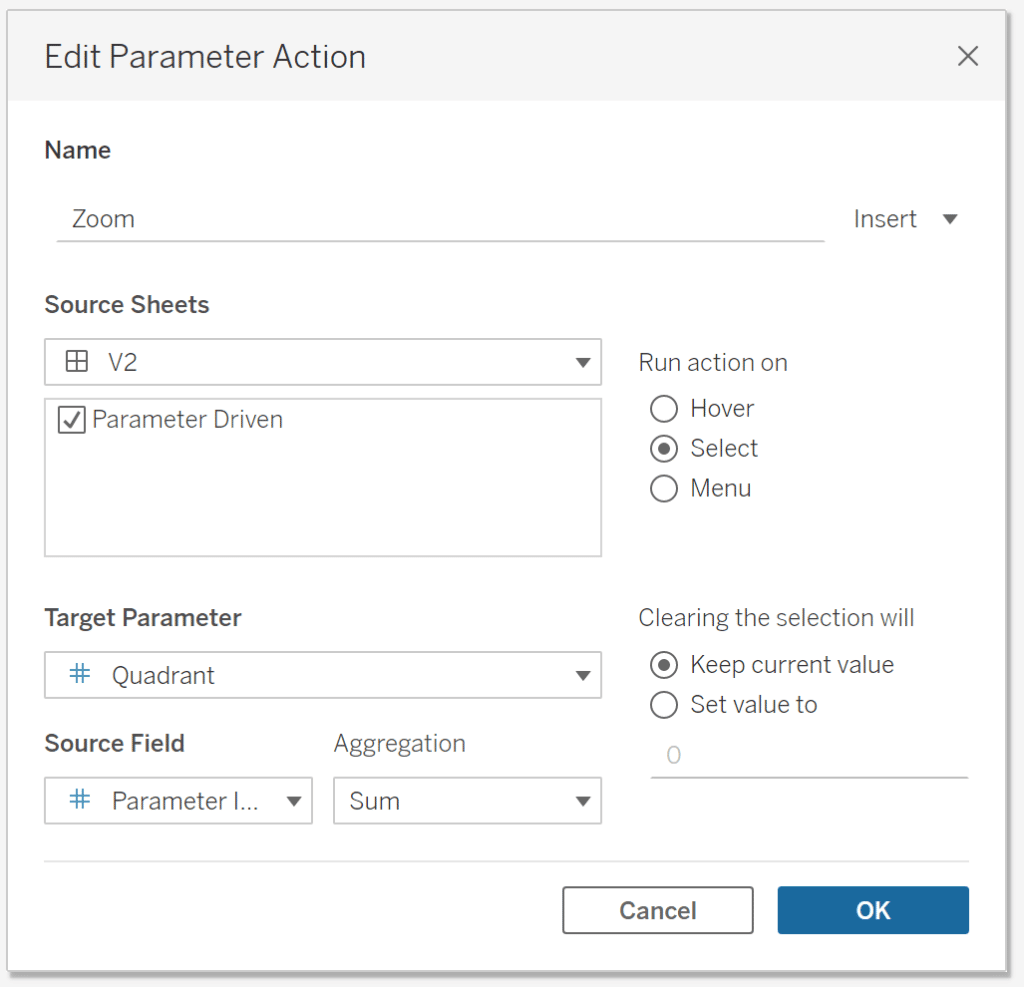
Finally, set up the parameter action. The parameter action should run on Select, Target the Quadrant Parameter, and use the input calculation, Parameter Input, as the source.
With this setup the reference lines recalculate when the view is filtered, subdividing the quadrant. This can be useful, but other times we prefer to keep the reference lines stable. Preventing them from recalculating helps the user stay oriented when the view zooms in and out. To stabilize the lines, update the average X and Y calculations to ignore the quadrant filters. This can be done by incorporating a {FIXED} level of detail expression which runs before dimension filters in Tableau’s Order of Operations.
Then add the calculation to the Detail property of the Marks card. Update the reference line while the view is zoomed out. Check the value before and after to verify that the value is accurate. You may need to adjust the table calculation settings to remove all partitions by checking every dimension. Repeat for the Y axis.
Now the reference lines hold the same value before and after zooming. This provides a stable landmark as the view changes, helping the user reorient after the action runs. This technique adds the most value to crowded scatter plots with a lot of overlapping marks. Zooming gives more space, allowing clusters to separate into individual marks. Like other zoom functions, it’s a way to get more insights out of limited dashboard space.
Thanks for reading!
- Felicia


Written By
Felicia Styer

Peer Review
Dan Bunker
Manager, Decision Engineering
Related Content
3 Ways to Make Stunning Scatter Plots in Tableau

When it comes to my favorite chart types, scatter plots are a close third behind bar charts and line graphs.…
Dashboard Element 2: The Parameterized Scatter Plot
In the last post, I showed you how to build a current performance versus comparison performance index callout; one of…
How to Make a Polygon Scatter Plot in Tableau

Scatter plots are a great way to explore correlations and visually identify outliers in your data. But what if your…