Statistical Tableau: How to Analyze Distribution with Histograms

There are many times when performing data analysis when we may want to view the distribution of our data. One way to view distribution in Tableau is with a histogram. To create a histogram there are several factors you need to consider to best represent your data. Once you have the data visualized you will also need to consider what that distribution of data means.
In this tutorial, I will show you how to create a histogram in Tableau and I’ll walk you through different types of data distribution as well.
I am excited to announce that I have begun writing a book titled Statistical Tableau: How to Use Statistical Models and Decision Science in Tableau! To celebrate I wanted to share some thoughts from the book with you all ahead of its release.
Creating histograms in Tableau
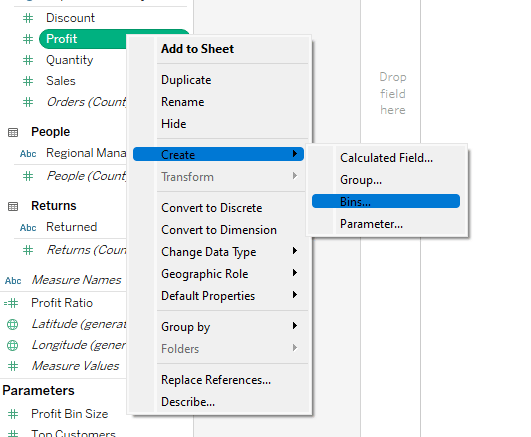
To get started, I am going to connect to the Sample-Superstore dataset. Once connected, we need to create a “Bin” in Tableau. Bins are primarily used to turn measures into discrete dimension members. This is key when trying to determine the distribution of data because we want each bar in the Tableau histogram to represent a group of values.
![]()
Tableau actually helps us along by providing a pre-constructed bin to use in the Sample-Superstore dataset called Profit (bin). I am going to walk us through how to create one from scratch but if you would rather use that bin and jump ahead then feel free to do so.
To create a bin, I am going to right-click on Profit and hover over the Create option then choose Bins from the menu.
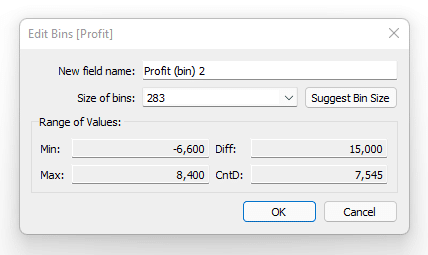
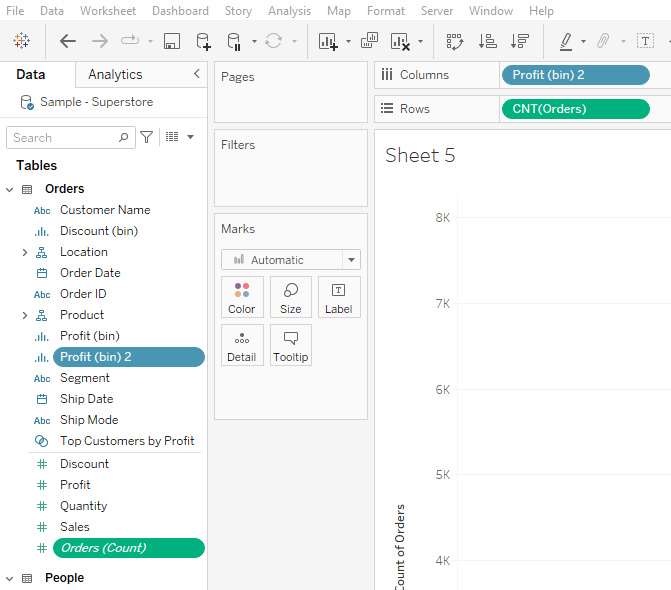
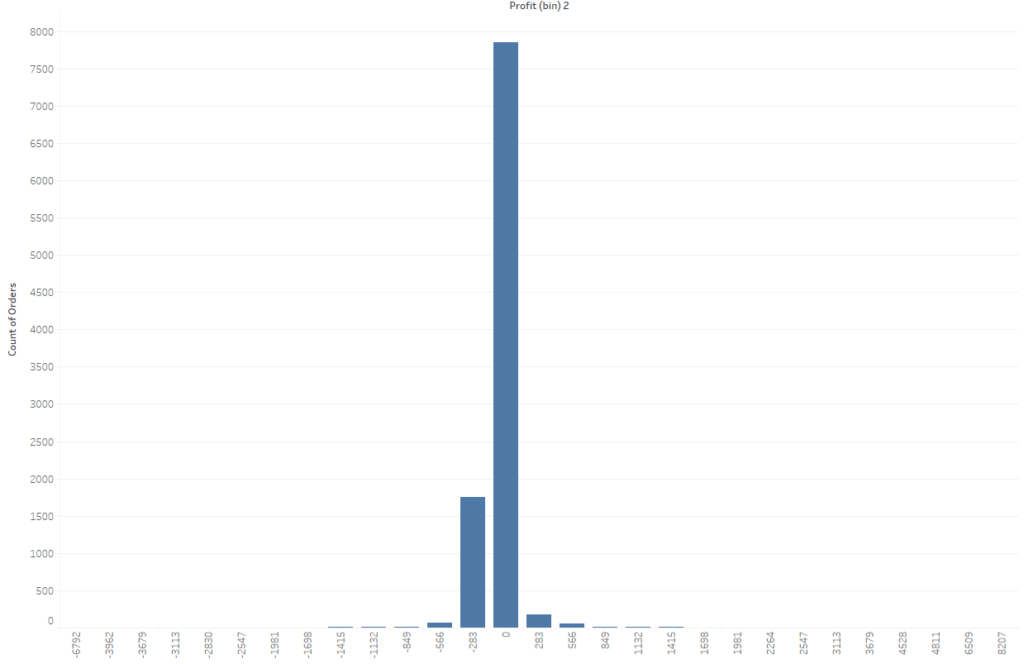
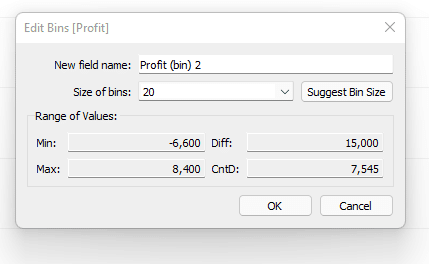
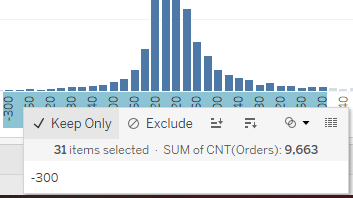
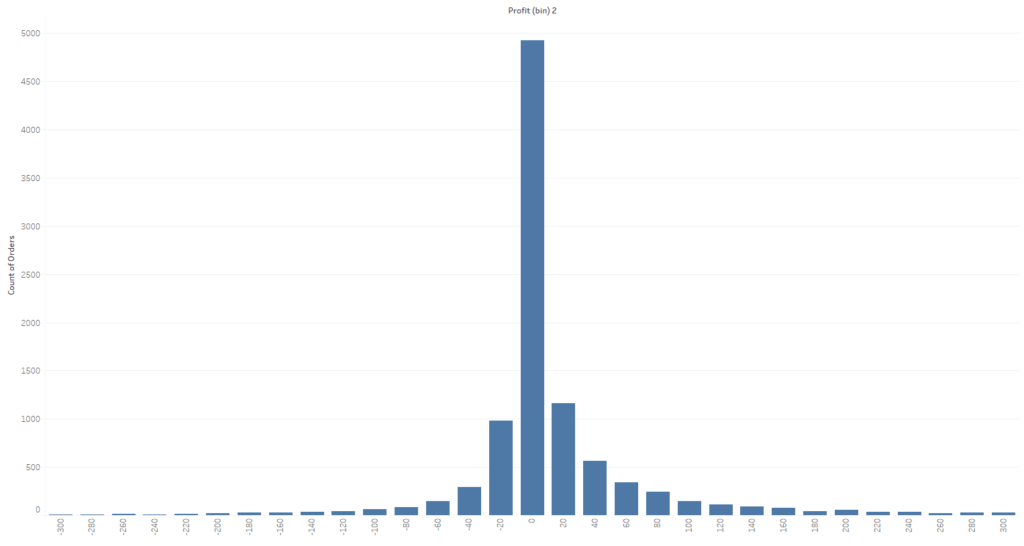
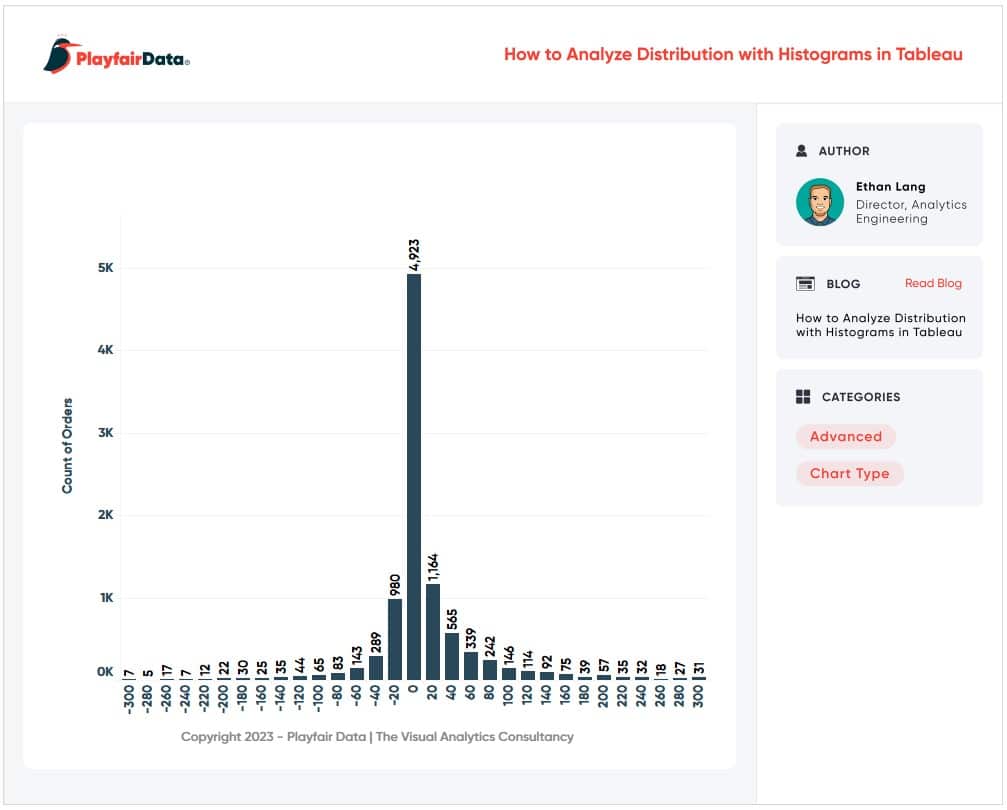
Unlock this tutorial and hundreds of other free visual analytics resources from our expert team. Already have an account? Sign In By continuing, you agree to our Terms of Use and Privacy Policy. How to Analyze Data Distributions Using Histograms in Tableau This will open a new dialog box with information about our Profit measure. You can see that Tableau will assign a “Size of bins” value automatically. In this case it is 283, meaning that each bar in the histogram will “bin” the profit values in these increments. As a better example, if a product generated $200 in profit then it would get binned together with values ranging from $0-$283. If a product generated $400 in profit, it would get binned together with values ranging from $284-$567. For now, let’s use the suggested bin amount then refine it later. Before we move on, I do want to explain the other information displayed in this menu. We can see a Min and Max value; these are the min and max profit values of all the records in the dataset. We also see a CntD value which stands for Count Distinct. This is a distinct count of all the individual profit amounts in the data, so we have 7,545 distinct values in this dataset. The Diff value is just the difference from the min and max values. I am going to call this good for now and click OK in the menu. This is going to create a new dimension called Profit (bin) 2 in the Data pane. I will drag that dimension to the Columns shelf then drag the Count(Orders) measure to the Rows shelf. This gives us a nice histogram that appears to have a normal distribution. We can see that the majority of our orders generate profits ranging from about -$849 to $849. At a high level this looks very informative but I want to examine it a bit closer. I will first edit our bin size from 283 to 20. This will bin the data at a more granular level. To do this I will right-click on the Profit (bin) 2 dimension and change the value to 20 then click OK. Now I want to focus on our orders that are between -$300 to $300. Filter to these bins by clicking on the -$300 bin in the X-Axis then, while holding shift, click on the $300 bin which will highlight that bin and everything in between. With those bins selected, I will click on Keep Only from the tooltip command buttons. That should give us a view that looks like this. We can see our data follows a nice normal distribution here. I am going to clean this view up a bit more by changing color and fonts. Here is where I landed. There are three common distributions you will see in data. To understand what these distributions mean, we first have to recall some basic math statistics; the mean, median, and mode.
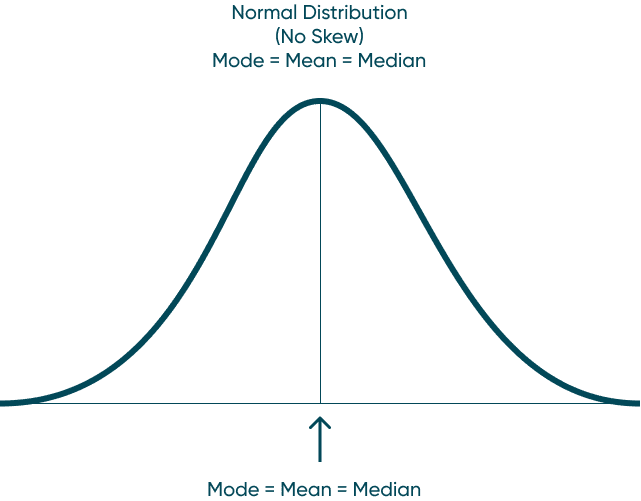
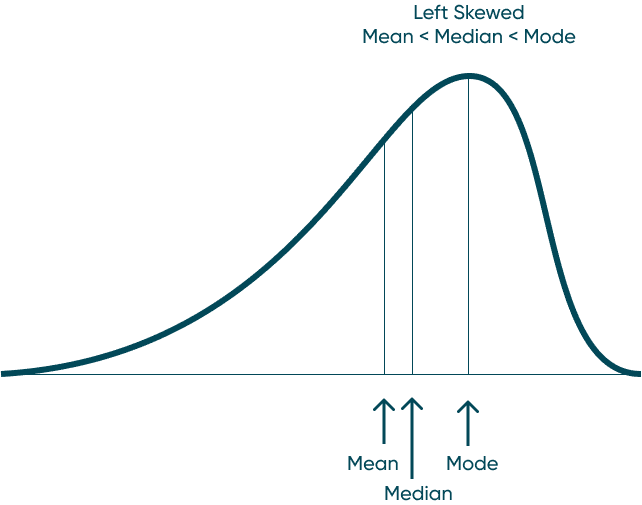
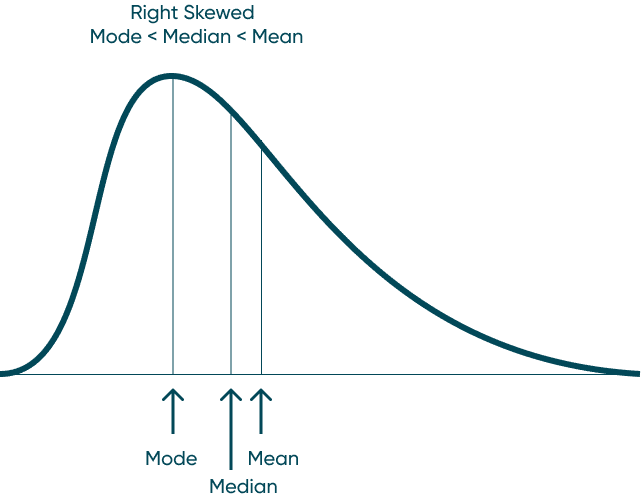
Mean: The average of the numbers within our dataset. Mode: The number that appears most frequently in our dataset. Median: The middle number in a dataset when listed lowest to highest. When data has a normal distribution, it really means that the Mode, Mean, and Median are all equal each other. This creates a perfectly symmetrical distribution similar to the one above. A left skewed distribution is when the Mean is less the Median and the Median is less than the Mode. That creates a distribution that bunches to the right and has a long-left tail end. A right skewed distribution is when the Mode is less than the Median and the Median is less than the Mean. This distribution has the majority of the data bunched to the left with a long-right tail. How to Make Unit Histograms in Tableau By understanding these concepts, you can also start to understand distribution before you visualize it. Don’t stop there though. Visualize your data and prove your assumptions. Until next time, Ethan Lang This content is excerpted from my book Statistical Tableau: How to Use Statistical Models and Decision Science in Tableau published by O’Reilly Media Inc., 2023, ISBN: 9781098151775. Read the book at O’Reilly.Continue reading with a free account, or login.
Different types of distribution
![]()
Director, Analytics Engineering
[email protected]


Written By
Ethan Lang

Peer Review
Maddie Dierkes
Manager, Decision Science

Graphic Design
Dan Bunker
Manager, Decision Engineering
Related Content
3 Creative Ways to Visualize Outliers in Tableau
There are many ways to detect outliers in your data, but flagging them for your end users may present some…
Statistical Tableau: Using MAD to Detect Outliers in Non-Normalized Data
I recently wrote a tutorial on 3 ways to visualize outliers in Tableau. This tutorial assumes a normal distribution of…
Advanced Analytics in Tableau Series: One-Way ANOVA Tests
You may be wondering why we would want to perform an ANOVA test in Tableau, as you can do it…