How to Make a Boolean Toggle in Tableau
Last week, I showed you how to filter marks on and off using a Show/Hide button on layout containers. That approach is the easiest possible way to make toggle buttons in Tableau and works particularly well if you only need to filter marks on a single sheet.
Of course, sometimes you need to toggle results on and off across multiple sheets on a dashboard. This post will show you how to use a single toggle button to filter marks on and off across multiple worksheets. I’ll also show you a trick for automatically deselecting dashboard objects to get around the pesky borders that appear so your users won’t have to double-click.
This is the second in a three-part series on toggles in Tableau – subscribe to receive future updates.
Watch the related video with Playfair+
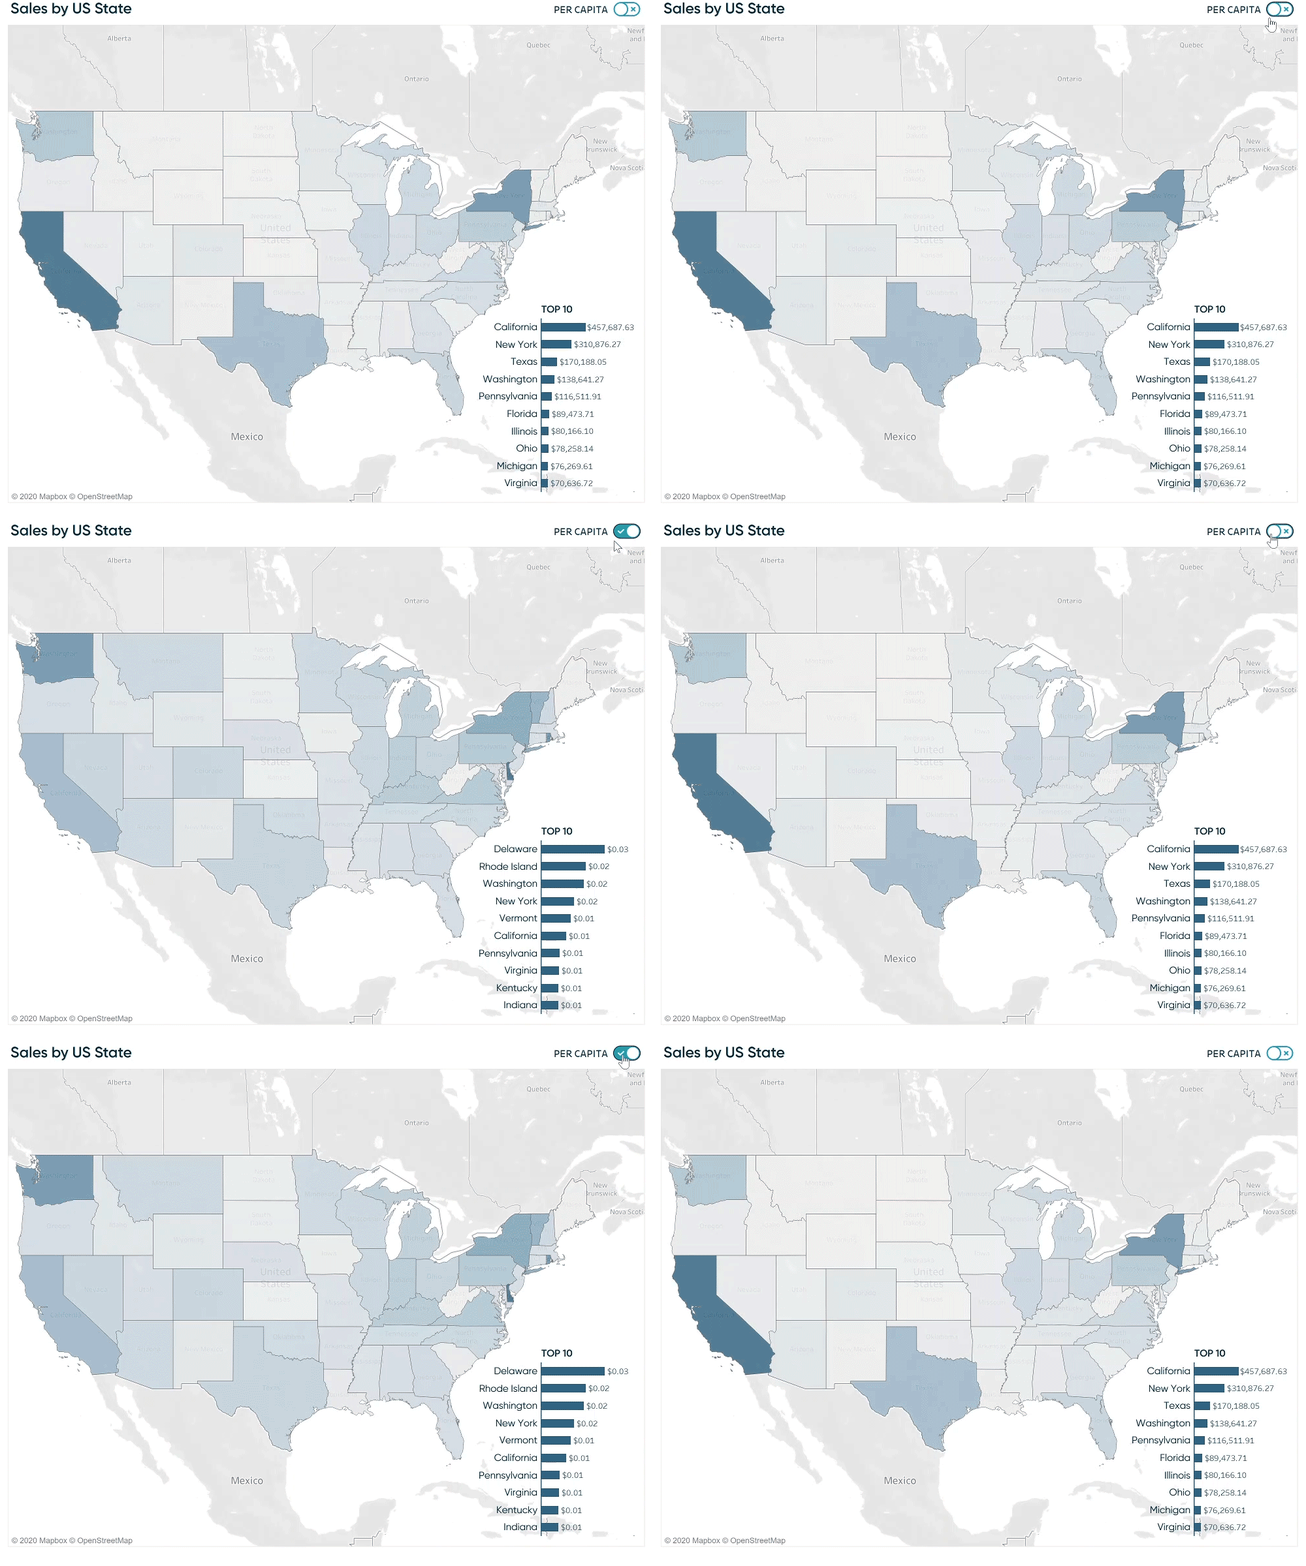
For this tutorial, we will create a toggle that allows the user to decide when to look at data per capita instead of actuals.
Loading images to your Tableau Repository
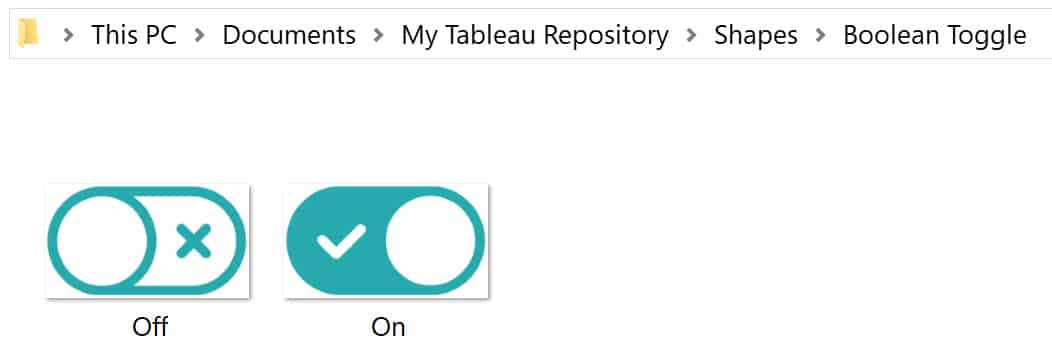
First, find your images. For best results and the most flexibility, find or create images in a PNG file type with transparent backgrounds. Here’s the image I’ll use when the dashboard is showing the raw underlying data.

Here’s the image that will be used to represent when the toggle is turned on and we’re using data per capita.

Save these two images in your Tableau Repository at Documents > My Tableau Repository > Shapes. You can save the images in any of these folders or create a new folder for all of your toggle images.
Creating the toggle parameter
Next, create a parameter with a data type of Boolean. Boolean fields have only two outcomes: True and False. In this case, the True values will eventually represent when the toggle is turned on, and the False values will represent when the toggle is turned off.
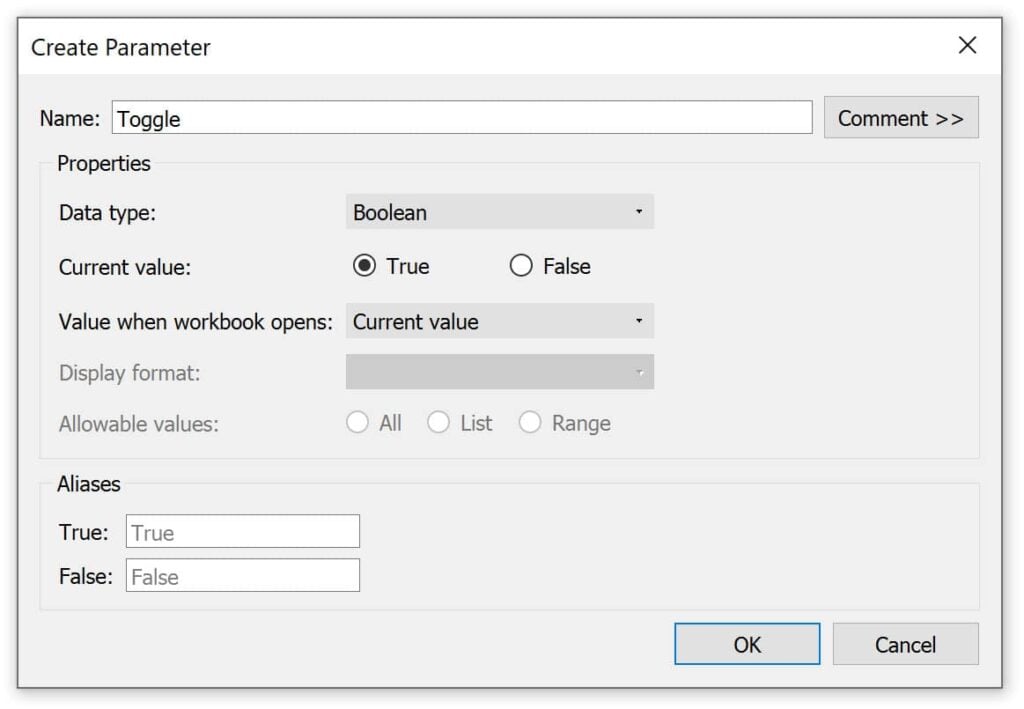
This single “Toggle” parameter will be used to create the toggle button itself and the calculations that filter the per capita data on and off. For the button itself, you will need to create the following calculated field:
IIF([Toggle]=False,True,False)
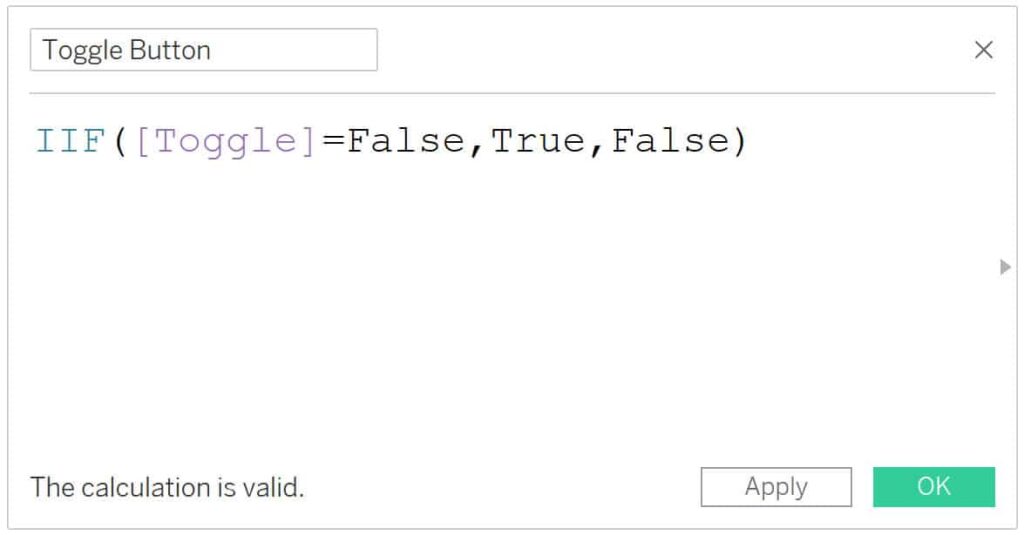
This formula says if the current value of the Toggle parameter is False, show True and when the Toggle parameter is True, show False. This will allow us to jump back and forth between the image of the on and off buttons. This approach is most-similar to how Zen Master, Ken Flerlage, shared how to turn instructions on and off in his post, Fun with Tableau 2019.2 Parameter Actions. It’s towards the end, but well-worth making your way through all the great demonstrations in the post.
Create a free account, or login.
Unlock this tutorial and hundreds of other free visual analytics resources from our expert team.
Already have an account? Sign In
Creating the toggle button
Now that we have the calculated field, we can create the button by creating a new worksheet, changing the mark type to Shape, and dragging the newly created “Toggle Button” field onto the Shape Marks Card.
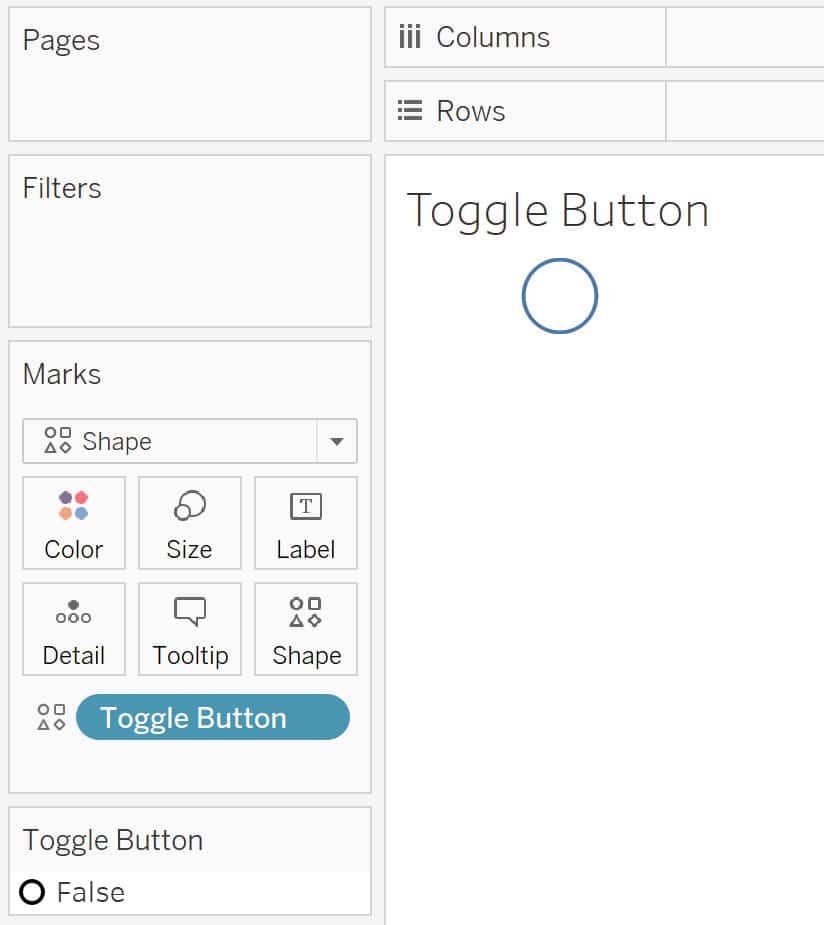
The current value of the Toggle parameter is True, and because our Toggle Button calculated field will always display the opposite of the parameter selection, we see a shape for False. This mapping is a little tricky because our logic is reversed. While we see a shape for False, the current value of the parameter is still True. So that it’s easier to think through the logic for all of the sheets controlled by this toggle, I recommend that you map the “On” button for the False shape and “Off” button for the True shape, even though it feels counterintuitive at the moment.
To turn this shape into an image of the On button, click the Shape Marks Card, click the “data item” you want to map, and find the shape you want to map from the shape palettes on the right. If you already had Tableau open when you added the toggle images to your Tableau Repository, you will need to click the Reload Shapes button before they will show up.
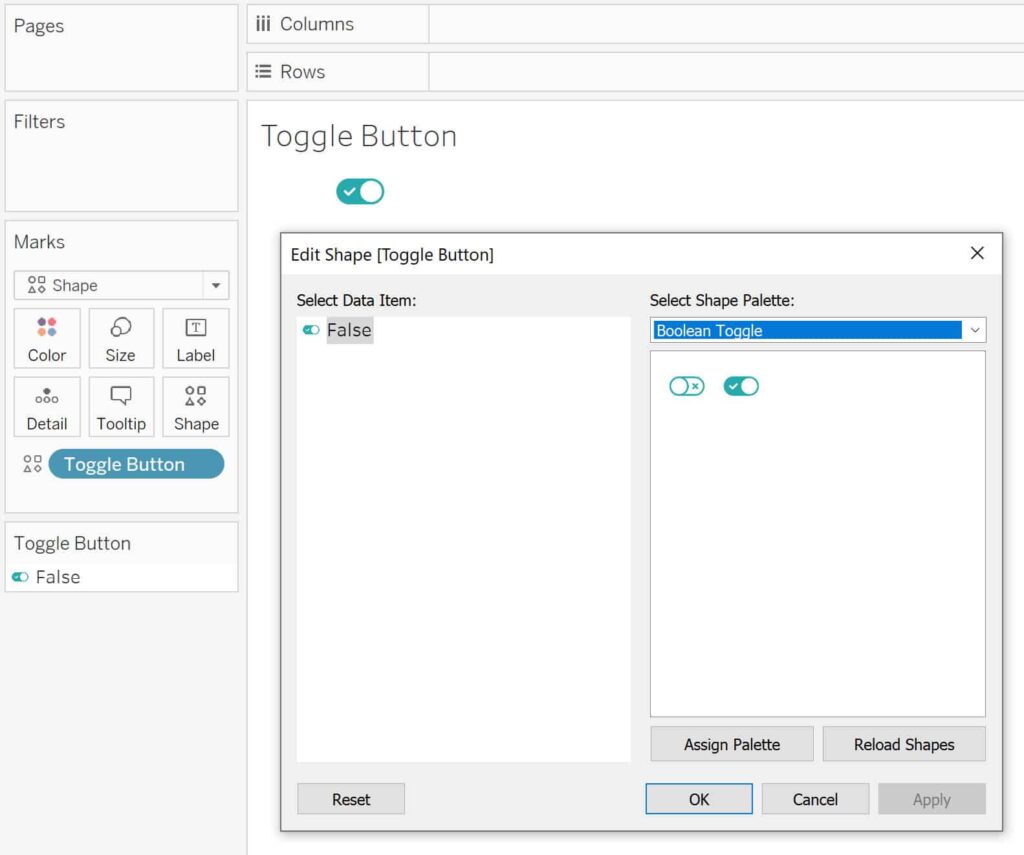
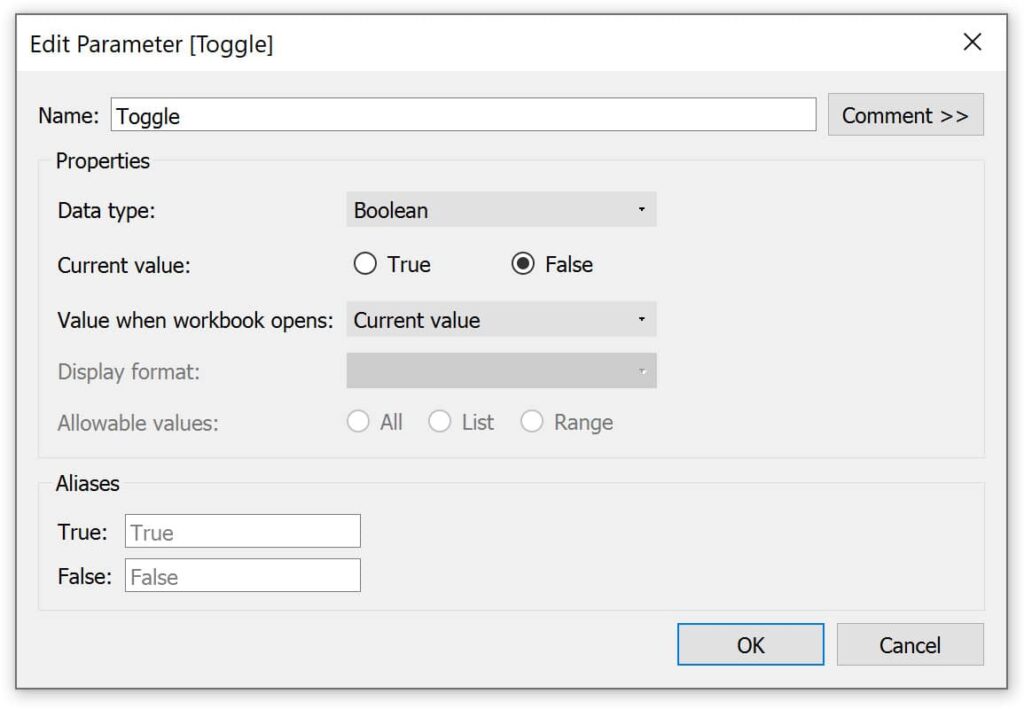
To map the Off button, start by changing the current value of the parameter from True to False by right-clicking on the Toggle parameter, choosing “Edit”, and changing the Current Value.
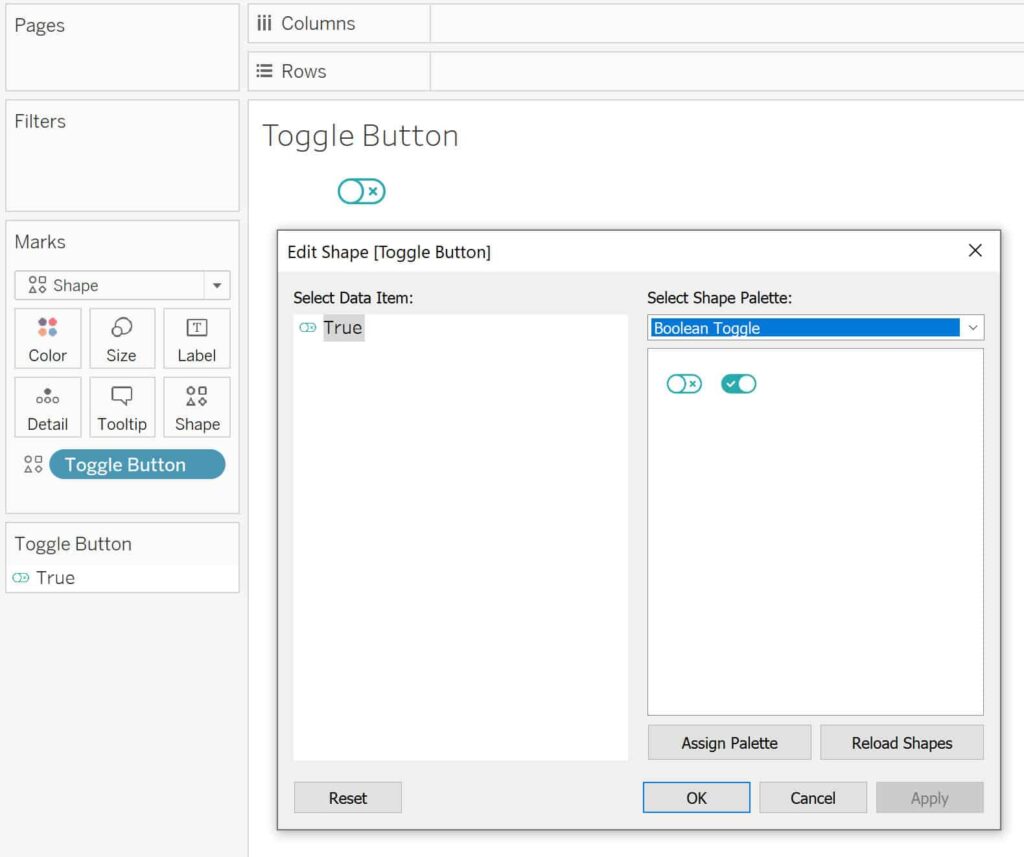
By changing the current value from True to False, the Toggle Button calculated field flips to “True”, and we can now map the shape for True as we did for False.
Next, we’ll incorporate the Toggle parameter values in whatever calculations we want influenced by this toggle button. This section is completely up to you to apply to your own use case, but to continue with my example, I’ll create a calculated field that shows sales from the Sample – Superstore dataset when the toggle is turned off, and sales per capita when the toggle is turned on.
The formula for this calculation is:
IIF([Toggle] = True,SUM([Sales])/SUM([Deduplicated Population]),SUM(Sales))
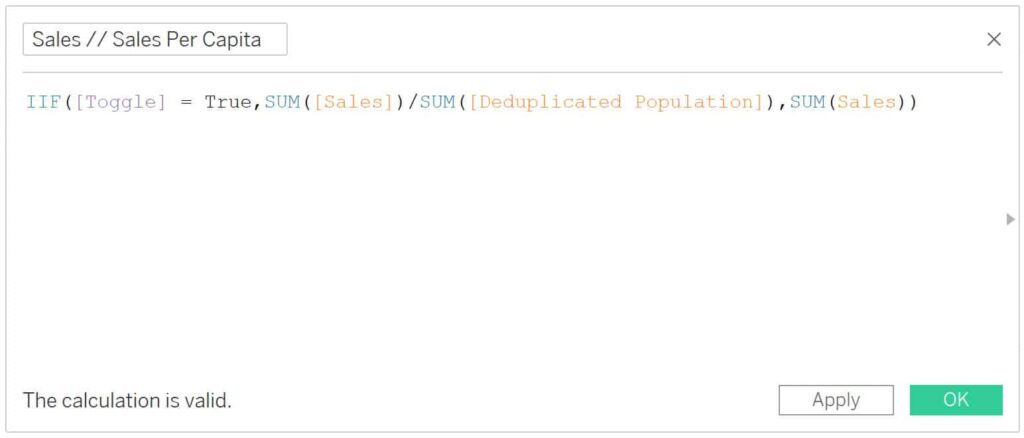
Sales per capita is created by dividing sales by the population in each state, which I joined in from a different data source.
How to Turn Normalization On and Off in Tableau
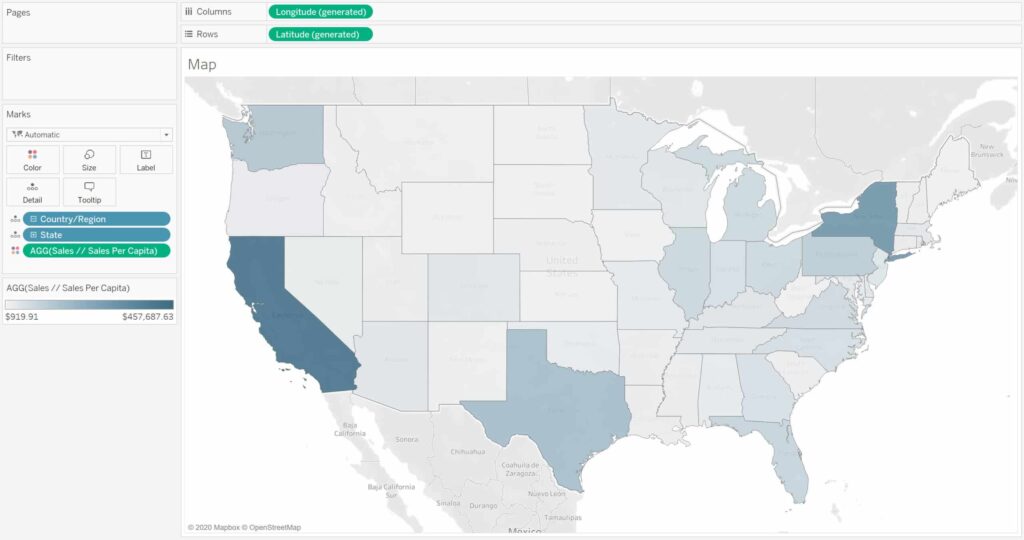
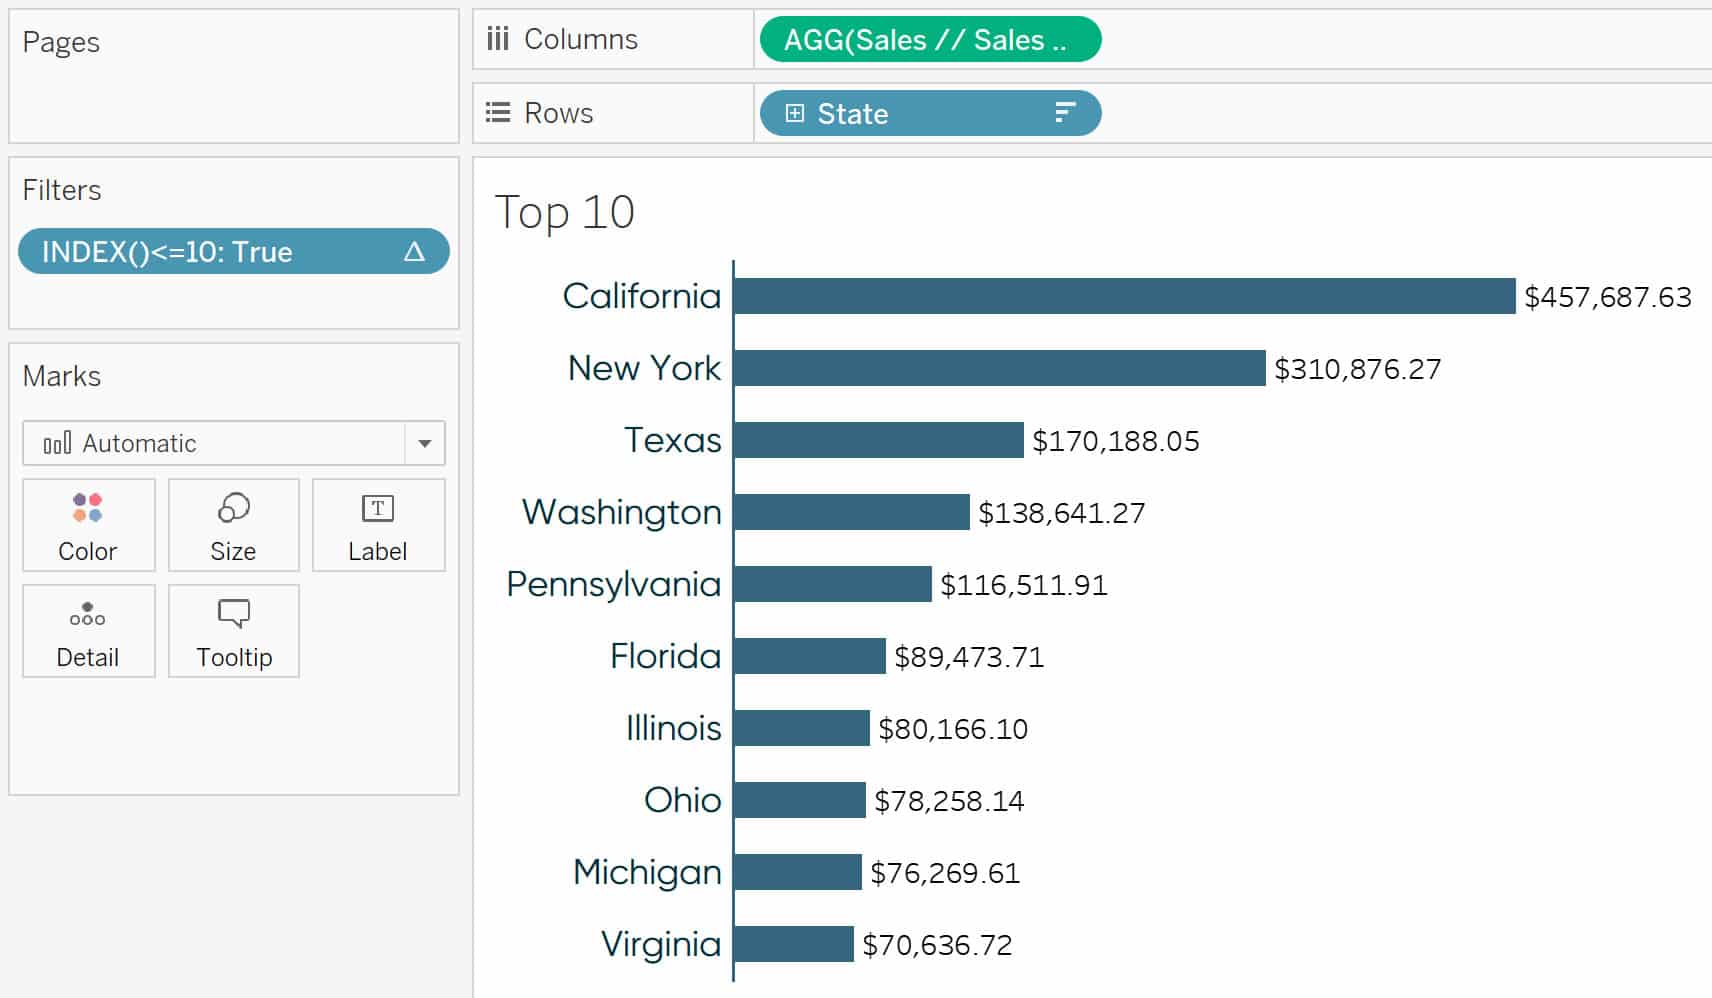
From here, create as many sheets as you want that use this parameterized measure. You can also create additional calculated fields that incorporate the Toggle parameter (i.e. profit instead of sales), but to keep things simple for this tutorial, I will create two views using the “Sales // Sales Per Capita” measure: a US map and top 10 bar chart.
Sales // Sales Per Capita by US State
Sales // Sales Per Capita Top 10 by US State
Using Tableau’s INDEX() Function for Easier Top N Filters
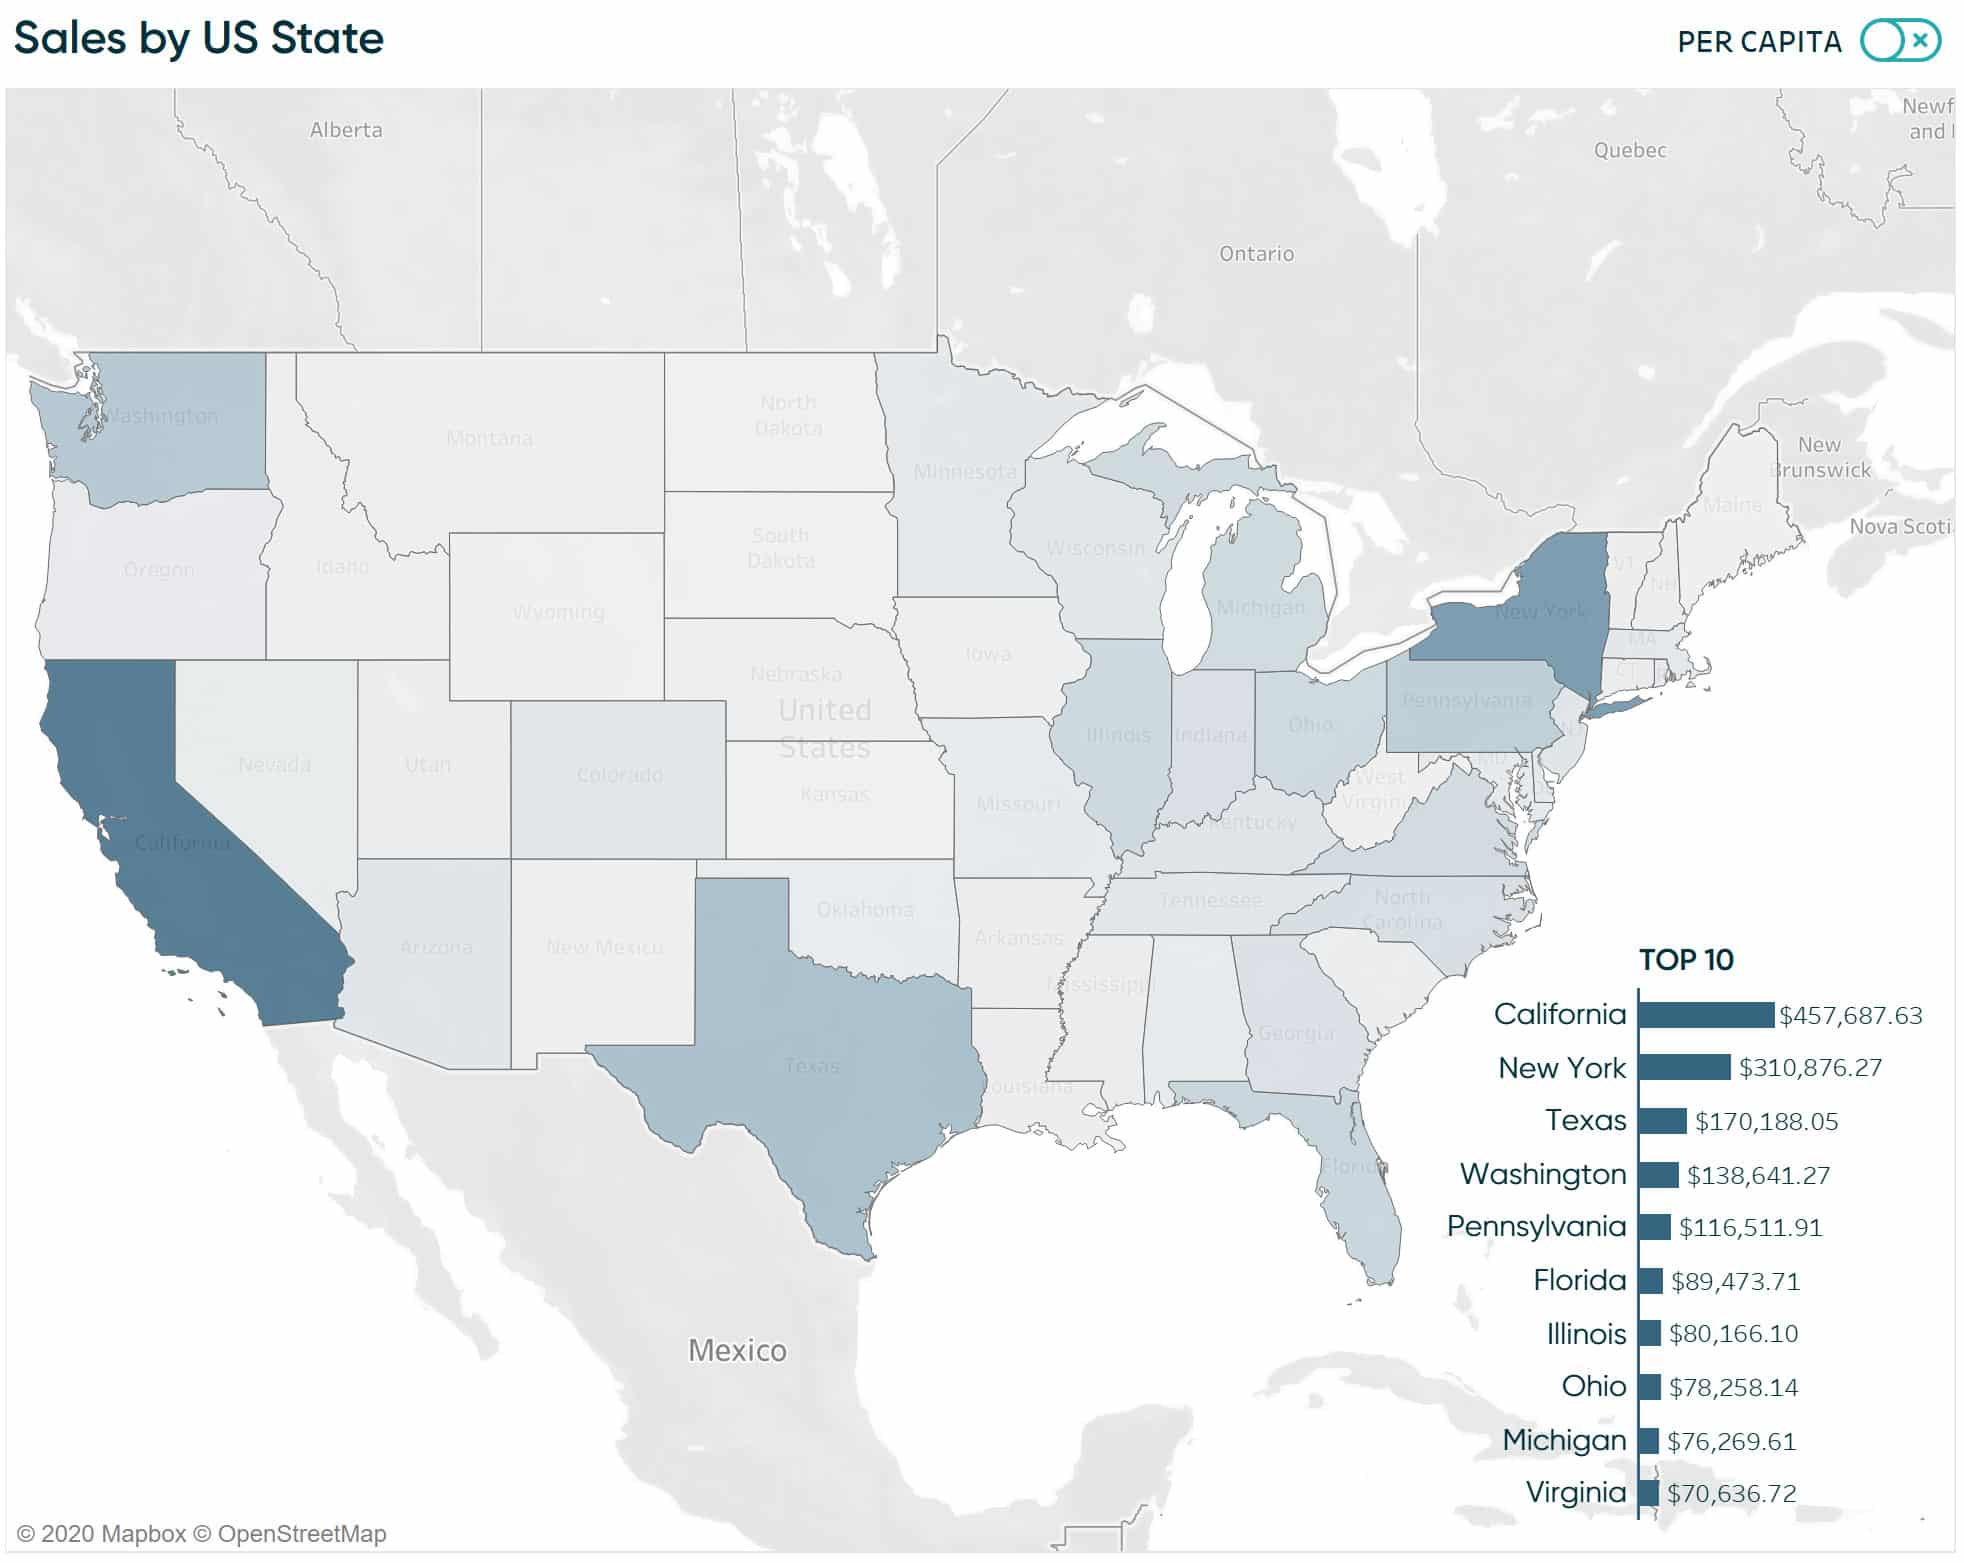
Now create your dashboard with the toggle button and the sheets the toggle button will control.
Bring toggle buttons to life with parameter actions in Tableau
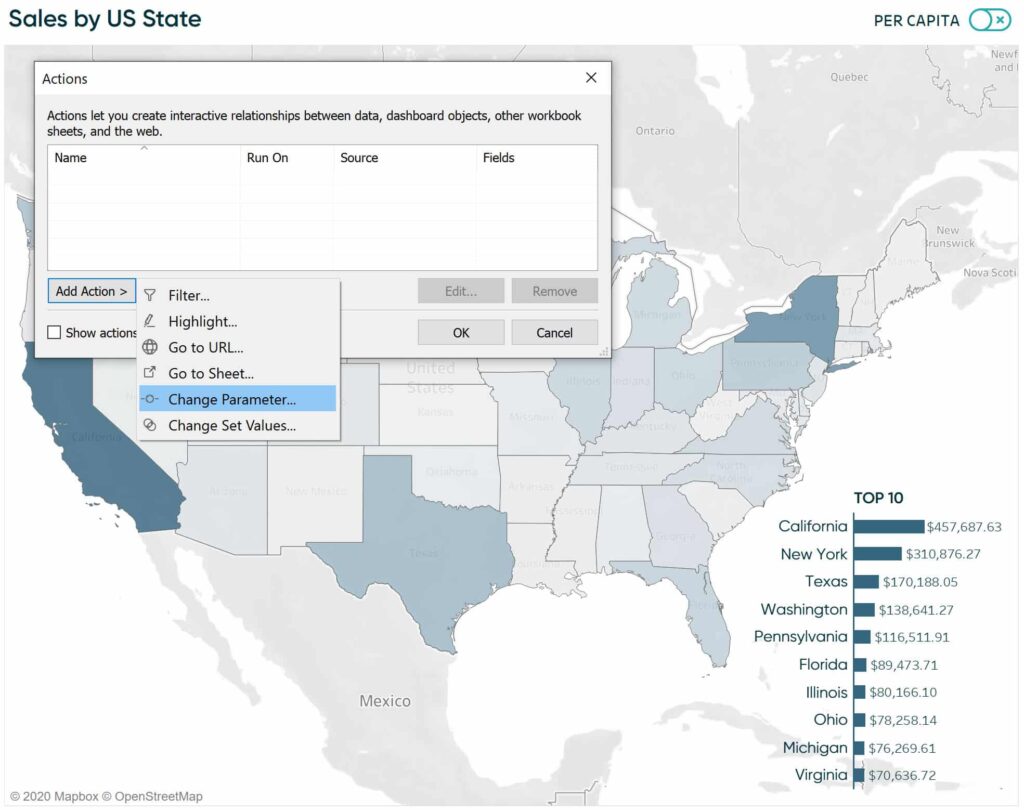
To activate the toggle button, add a “Change Parameter” dashboard action by navigating to Dashboard > Actions and clicking the Add Action button.
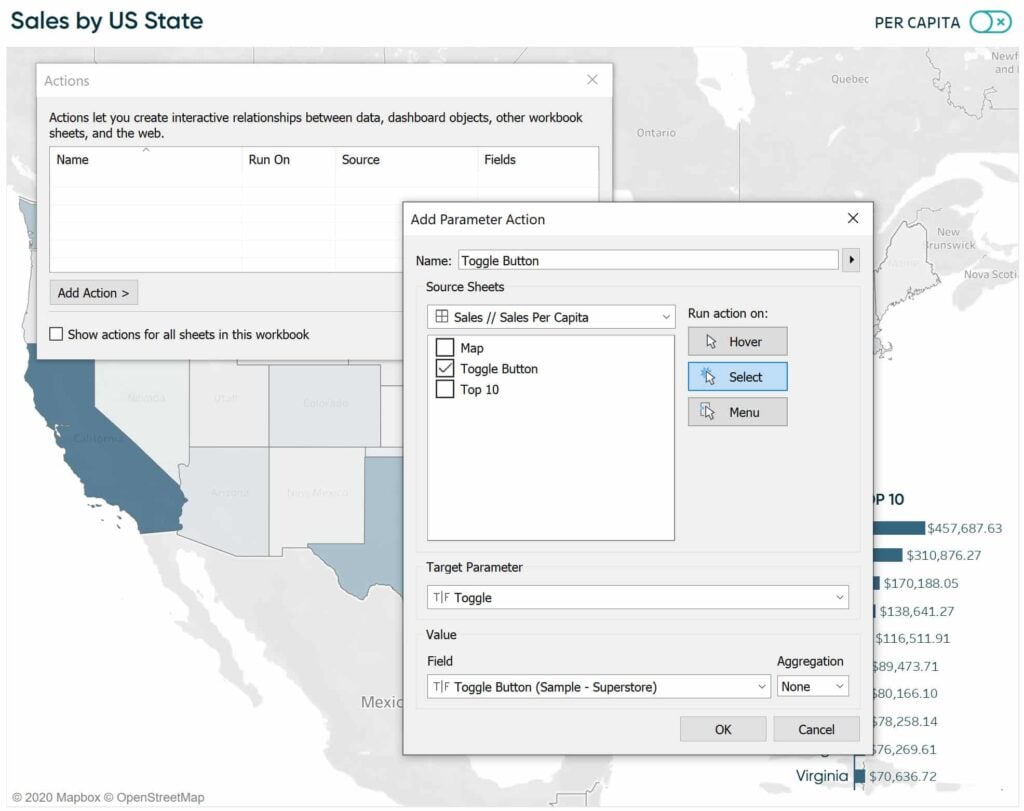
In the options that appear, choose the toggle sheet as the source of the action, target the Toggle parameter, and overwrite it with the Toggle Button calculated field.
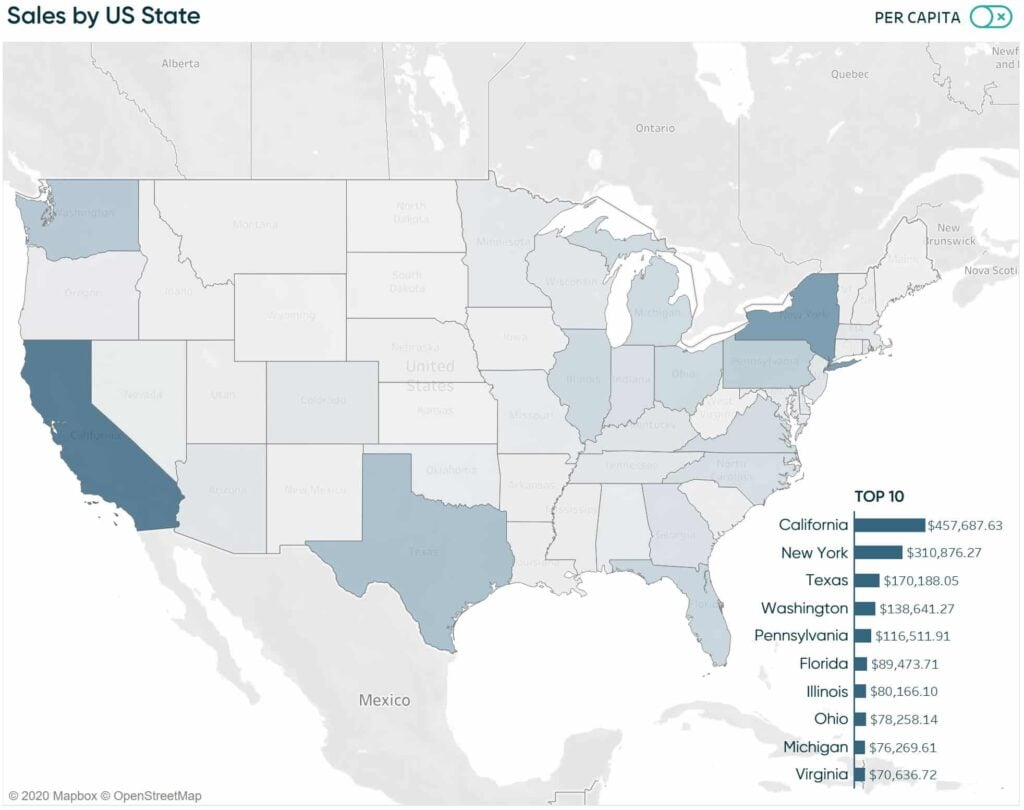
After clicking the OK buttons to close the actions setup, clicking the toggle in the top-right corner will make the toggle flip to the on position, and the sheets on the view show sales per capita!
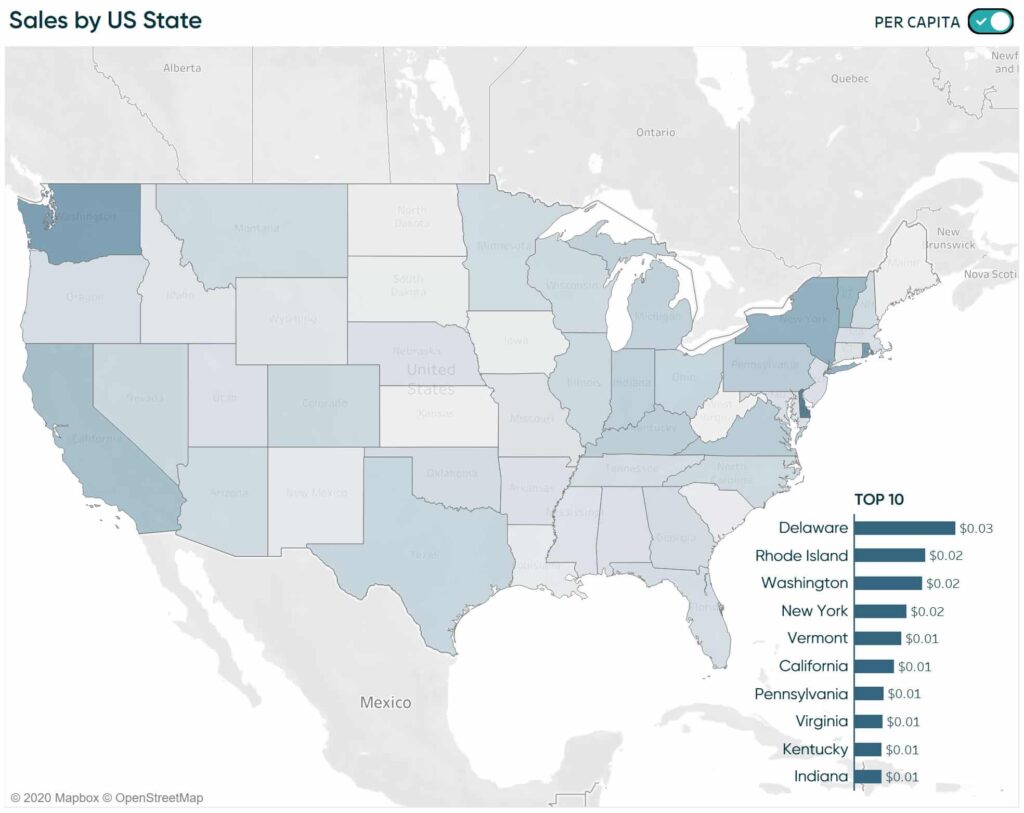
Remember, the image of the off button is mapped to the value of True. After setting up the dashboard action, clicking the value of True feeds the Toggle parameter. That Toggle parameter is integrated with the value of the Button calculated field and switches the value to False, revealing the On button. That Toggle value also changes the value in the Sales // Sales Per Capita calculated field to make it display the sales per capita values instead of the raw sales values.
This has already made my toggle dreams come true, but there are two things bugging me. Tableau shows a border around selected objects, which we’ve done by clicking on the button. This doesn’t look great, but what’s worse, we would have to first deselect the object before turning the selection back to the off position. This means an extra click for our users and a less than ideal experience.
There’s an easy fix for both drawbacks. Add a Filter dashboard action with the Toggle button as the source of the action and the Toggle sheet as the target of the action.
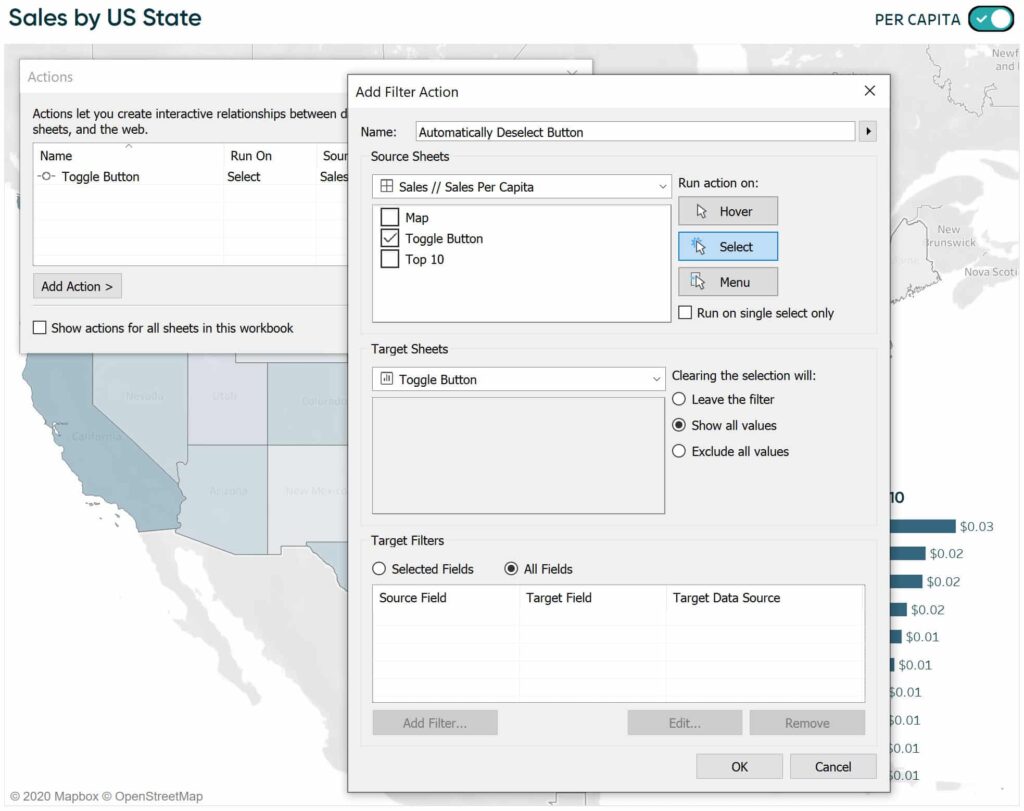
This automatically deselects the button, so the border goes away and the user’s very next click will toggle the button again! Here’s how the view looks after turning the toggle back off.
Thanks for reading,
– Ryan
Related Content
Ryan Sleeper
Toggle On the Fun with 3 Techniques and 3 Practical Applications In this exclusive Playfair+ webinar, Ryan shares techniques for…
Ryan Sleeper
Overwrite parameter values by simply interacting with a dashboard Learn how to add a “Change Parameter” action to a dashboard;…
The Easiest Way to Make a Toggle in Tableau
Toggles in Tableau are useful anytime you want to provide your user the ability to filter certain data points, flip…

