How to Show Top 10 Lists in Tableau Tooltips
You may have heard the recommendation to provide your dashboard users details on demand. While I generally agree with the idea of a dashboard flowing from overview – to drilldown (or filtering) – to specific details when needed, there can be some negative consequences if your end users are too focused on the raw data. Most notably, the raw data does not provide the benefits of data visualization, and often means exporting the data from Tableau – stopping the flow of thought dead in its tracks. One of my favorite ways to provide details on demand is through Tableau’s Viz in the Tooltip feature. I’ll set up a sheet containing the detail and add it to the tooltip of an overview or filtered visual. The challenge is that due to the order of operations of Tableau filters, it’s tricky to filter the tooltip to the correct details. This post will show you two approaches for filtering a list to the top 10 when it’s being used within a Tableau tooltip. This means that whatever dimension member you are hovering over on a dashboard will display a detailed top 10 list for that specific dimension member.
This content is excerpted from my book, Innovative Tableau: 100 More Tips, Tutorials, and Strategies, published by O’Reilly Media Inc., 2020, ISBN: 978-1492075653. Get the book at Amazon.
Set up the Viz in Tooltip sheet
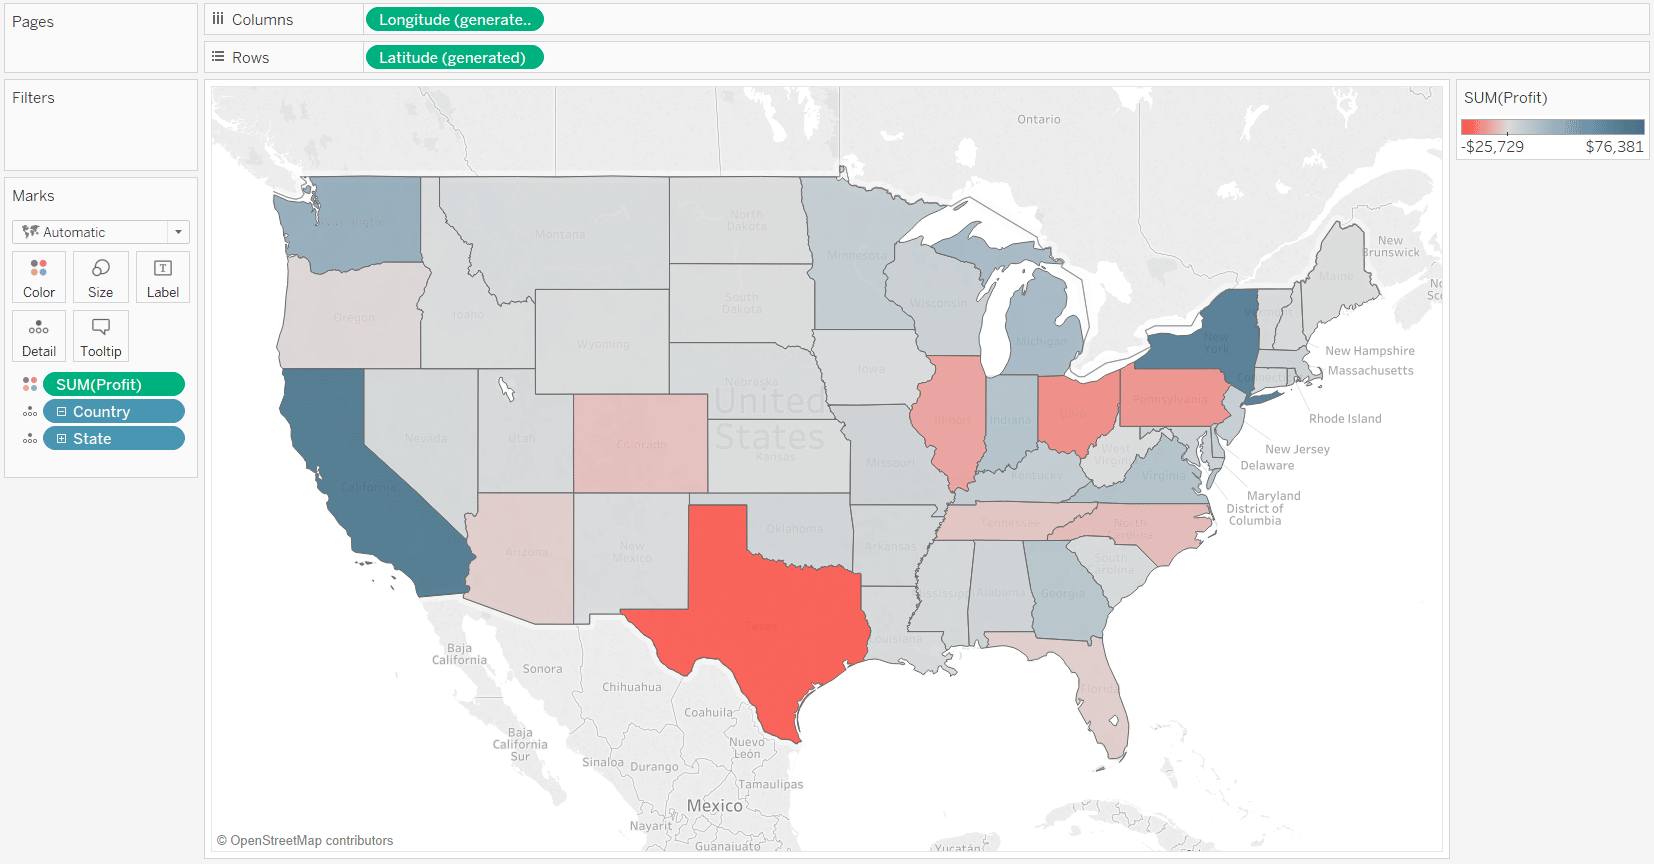
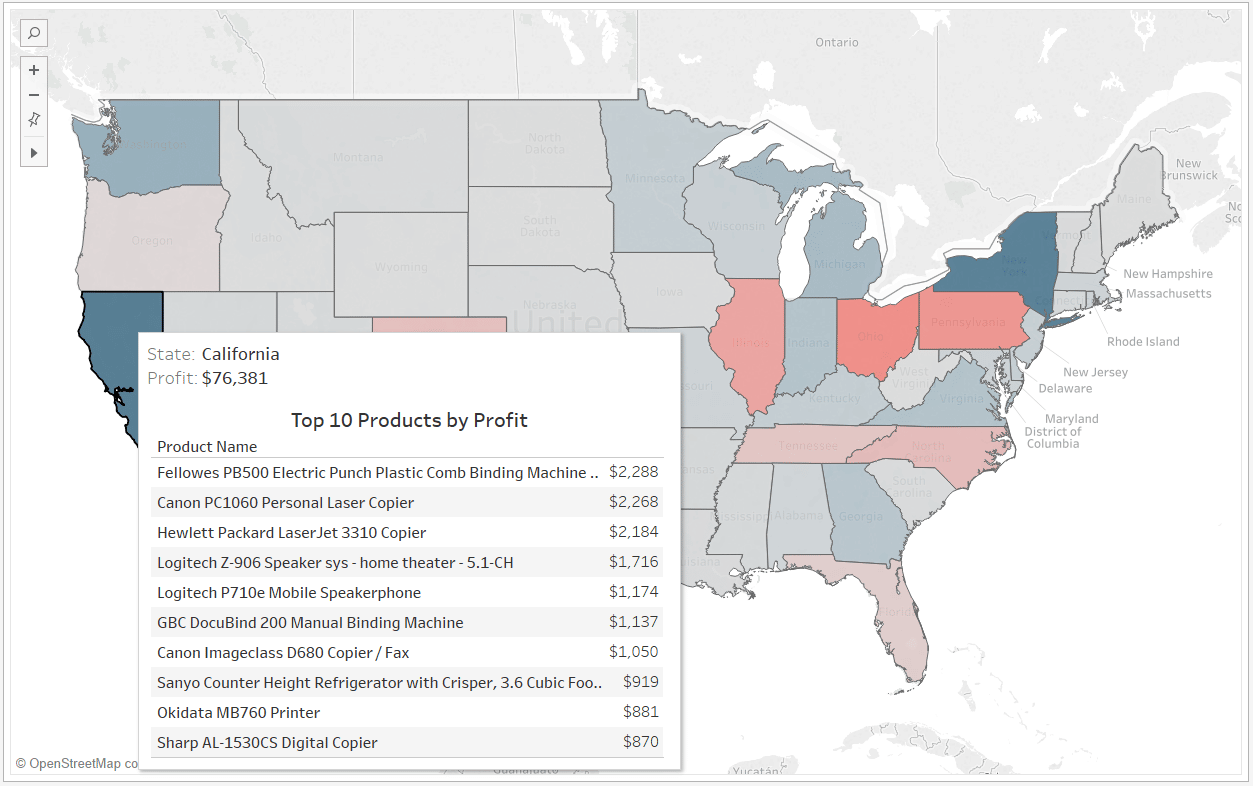
For this tutorial, we will use this map showing profit by US state. When a user hovers over the map, we will set up the tooltips to display the top 10 products by profit within that state.
First, we need to set up a second sheet that contains the list of top 10 products. Before I share a trick for getting the top 10 list to work in the tooltips, I’m going to share a pitfall that you may come across – and perhaps the reason you ended up on this post. Your first instinct is likely to set up the list as follows:
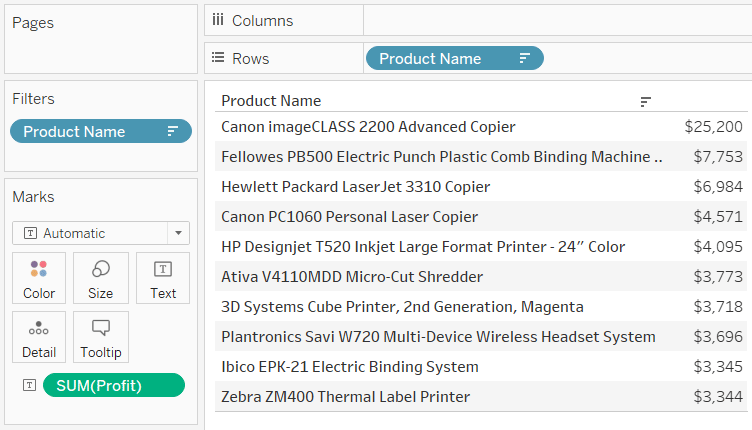
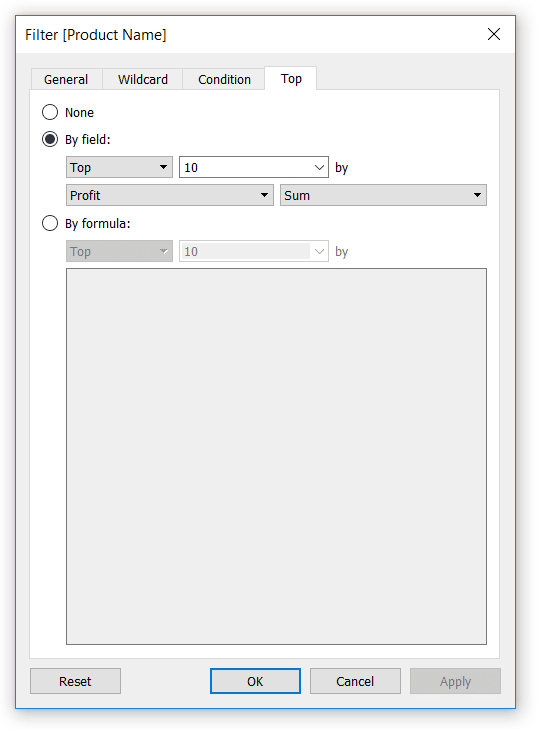
I’ve placed the Product Name dimension on the Rows Shelf, Profit measure on the Text Marks Card, sorted the values in descending order, and added a dimension filter that keeps the top 10 products by profit:
Continue reading with a free account, or login.
Unlock this tutorial and hundreds of other free visual analytics resources from our expert team.
Already have an account? Sign In
By continuing, you agree to our Terms of Use and Privacy Policy.
How to add Viz in Tooltip in Tableau
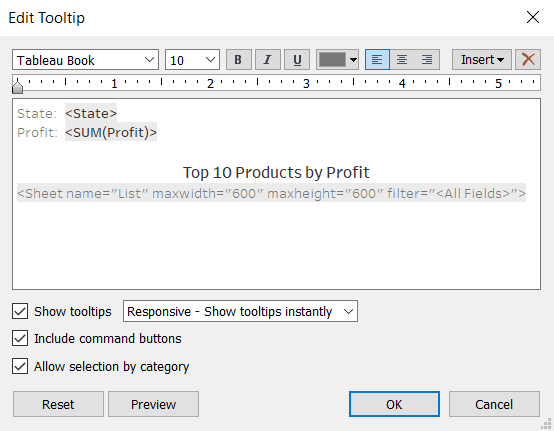
To add this sheet as a tooltip in the map, I must navigate back to the first sheet, click the Tooltip Marks Card, click the Insert button in the top-right corner of the tooltip dialog box that appears, hover over sheet, and choose the List sheet.
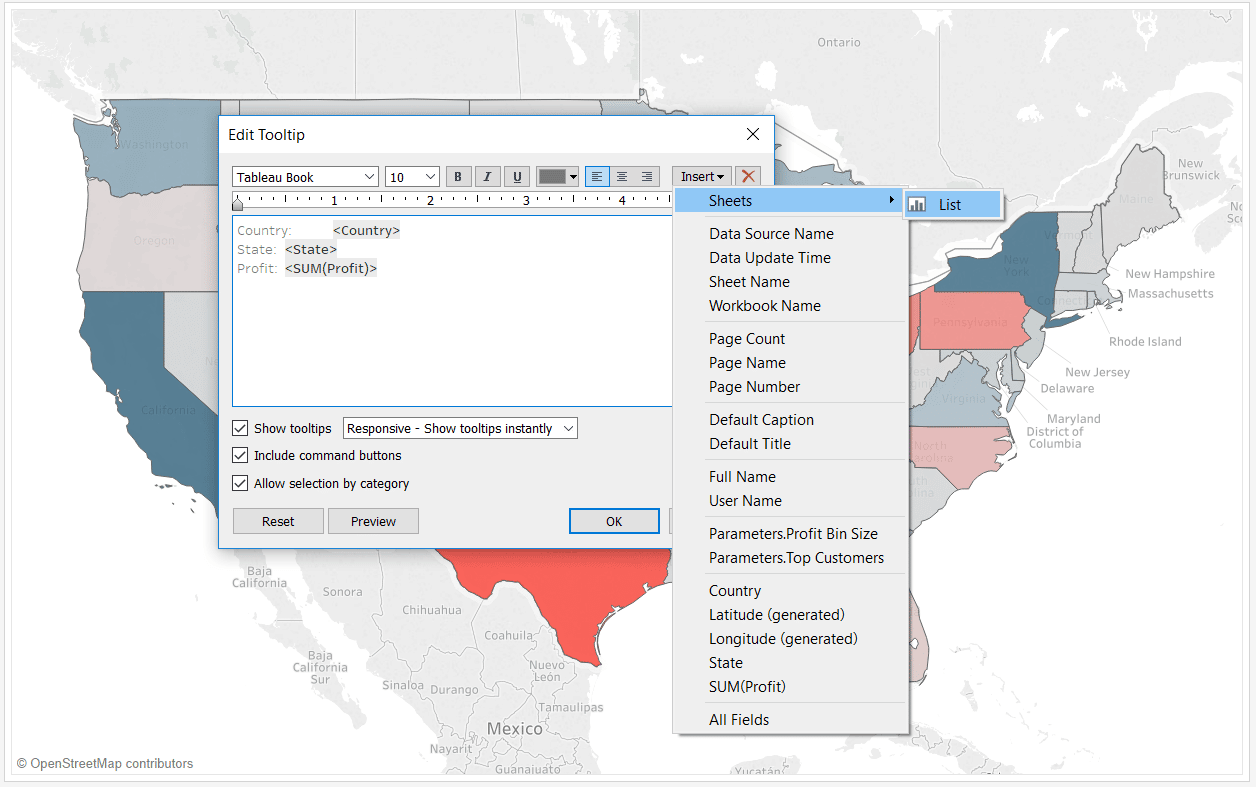
I’ll also clean up the tooltip by placing the list under the other fields, adding some text to describe what’s in the list, and increasing the max width and height of the sheet in tooltip to 600 to ensure the list has room to be shown.
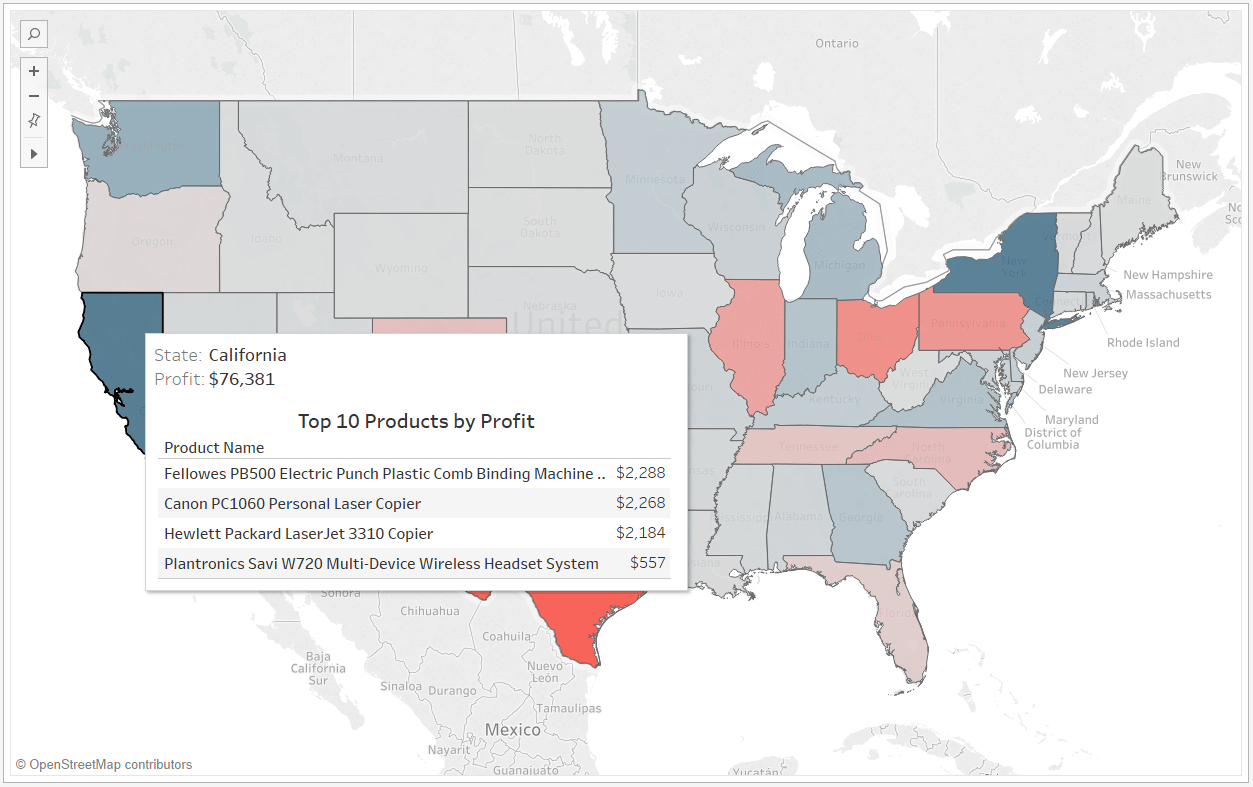
All the components are in place to display the top 10 list when I hover over an individual state, but look what happens when I hover over the state of California:
Understanding Tableau’s filter order of operations
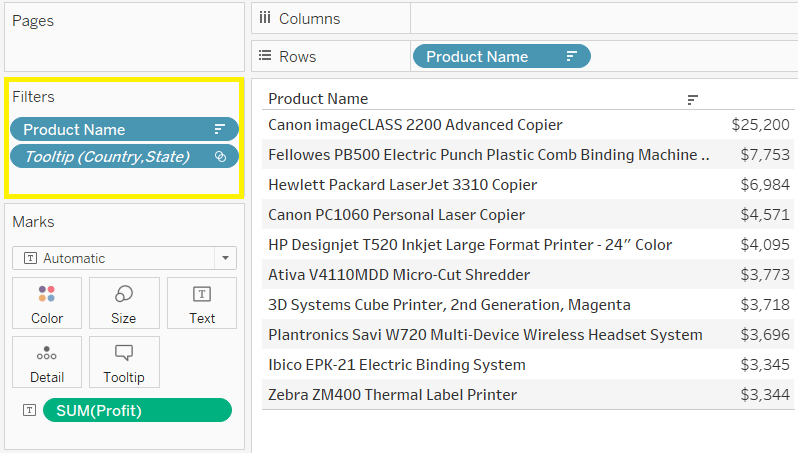
When you add a sheet to a tooltip as we’ve done, Tableau automatically creates a set filter to the underlying sheet. This is similar to what happens when you create a dashboard action. Here are the filters on the List sheet:
What’s happening due to the filter order of operations is that the list is being filtered to the top 10 products overall first, then we see the products within the overall top 10 for each state that is hovered over. We see four products when hovering over California because four of the top 10 overall were sold in the state of California at some point. If the product was never sold in a state, we wouldn’t see any list when hovering over that state.
![]()
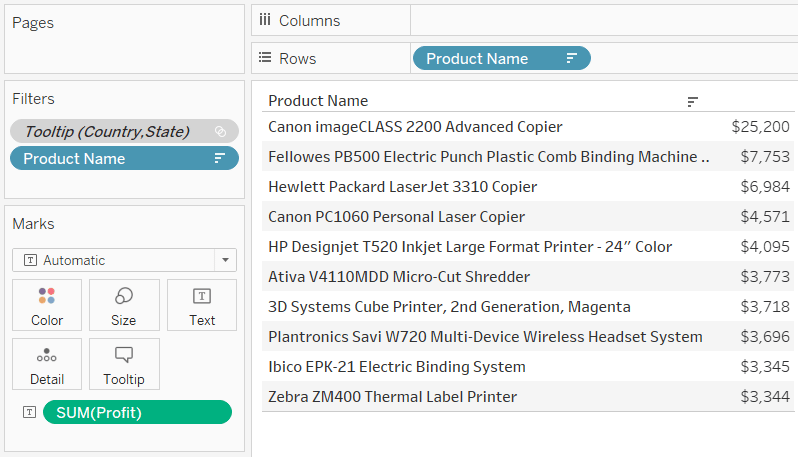
The quickest way to get the result we are looking for is to add the newly added set filter to context so the list filters to each state first, followed by the top 10 filter for that state second. To add a filter to context so that it moves up in the order of operations, click on the filter on the Filters Shelf and choose “Add to Context”. The filter will turn gray to show you it has been added to context:
Now when I hover over the state of California, or any other state, the list is filtered to the state first, then the top 10 for that state is displayed in the tooltip.
There’s a slightly more clever solution that will give you more flexibility to show the top or bottom 10 that involves using the INDEX() function for top N filtering.
First, set up a calculated field with the formula INDEX() <= 10 (or whatever number you want to use as the top or bottom N).
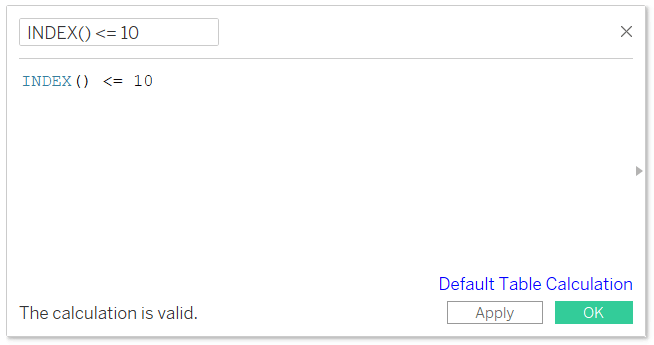
INDEX() is a table calculation that returns the row number, so this is a Boolean formula that will only keep the first 10 rows on the view. I’ll replace the Product Name filter with this newly created calculated field and choose True (keeping only the first 10 rows). With this second technique, you no longer need the set filter added to context, so I’ll also remove that filter from context by clicking on the gray filter and choosing “Remove from Context”.
Note I am only having to remove the filter from context because I’m building on my first example. If you opted to start with this second approach, the second filter would have never been added to context to begin with.
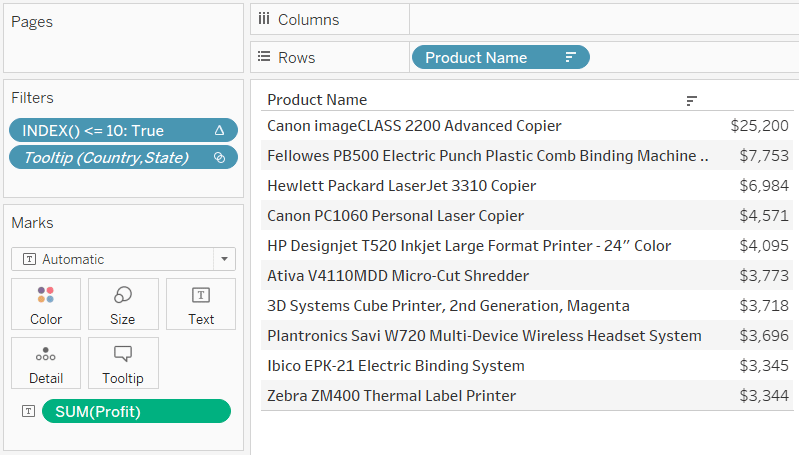
This approach will always keep the first 10 rows displayed regardless of which state is hovered over. The only catch with this approach is you have to ensure the list is sorted appropriately. If you want to show the top 10 products in this case, we would need to make sure the list was sorted in descending order. What’s nice about this is we can easily display the bottom 10 by simply flipping the sort order from descending to ascending. This puts the product name with the lowest profit value first, and our Boolean filter keeps the 10 worst performers on the view.
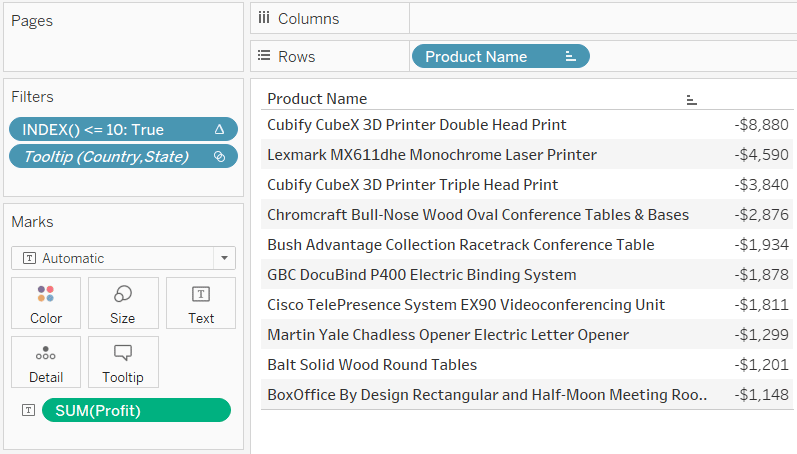
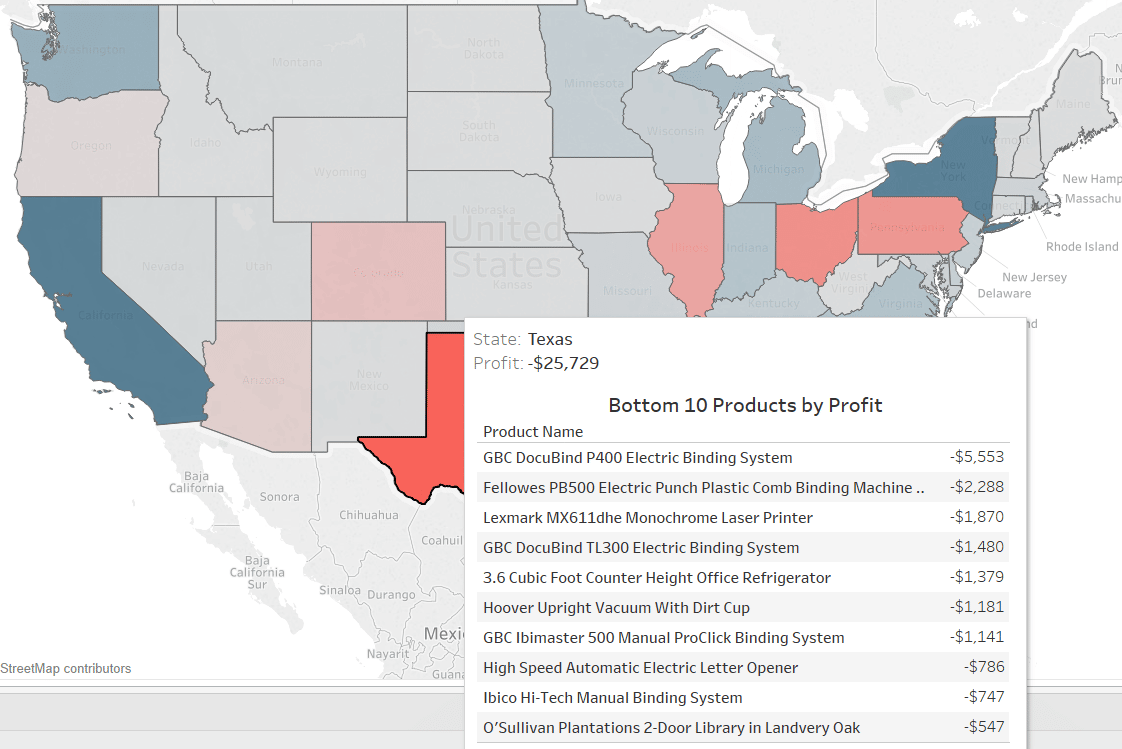
In our map view, Texas is interesting because it appears to be the state that we lost the most profit in. Now if I hover over Texas, the top 10 list will be shown; only now it’s been toggled to display our bottom 10 products by profit (I’ve also changed the list title accordingly).
Note that throughout these examples I’ve used top 10 and bottom 10, but of course these can be set up to show whatever top N or bottom N is appropriate for your business.
![]()
Showing both top N and bottom N
I’ll close this post with one last idea. You can set up two separate sheets – one sorted in descending order to keep the top N and one sorted in ascending order to keep the bottom N – and add them both to the tooltip.
But you can also consolidate the two sheets into one by modifying your INDEX() <= 10 formula to the following:
INDEX() <= 10 OR LAST() < 10
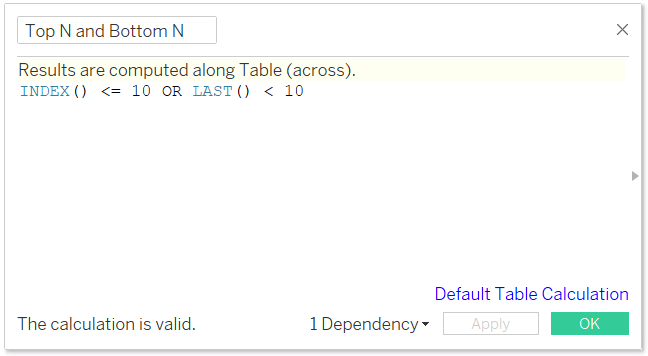
LAST() is another table calculation that computes the difference between the current row and the last row. A difference of less than 10 would represent the last 10 rows. The difference between the last row and itself is 0, the second to last row is a difference of 1, and the difference with the tenth to last row is 9. When your table is sorted in descending order, this formula would keep both the top 10 and bottom 10 on the same table!
Thanks for reading,
– Ryan


Written By
Ryan Sleeper
Related Content

Ryan Sleeper
A tactic for improving the focus of an analysis Reduce the cognitive load on your end users and focus on…
Ryan Sleeper
Make filter results more predictable by basing them on row number Do your filters ever return a result you weren’t…
How to Add a Tooltip to a Dimension in Tableau
Tableau tooltips are one of the best tactics for providing context to a data visualization without taking up valuable real…