How to Turn Data Normalization On and Off in Tableau
Data normalization is the process of adjusting values from different scales to a common scale, providing a better “apples to apples” comparison of the values. For example, looking at varying metrics like ‘total cheeseburgers eaten per year by US state’, ‘total high fives given per year by US state’, and ‘total vacation days taken per year by US state’, will likely show that California leads the way in all three categories. This makes it sound like California is the best place to be in the US, and maybe it is, but these results are most likely due to California having the highest population (i.e. more people around to give each other high fives).
A better analysis would be to figure out how many high fives are given per person per year by US state. There are several ways to normalize data in Tableau including changing the aggregation of a measure, creating a calculated 100-point index, or setting a common baseline. There are also times when it’s valuable to see the raw, unnormalized numbers so our end users have the context of the original scales.
This post shares a method for (1) normalizing data and (2) providing you and your end users the ability to toggle the normalization on and off.
This content is excerpted from my book, Innovative Tableau: 100 More Tips, Tutorials, and Strategies, published by O’Reilly Media Inc., 2020, ISBN: 978-1492075653. Get the book at Amazon.
How to Turn Normalization On and Off in Tableau
How to toggle data normalization on and off in Tableau
As mentioned in the introduction, there are several methods for normalizing data in Tableau. For this tutorial, we will be providing a means for our end users to toggle a metric between ‘Sales by US State’ (unnormalized) and ‘Sales Per Person by US State’ (normalized). If you are using a different method to normalize your data, you should be able to use the following approach, but tweak the logic to match your method.
Continue reading with a free account, or login.
Unlock this tutorial and hundreds of other free visual analytics resources from our expert team.
Already have an account? Sign In
By continuing, you agree to our Terms of Use and Privacy Policy.
I will be using the Sample – Superstore dataset, but that data source does not have a metric for population. So the first step in this case is to append the metric required to normalize the data to the data source. To do this, I looked up the population per state, made a simple two-column data source (State, Population), and joined it to the Sample – Superstore dataset.
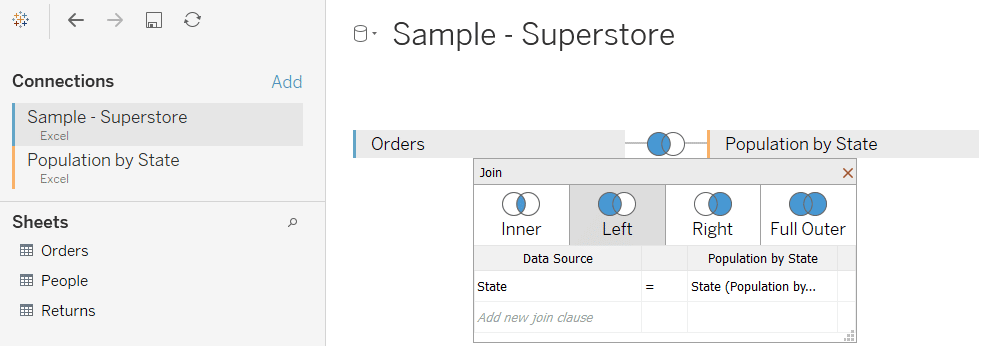
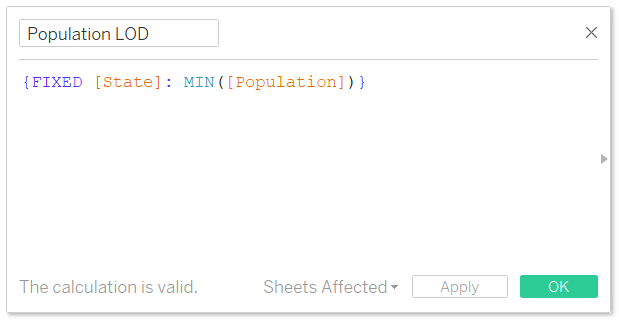
One quick aside, but when joining tables in this way, it’s common for the rows in the table on the right to repeat because they’ll likely have more than one match to the table on the left. You can easily alleviate this by creating a calculated field with a FIXED level of detail expression that only brings back one row at a time. The formula in this case is {FIXED [State]: MIN([Population])}.
An Introduction to Tableau Level of Detail Expressions
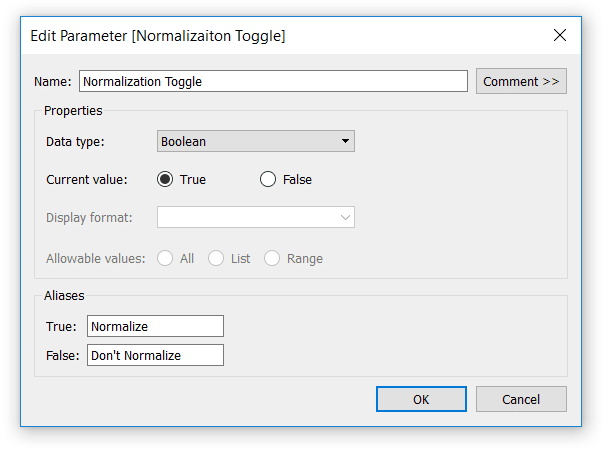
The method for toggling normalization on and off involves creating a parameter. Now that we have the metric we need to normalize the sales data, we will create a parameter by right-clicking any blank space in the Dimensions Shelf, Measures Shelf, Sets Shelf, or Parameters Shelf, and choosing “Create Parameter…”.
![]()
For this case, I’m going to set the data type to Boolean because there are only two possible choices: (1) normalization on or (2) normalization off. I’ll also give the two choices friendly names to help my end user make their preferred choice.
Once the parameter is set up, I need to give Tableau instructions for what to do when each selection is made. When normalization is turned on, I want to divide the metric being normalized by the population metric created above. I’m using population, but tweak the logic and/or use your own denominator as desired. When normalization is turned off, I want to use the actual (i.e. non-normalized) sales values. To do this, I’ll create a new calculated field; here’s how the formula looks when normalizing the Sales metric:
IF [Normalization Toggle] = True THEN SUM([Sales]) / ATTR([Population LOD])
ELSEIF [Normalization Toggle] = False THEN SUM([Sales])
END
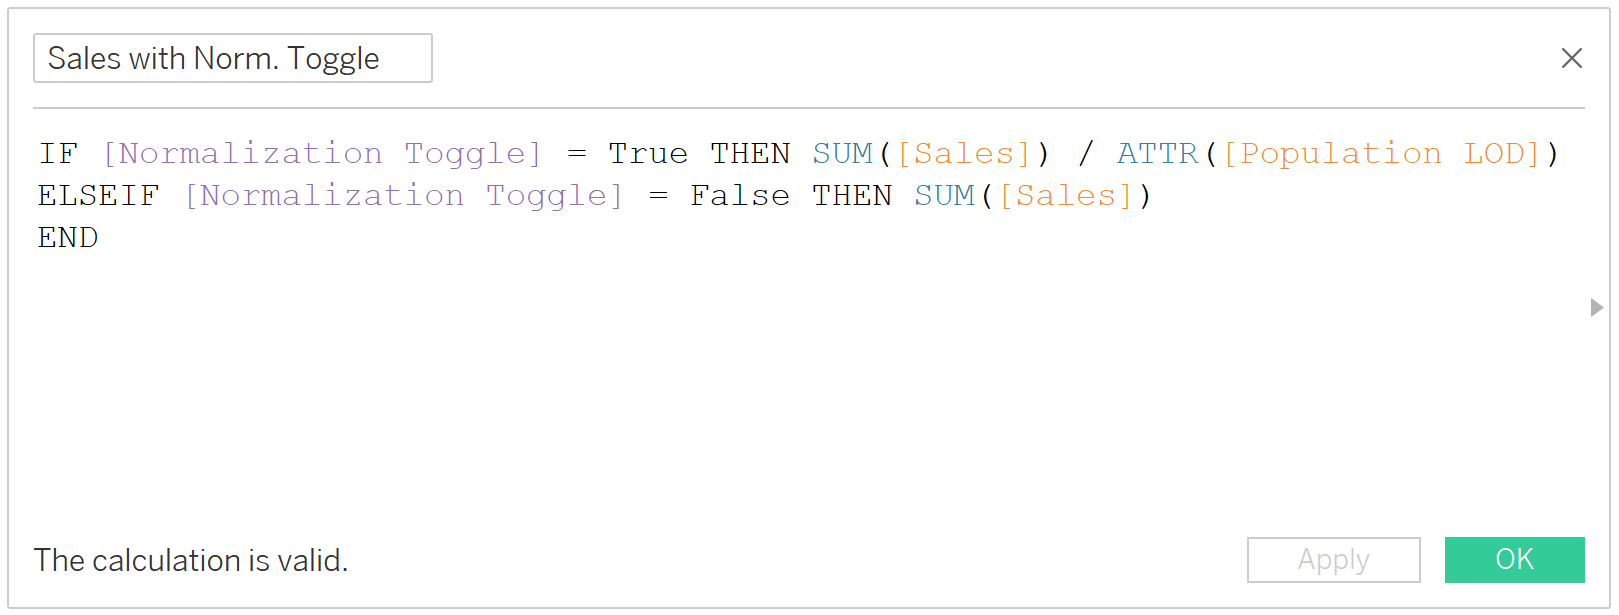
Note that the aggregation before the Population LOD measure is “ATTR”; this returns the aggregation within the calculated field (which is SUM). I could get the same result by using an aggregation of SUM instead of ATTR.
Lastly, if you want you and your end users to have one-click access to toggle the normalization on and off, ensure you show the parameter control by right-clicking on the parameter in the Parameters Shelf and choose “Show Parameter Control”.
![]()
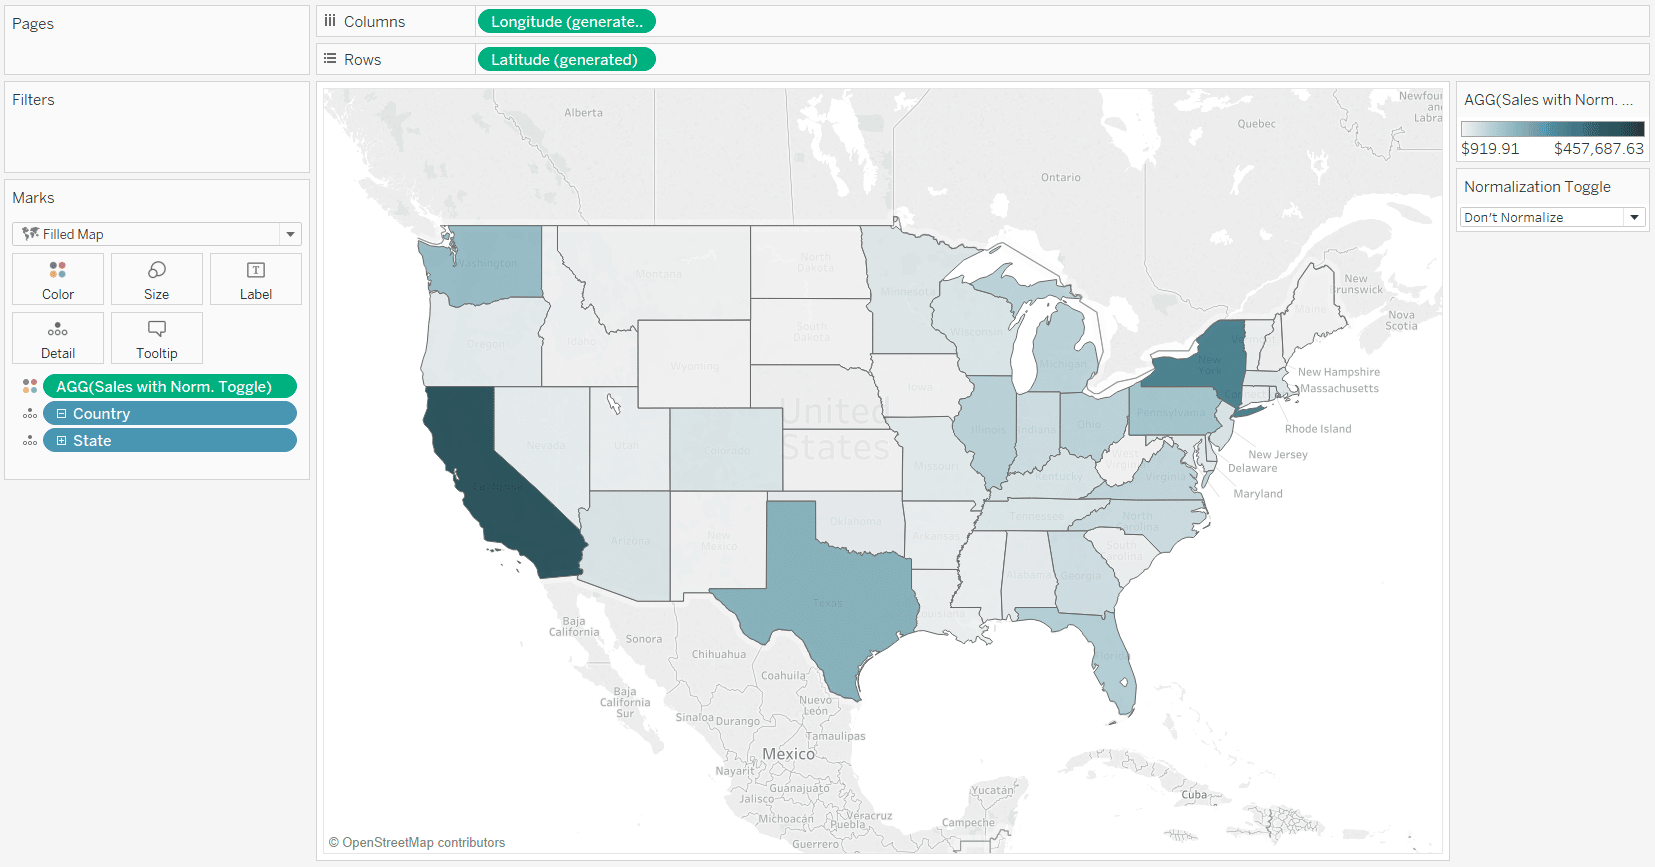
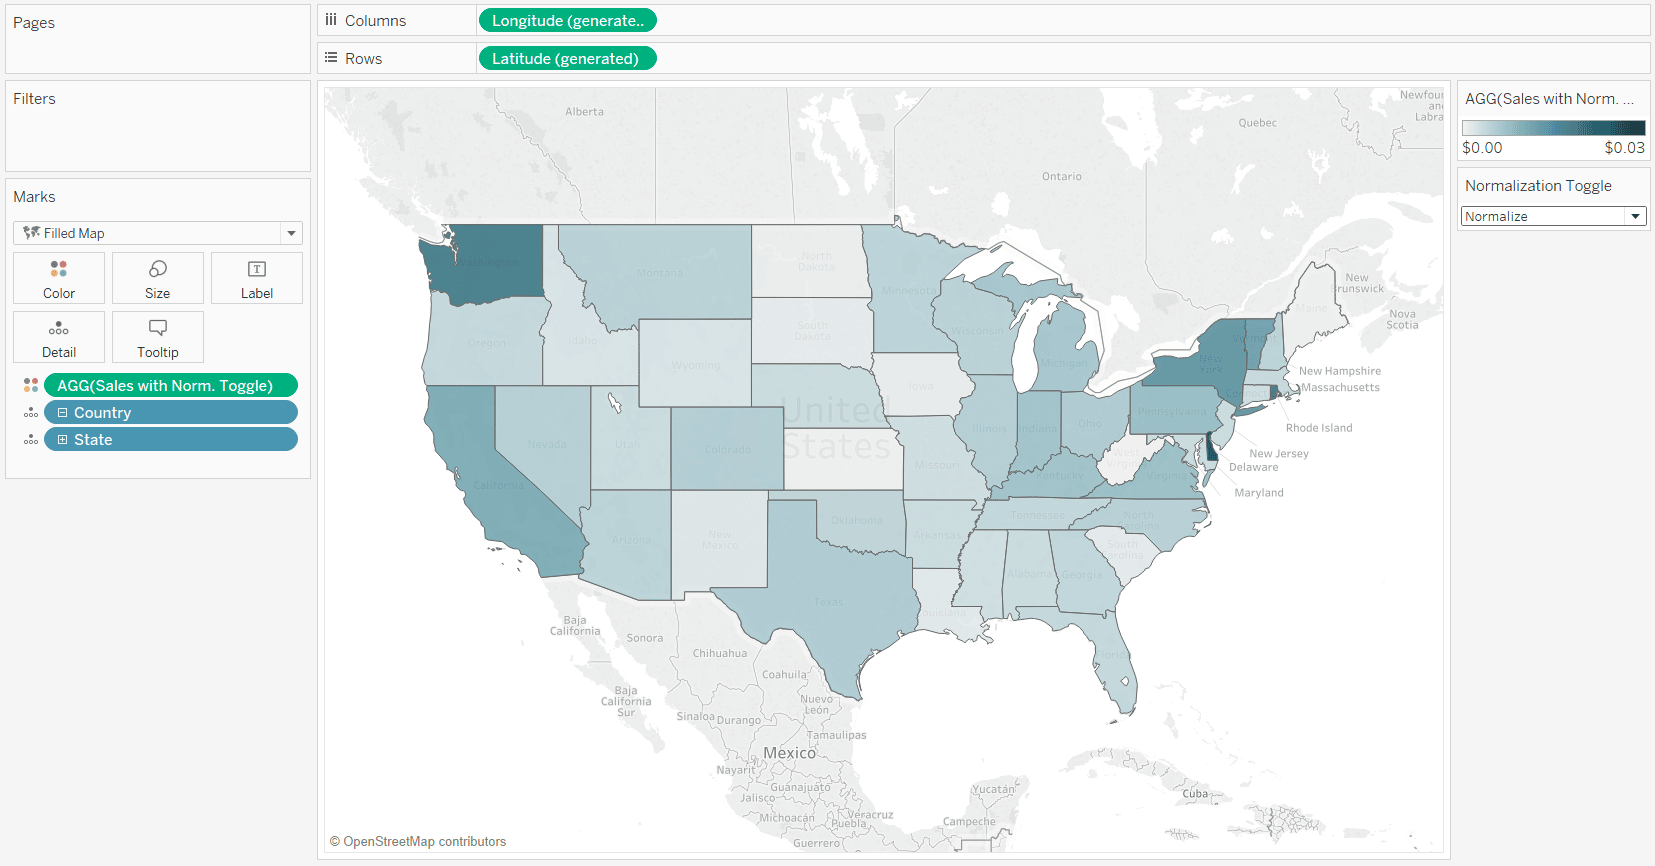
Here’s how my final view looks with a filled map for Sales by State. In the first image, the Sales measure is not normalized, showing that the most populated states lead the way in absolute sales volumes. However, when we toggle the normalization on as seen in the second image, we see a very different story!
Sales by US State – Not Normalized
Sales by State – Normalized
Thanks for reading,
– Ryan


Written By
Ryan Sleeper
Related Content
Bringing Tables Together: Tableau’s Physical Layer

Welcome to our series on bringing tables together! This first article is all about the physical layer in Tableau, including…
3 Ways to Normalize Data in Tableau


While performing data analysis, you might find yourself needing to transform your data to further unlock some insight. One way…

Ryan Sleeper
Flip Between Two Dashboard States with the Click of a Button In this video, Ryan shows you how to (1)…