How to Make a Custom Map in Tableau
To me, one of the most undervalued features in Tableau is its ability to visualize custom maps. Simply double-clicking on a field that Tableau recognizes as geographic will generate a symbol map, saving us hours of manual work. As discussed in 3 Ways Psychological Schemas Can Improve Your Data Visualization, the spatial context maps provide help us and our end users process data more efficiently.
Did you know you can create a map out of literally anything in Tableau? My best known examples of this are stadium maps and showing the source of concussions, but the same principles used to create these maps can also be used to create custom geographic maps. Creating custom maps is a relatively easy way to set your reports apart and/or get your maps ‘in-brand’.
This tutorial will show you how to map a background image in Tableau with any map image.
How to map a background image to create a custom geographic map in Tableau
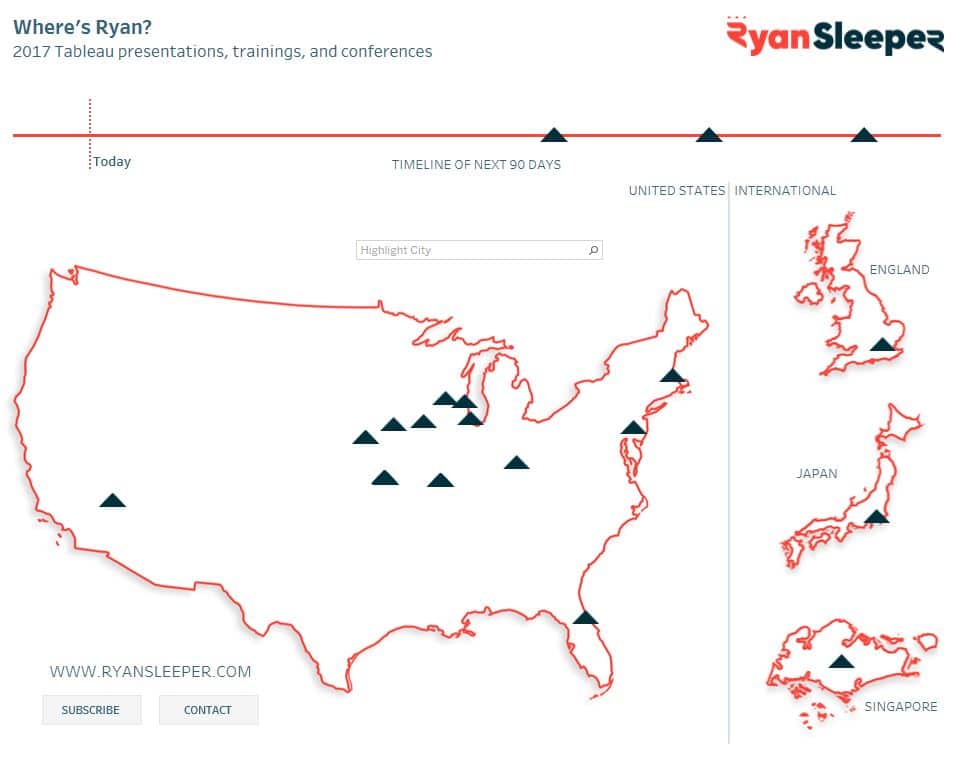
To help illustrate how to create a custom map in Tableau, I am going to recreate one of the maps featured in my visualization, Where’s Ryan. The maps were used to show where I would be speaking in 2017, and I wanted them to be minimalist and represent my brand.
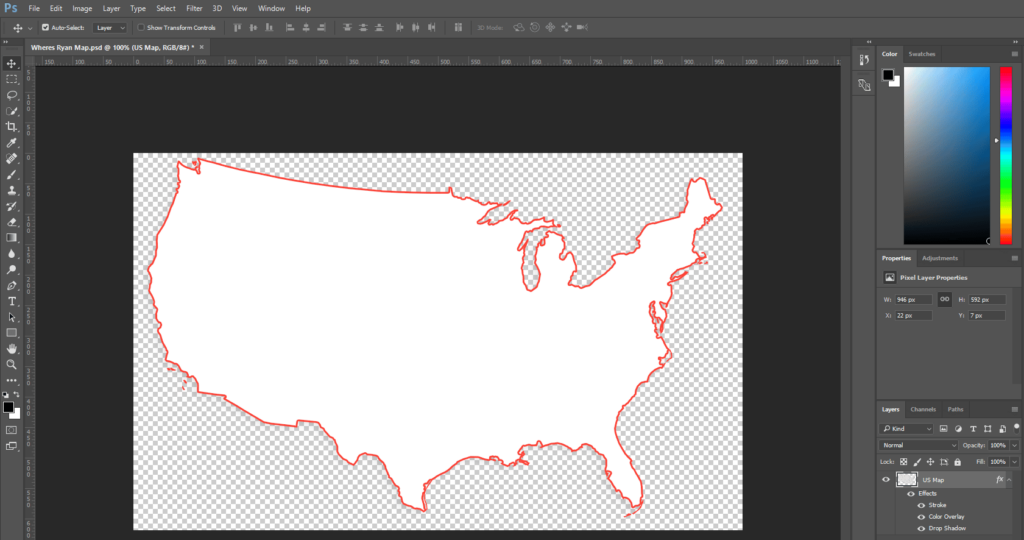
To start the map of the United States, I first needed a silhouette of the country where I could add my design. As discussed in Data Visualization: The Stolen Art, there is legal precedence that people can’t own silhouettes of objects. Things get grayer if the original artwork is a silhouette, but nobody owns the shape of the United States. For that reason, I was able to simply do a Google search for “US map PNG” to find the foundation for my map.
![]()
Create a free account, or login.
Unlock this tutorial and hundreds of other free visual analytics resources from our expert team.
Already have an account? Sign In
You can use any image as the foundation, but I recommend using a PNG image type because the background will be transparent. This will make it easier to add effects like strokes and shadows. You can map any image you choose and add the effect how ever you know best, but I chose to make a simple map with a white overlay, red outline, and subtle shadow. This is not a PhotoShop blog, but for context, here is how my underlying custom map looks.
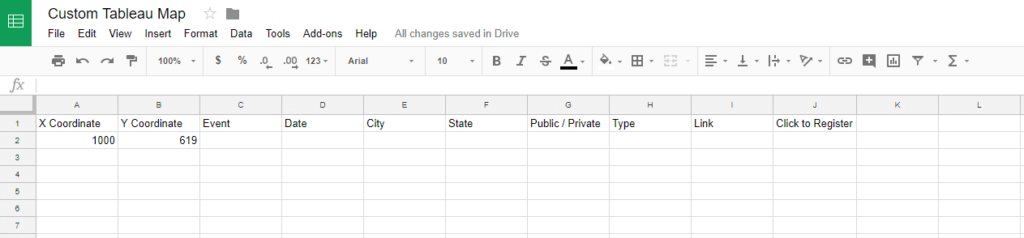
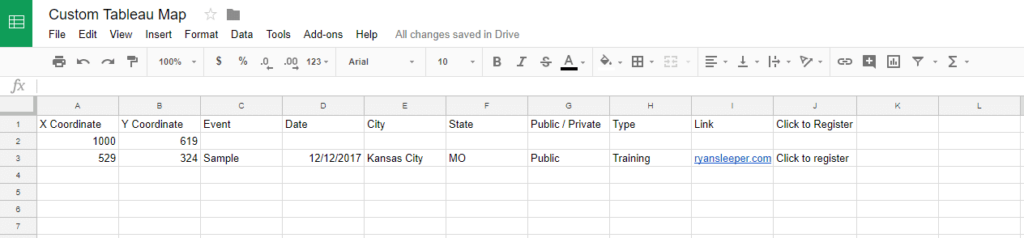
It’s important to note the dimensions of the image that you are using. This can be found on a PC by simply hovering over the image in the folder where it is saved. My US map is 1000 pixels wide by 619 pixels high. These dimensions will be used in the next step, which is to create an Excel or Google Sheet with the fields needed for your visualization, plus a column for the X coordinate, and a column for the Y coordinate.
In the first row, put the width of your custom image as the X coordinate, and the height of your custom image as the Y coordinate.
Here’s how my data source looks at this point.
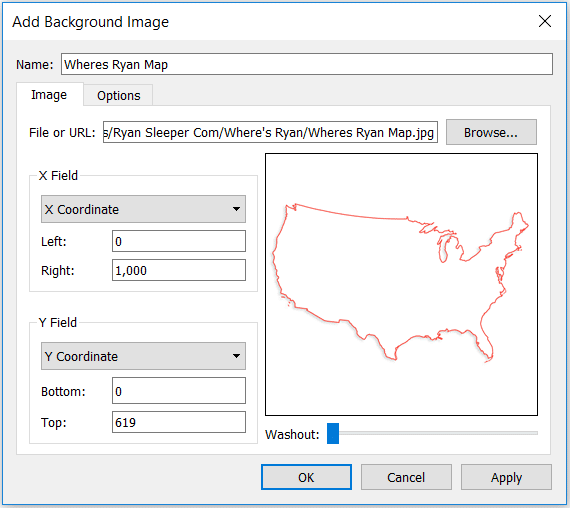
Next, I’m going to start a new Tableau workbook and connect to the Google Sheet pictured above. Now, on a new worksheet, click Map in the top navigation > Background Images > [the data source you are using]. This will open a new dialog box where you can choose your newly created custom background image / map.
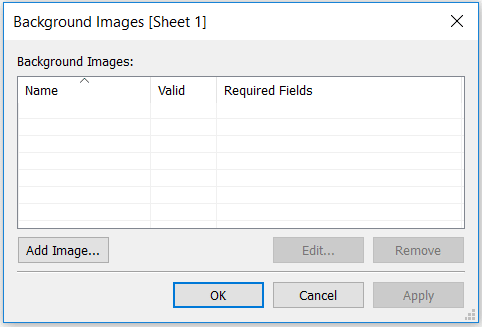
After clicking “Add Image…”, browse to find the image that you want to use, set the range of the X Coordinate field to be 0 to the width of the image (1000 in my case), and set the range of the Y Coordinate field to be 0 to the height of the image (619 in my case).
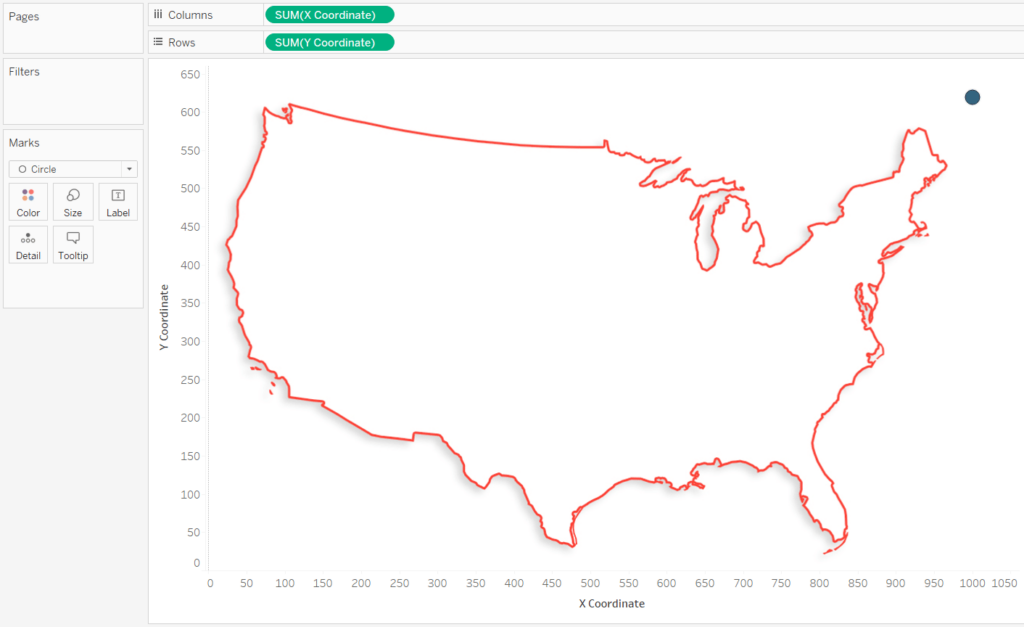
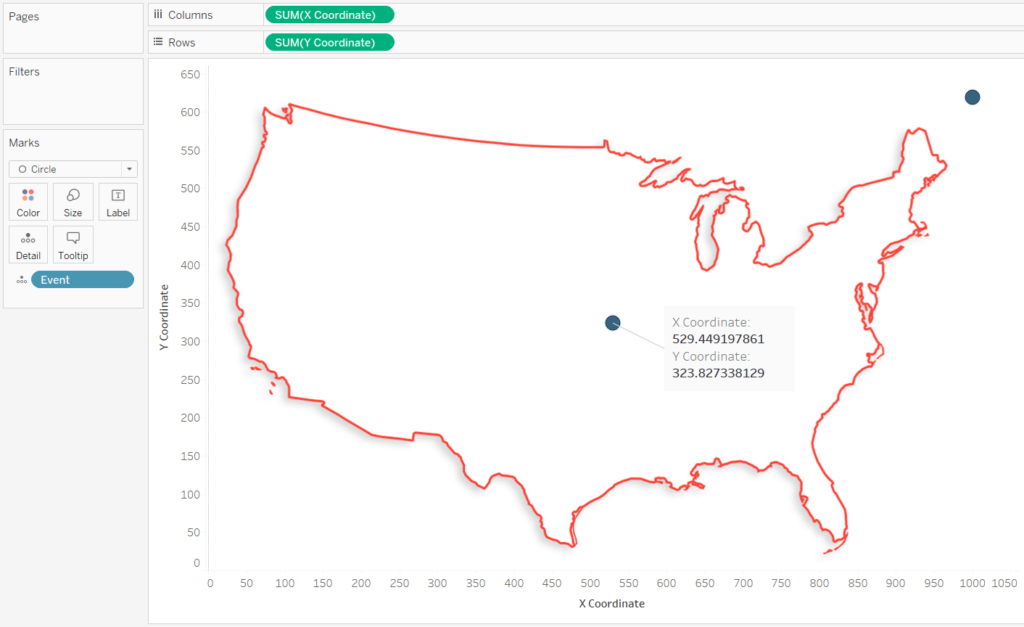
Place the X Coordinate field from your data source on the Columns Shelf and the Y Coordinate field from your data source on the Rows Shelf. This should show you the background image, and one circle, which represents the maximum height and width of the image. Here’s how my background image looks with a circle at 1000 pixels over on the X-Axis and 619 pixels up on the Y-Axis.
Now that we’ve laid the foundation, you can look up X / Y pairs to add new marks to the custom background image. The easiest way to do this is add an annotation by right-clicking on the view, hovering over “Annotate”, and clicking “Point…”.
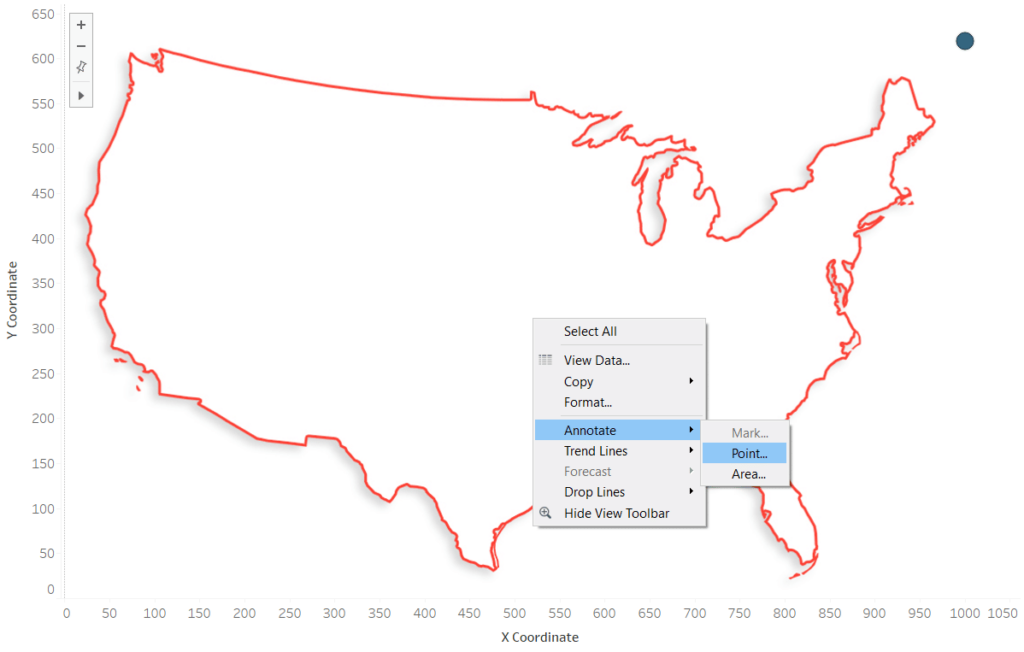
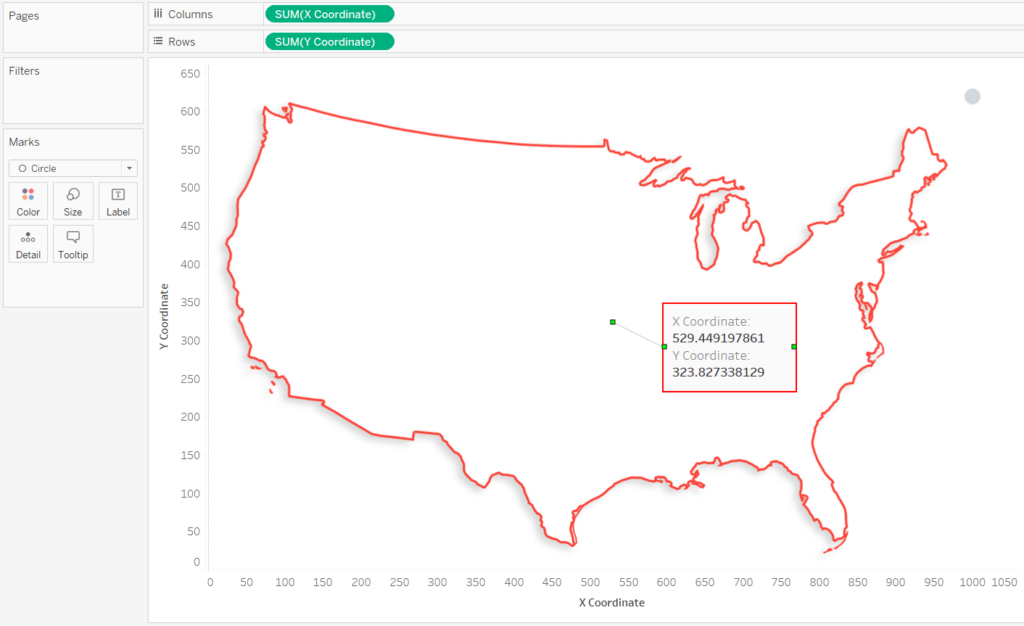
By default, the annotation will include the fields being used on the view. We are only using the X Coordinate and Y Coordinate fields, so those are the fields you will see on the annotation. Once the annotation is on the view, you can move the point being annotated by dragging and dropping it anywhere on the image; the annotation will update automatically. Here’s how the annotation looks when moving the annotation to Kansas City.
Now I will go back to my data source to add a record, ensuring that the coordinates for Kansas City are recorded in the respective X-Coordinate and Y-Coordinate fields. Note that decimals are not needed, so you can round the coordinates.
After refreshing the data source and placing the Event field on the Detail Marks Card, a new mark will appear on Kansas City.
![]()
It’s important to place a unique identifier for each mark (“Event” in my case) on the Detail Marks Card; this will place a mark at the correct coordinates instead of adding the coordinates for multiple rows together.
These steps can be repeated to add as many marks as you want to a custom background image. To finalize the view, you can hide the axes, filter out the placeholder mark, and remove the annotation.
Thanks for reading,
– Ryan


Written By
Ryan Sleeper
Related Content
3 Ways to Make Magnificent Maps in Tableau
Maps are one of the most effective chart types in Tableau and are also among the easiest chart types to…
How to Add 14 Custom Tableau Maps with Mapbox
If you’ve ever had to look up the X / Y or latitude / longitude coordinates to create a custom…

Ryan Sleeper
Create and Encode Custom Shapes Using Any Image We’ll have some fun mapping custom polygons on a baseball stadium. You’ll…