WHAT’S INCLUDED
Playfair+ is all-inclusive, on-demand visual analytics training.
Software skills training including Tableau, Power BI, Alteryx, Figma, Excel, Oracle Analytics, and more
Learning paths organized around the tenets of visual analytics: Strategy, Data Prep, Design, and Engineering
Atlas data visualization catalog, featuring 20+ customizable chart types in more than 70 variations
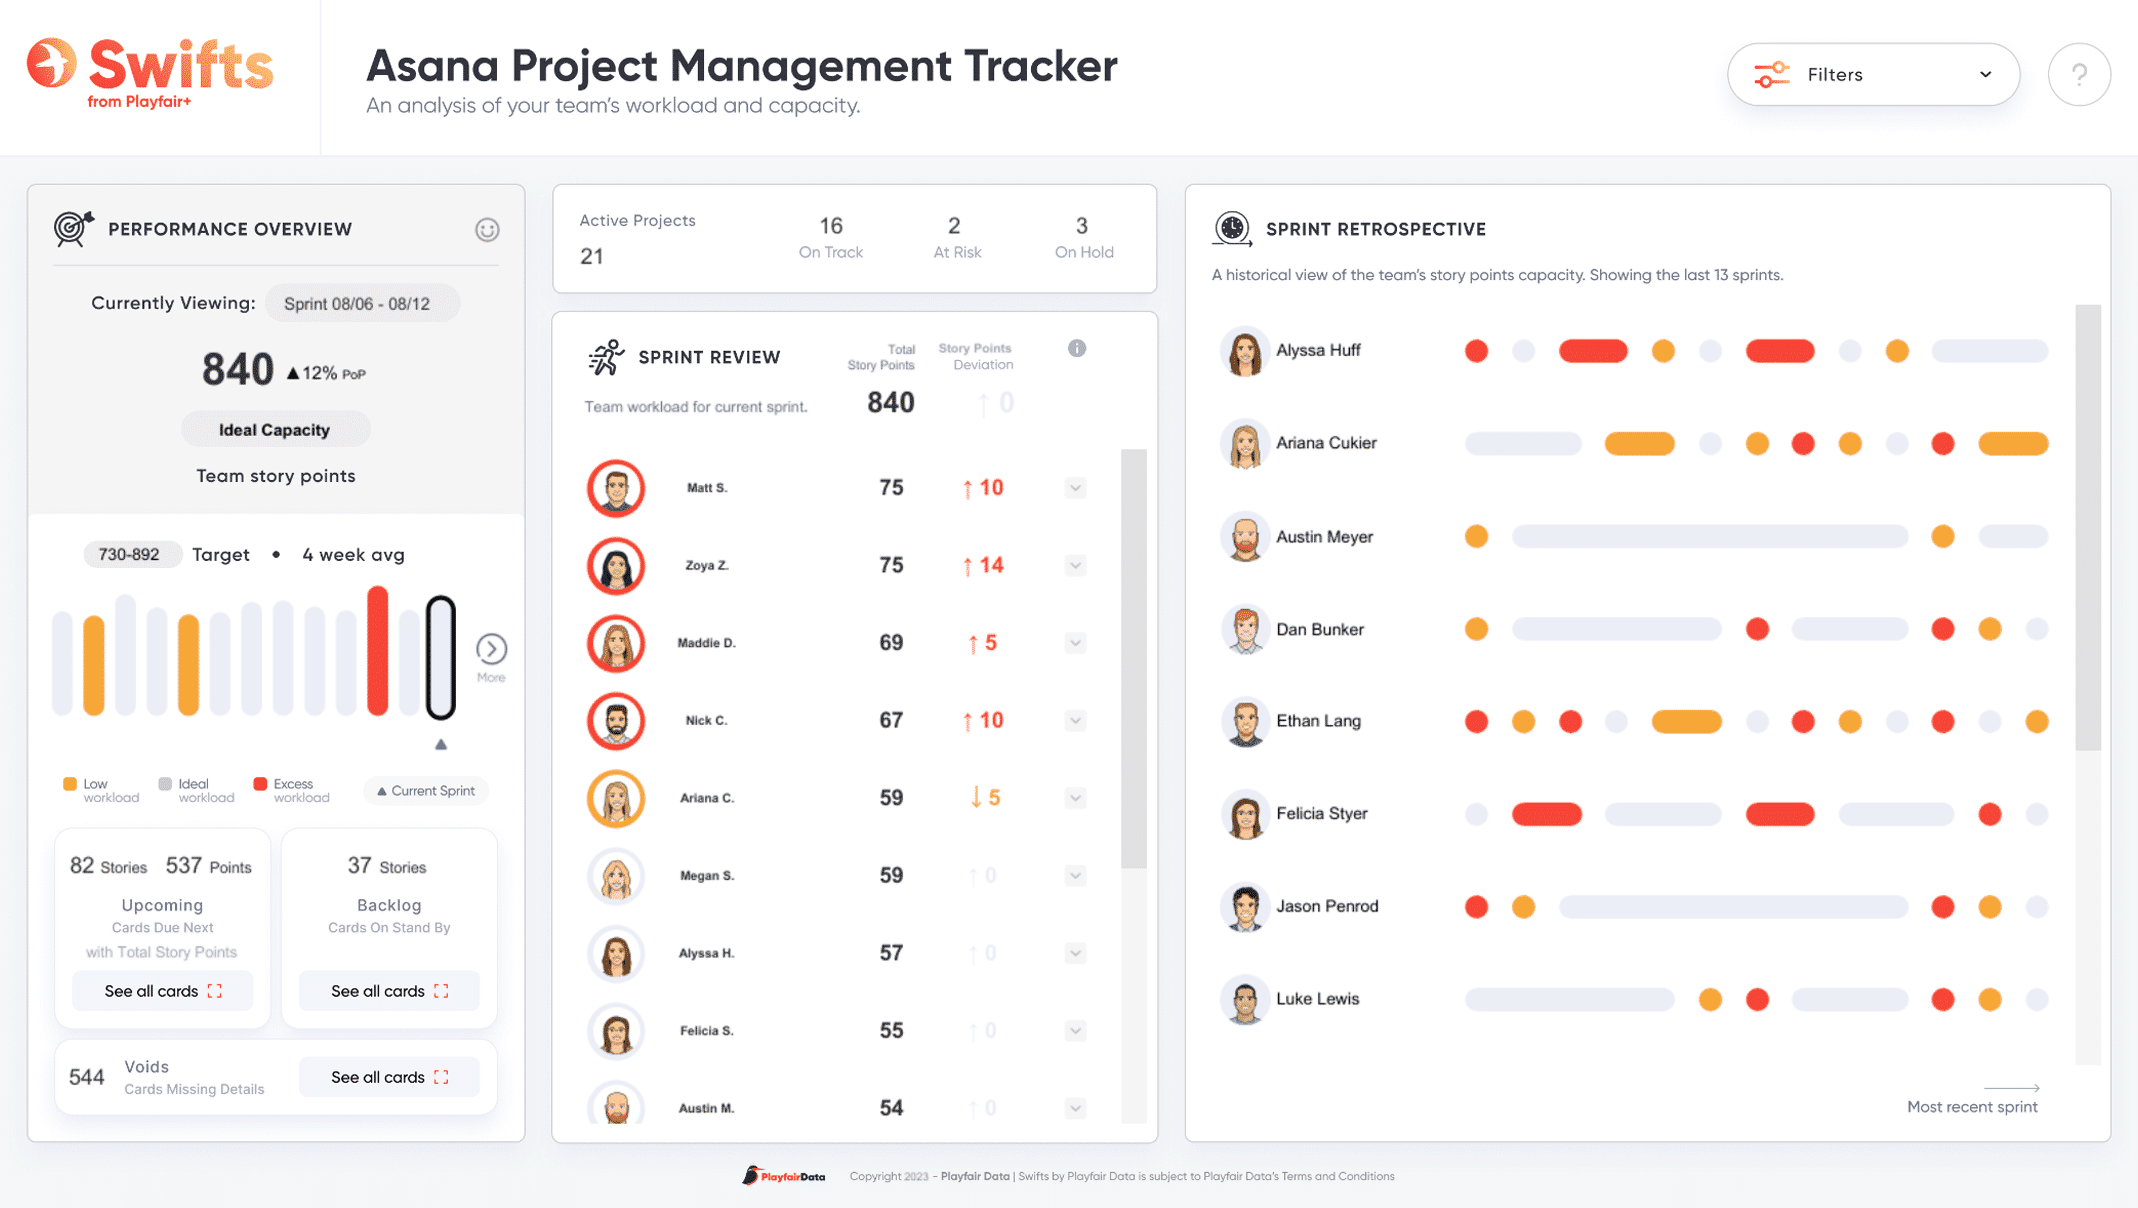
Downloadable, turnkey dashboard templates for financial analysis, project management, and other use cases
Digital credentials to prove your proficiency in advanced analytics, data engineering, and more
Pricing
Free
No Credit Card Required
$0
- Hundreds of written tutorials
- Curated practice data
-
 Download the world's largest mock dataset to help you learn hundreds of innovations.
 - Weekly email updates
- Bookmarked lessons
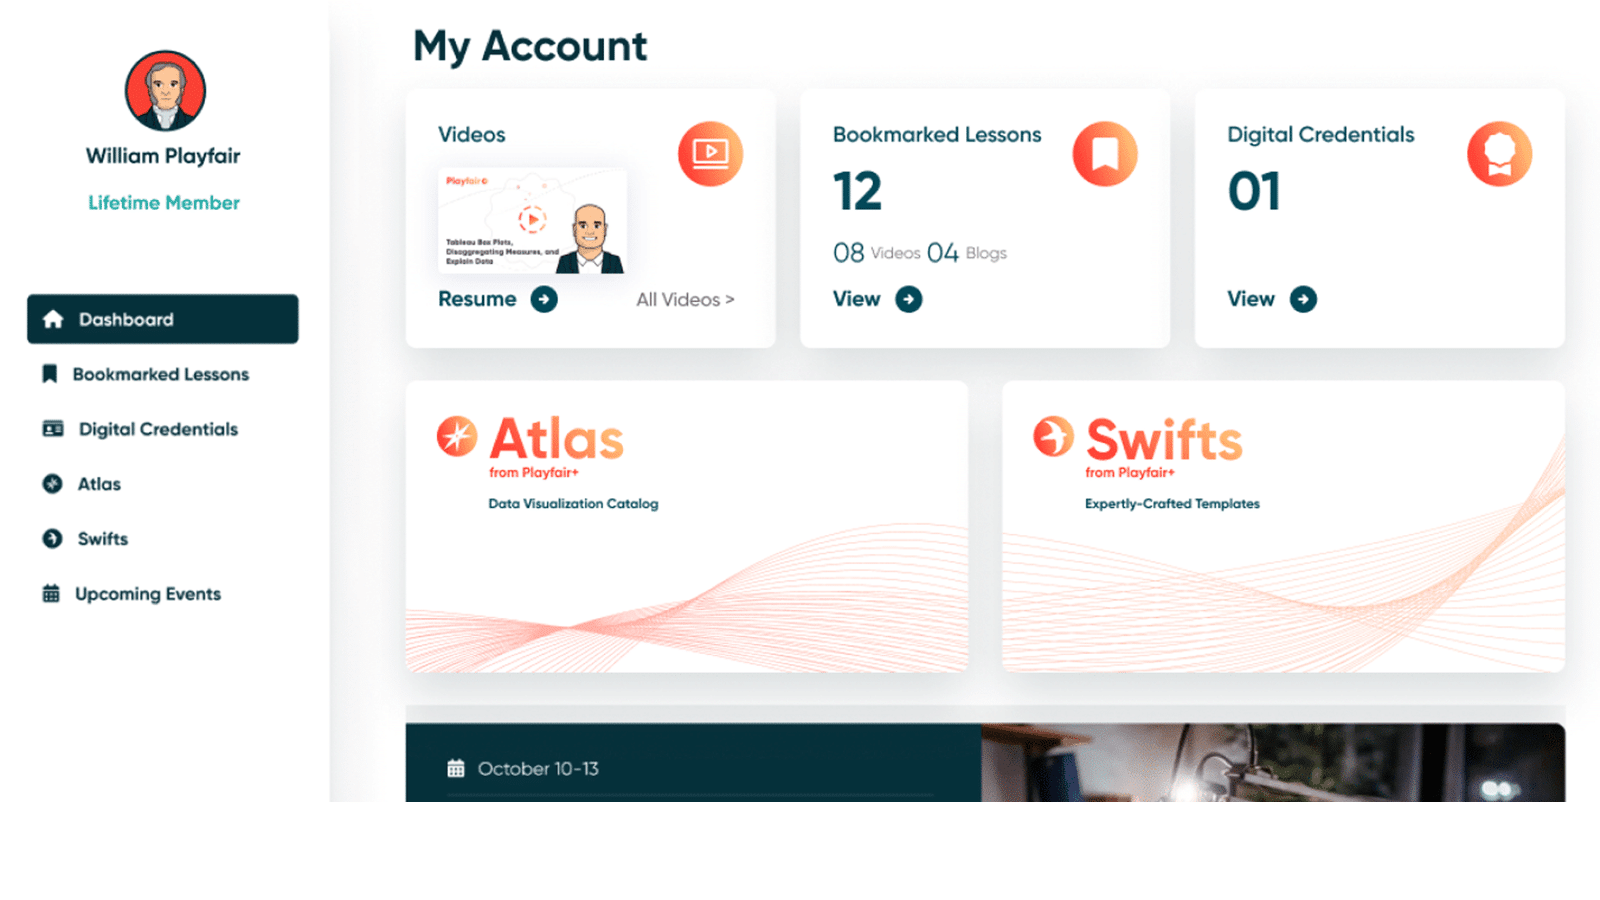
- Personal account dashboard
Core
Cancel Anytime
$35 /mo
-
Everything in Free plan +
- Hundreds of video tutorials
- Additional upskilling resources
-
 Explore the industry-leading data visualization catalog.
 -
 Access instructor created courses on a range of skills and software.
 - Live training event discounts
- Digital certifications
- Monthly instructor book drawings
Premium
Cancel Anytime
$75 /mo
-
Everything in Core plan +
- All-inclusive platform access
-
 Access any and all live virtual public training events held throughout the year.
 -
 Elevate your visual analytics with expertly-crafted dashboard templates.
 -
 Learn how to maintain and improve your data projects with hand-curated content.
 -
 Navigate your many Premium benefits with this state-of-the-art chatbot.
 - Monthly signed book drawings
- Prioritized account support
- Invites to beta test new benefits
Premier Visual Analytics eLearning
A blended learning solution.

The on-demand visual analytics training platform leveraged by 71 of the Fortune 100 – plus thousands more.
Playfair+ members enjoy access to hundreds of written and video tutorials to help them translate their data into value – but the benefits go way beyond your typical education platform.
Members also receive access to our industry-leading visual analytics catalog, Atlas, expertly-crafted dashboard templates built by the team at Playfair Data, Swifts, digital credentials to prove your team’s analytics expertise, and much more.

Two ways to access benefits
Core Membership
Core members receive unlimited access to our growing library of on-demand video tutorials, digital credentials to prove your proficiency in visual analytics, instructor-curated training playlists, our award-winning data visualization catalog, Atlas, and more.
$35/month (cancel anytime)

Premium Membership
Premium membership means all-inclusive access to everything Playfair+ has to offer. In addition to everything that comes with our core benefits, Premium members can attend every live training event we host throughout the year, get on-demand support from the Will.ai.m chatbot, and download templates created by our expert team to address a variety of common analytics challenges. The total estimated value of all benefits exceeds $500,000.
$75/month (cancel anytime)

Playfair+ Course Catalog
Translate your data into insight with our library of visual analytics tutorials.
All members receive exclusive access to over 400 tutorials and counting across twelve learning paths
Strategy • Fundamentals
Measure twice, cut once. We’ll lay a solid foundation for your visual analytics practice by helping you understand your audience and set measurable objectives.
Data Prep • Fundamentals
Let’s cover essential data engineering considerations including dealing with structured vs. unstructured data, data granularity, and the shape of data.
Design & UX • Fundamentals
Not just “pretty charts”, but critical tactics for connecting with your stakeholders including color theory, data visualization choices, and user interface design.
Engineering • Fundamentals
Build the most effective chart types in your visual analytics software of choice – plus introductions to key features like calculated fields and filters.
Strategy • Intermediate
You’ll learn proprietary strategies and frameworks used on the consulting side of Playfair Data including the Playfair Venn, Playfair Perspective, and the Decision-Ready Data framework.
Data Prep • Intermediate
Make your data more usable with logical calculations, handling null values, and consolidating your data through joins – with best practices for ETL development throughout.
Design & UX • Intermediate
Learn to tell a more memorable story with your data through user experience considerations, dynamic customizations, and audience-focused design.
Engineering • Intermediate
Unleash your data by understanding conditional logic in calculated fields, table calculations, and level of detail calculations – plus the ins and outs of intermediate chart types.
Strategy • Advanced
Gain a true competitive advantage by understanding advanced preattentive attributes, connecting with your audience through psychological schemas, and improving your decision making process.
Data Prep • Advanced
Show your data who’s boss with custom aggregation, advanced date calculations, data processing best practices, data management, and automation.
Design & UX • Advanced
In this track, you’ll learn how to make your data accessible to the largest audience possible, thinking of your data visualization as a strategic asset, and designing for complex insights.
Engineering • Advanced
Take control of your period over period comparisons, understand advanced calculations like moving average and standard deviation, and advanced charts – some developed right here at Playfair Data!
Why Playfair+
There are many benefits of Playfair+ that make our platform uniquely positioned to help you master visual analytics on demand, at your own pace.
Visual analytics training from some of the most qualified instructors in the world
Visual analytics innovations you won’t find anywhere else
New content is added to the Playfair+ platform every month
Personal member dashboards to track progress and resources
Related content recommendations handpicked by the instructor
Press play on your path to data mastery.
