
Cross-Functional Expertise
Want to know how we’re able to create so many visual analytics solutions for dozens of the world’s best-known brands?
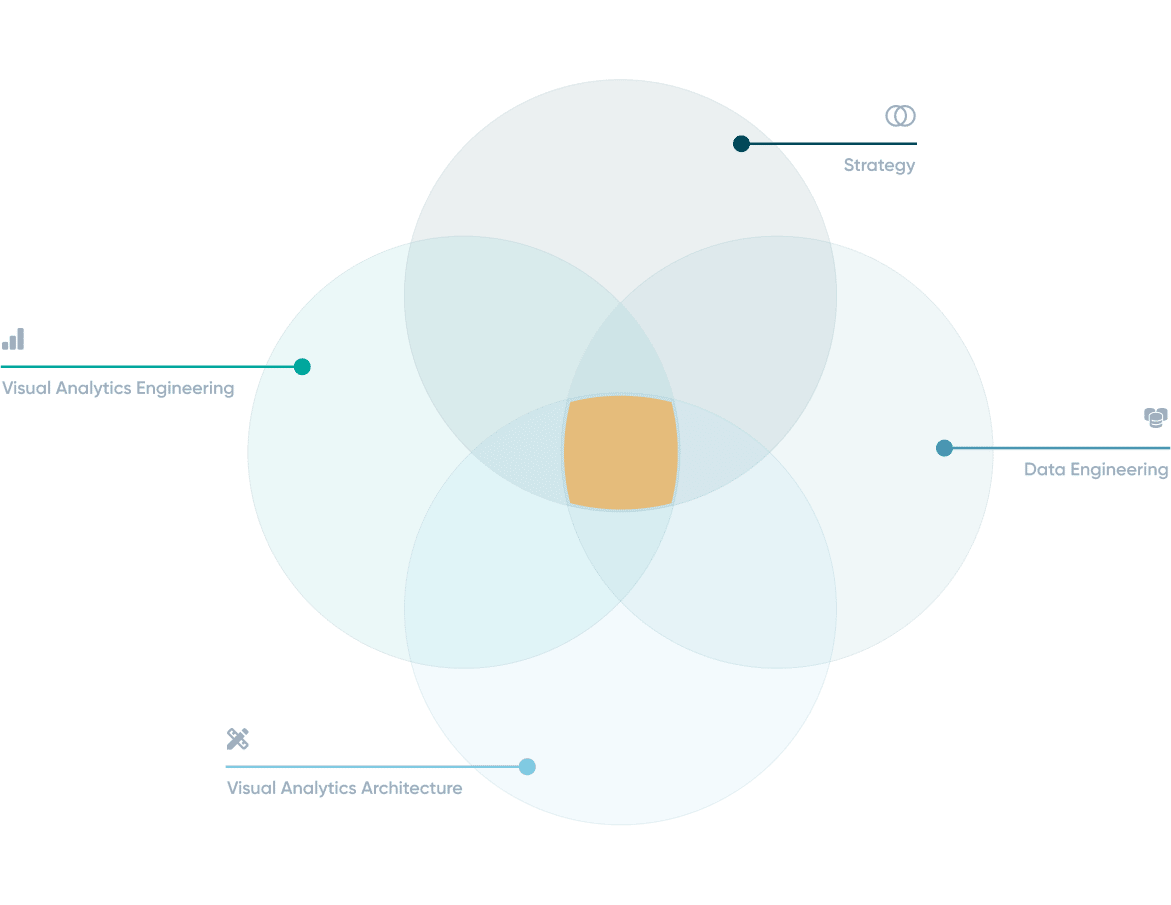
We know that no individual on our team would be as successful without each other. That’s why every visual analytics project we take on includes at least four team members: strategist, data engineer, dashboard architect, and dashboard engineer.
Our team members are award-winners in their own right, but our deliverables reach their true potential when we combine our visual analytics powers!

Meet the Playfair Data Team


Out-of-this-world talent.
Down-to-earth attitude.
While our expertise involves complex topics (i.e. median absolute deviation, anyone?), we are approachable and seek genuine connections.
What this means to our clients is that we can empathize with stakeholders and translate their business problems into real solutions.