The Definitive Guide to Tableau Sets

In this post you will learn how to: (1) create static Tableau sets, (2) create dynamic sets, (3) use sets as a filter, (4) use sets as a dimension, (5) use sets within a calculated field, (6) add a set control, and (7) use dashboard set actions. Incorporating sets into your dashboard can be an easy tactic to add a unique user interaction and drive insight.
At the end of this tutorial I am also going to discuss some different use cases on when to use dashboard set actions vs set controls which were introduced in Tableau 2020.2.
Watch the related video with Playfair+
Static sets
By the end of this post, you will be able to create sets, know the differences between each tactic, and implement them into your dashboards.
NOTE: Up to Tableau Desktop version 2020.2, sets had its own area within the Data pane. In version 2020.2 sets are treated more like dimensions and are now lumped into the Dimensions area of the Data pane. If you are following along and do not see your sets lumped in with the dimensions, you likely have not updated to 2020.2. If you scroll down in the Data pane you will see an area specifically for sets.
![]()
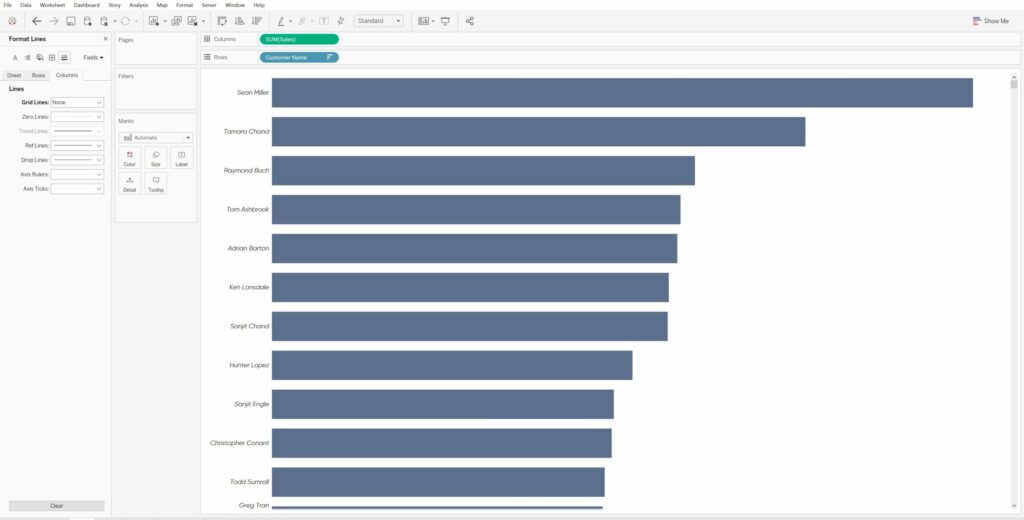
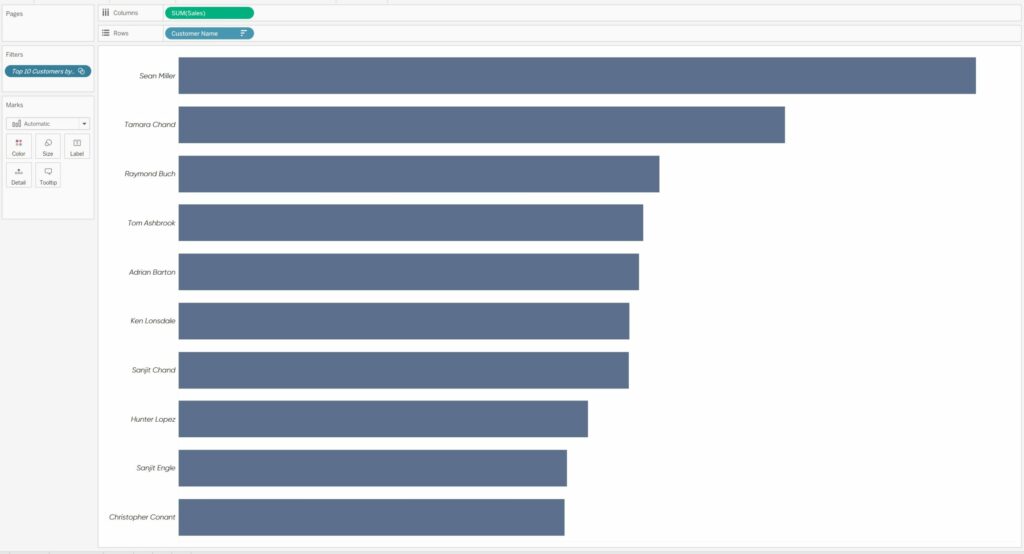
Using the Sample – Superstore dataset, I am going to create a static set of the top 10 customers by sales. To do this I am going to start a new sheet, drag Customer Name to the Rows Shelf, Sales to the Columns Shelf, and sort this view in descending order.
Next, I am going to select the first ten rows by clicking on the first-dimension member, then I’ll hold the Shift key and click on the 10th dimension member. This is going to select them both and everything in between. You could also hold Control and click specific dimension members. Either way, you should now have several dimension members highlighted. If you hover over any of them, you will see a menu of options appear.
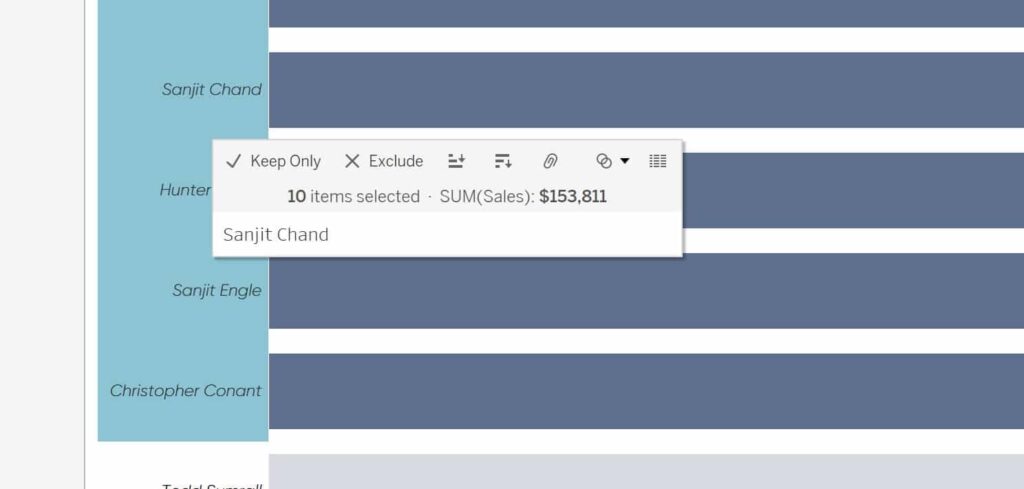
In this menu you will find options to keep only those selected, exclude them, sort ascending, sort descending, a paper clip that represents grouping, a Venn diagram icon for set options, and at the far right a spreadsheet icon that will allow you to view a summary of the data you have selected.
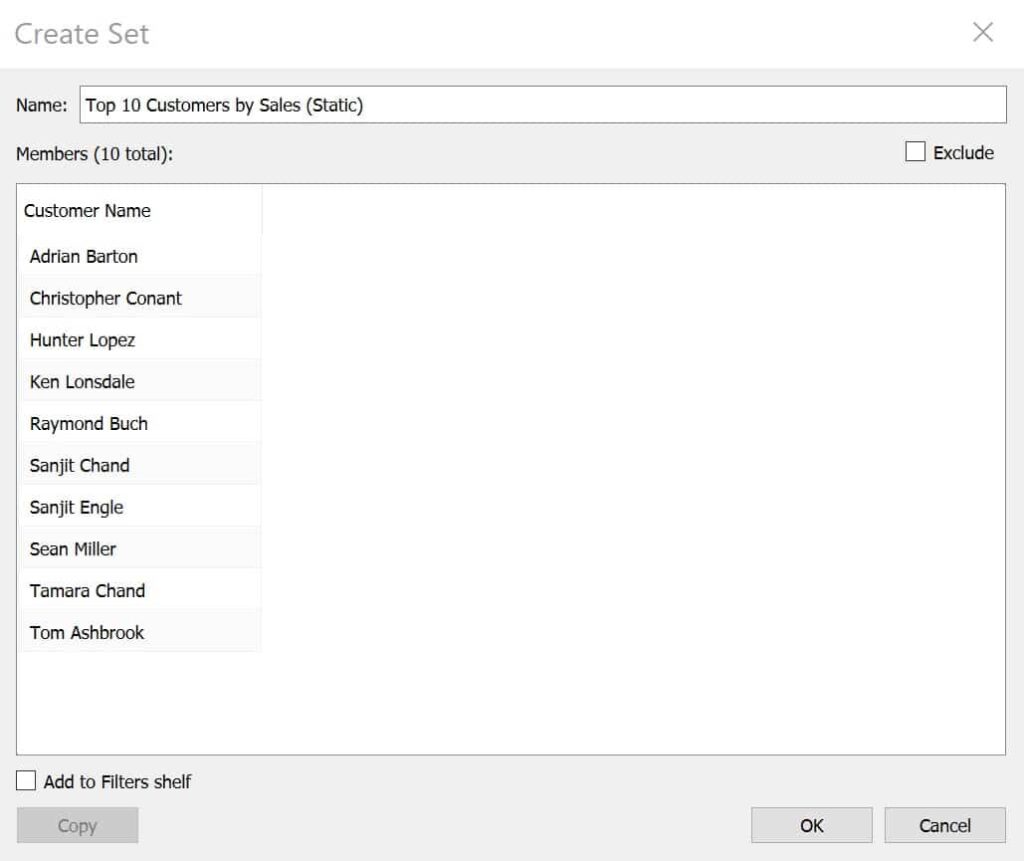
We are going to click on the Venn diagram icon for sets, and then select Create Set. You will see a new dialog box appear which shows you the dimension members in your set and will ask you to name your new set. I will name this “Top 10 Customers by Sales (Static)” and then click OK.
Continue reading with a free account, or login.
Unlock this tutorial and hundreds of other free visual analytics resources from our expert team.
Already have an account? Sign In
By continuing, you agree to our Terms of Use and Privacy Policy.
We will see the new set appear in the Dimensions area of the Data pane. As I said previously, as of Tableau Desktop version 2020.2, sets will appear in this area. Prior to 2020.2, they will show up in their own area of the Data pane labeled “Sets”.
It is important to note that static sets are just that, ‘static’. They will not change unless you edit the set and either add dimension members or remove them. This has some pros and cons; the most obvious con is that it will not update if one of these customers dropped from the top 10. It will always have these exact dimension members in the set. However; a pro is we will always know what is in this set.
A use case would be if you wanted to compare a set of specific products to the rest or a specific group of customers compared to the entire population. Creating a static set would be an easy tactic to use to complete an analysis with those requirements.
To illustrate how our new set works I am going to create a new sheet and add Sales to the Columns Shelf, Profit to the Rows Shelf, and Customer Name to the Detail Marks Card. This will create a scatter plot. Then I am going to add the Top 10 Customers by Sales (Static) set to the Color Marks Card.
3 Ways to Make Stunning Scatter Plots In Tableau
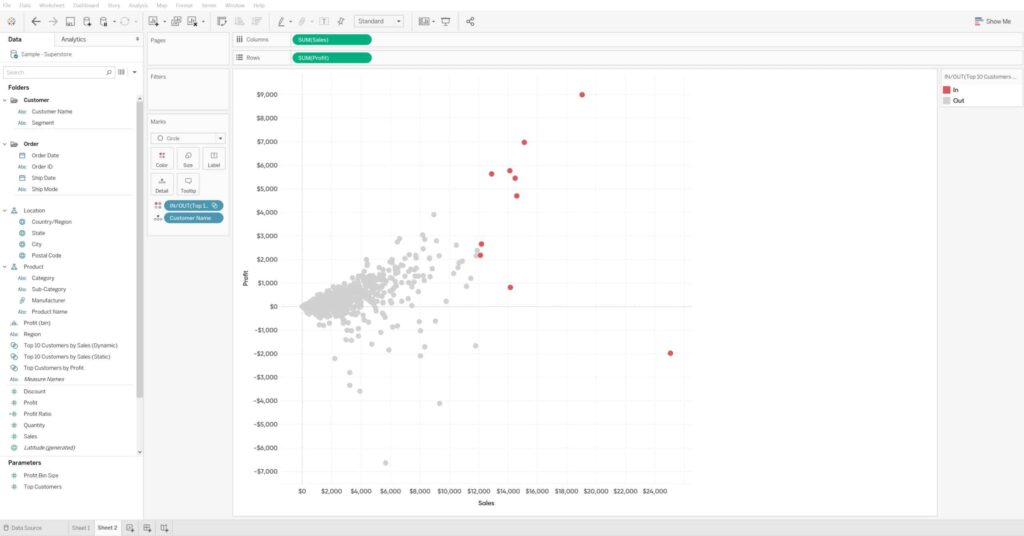
We can see that the 10 customers in the set are highlighted while customers out of the set are grey. Very quickly we can already see the power in creating sets and how it can add insight to our dashboards. We can see the outlier in the far right and immediately identify that customer for further analysis.
Dynamic sets
To create a dynamic set, I am going to right-click on the Customer Name dimension in the Data pane, go down to Create, then select Set. You will see a new dialogue box appear. At the top I will change the name of my set to “Top 10 Customers by Sales (Dynamic)”. Next, I will choose the tab labeled “Top”, then select the second radio button titled “By field:”.
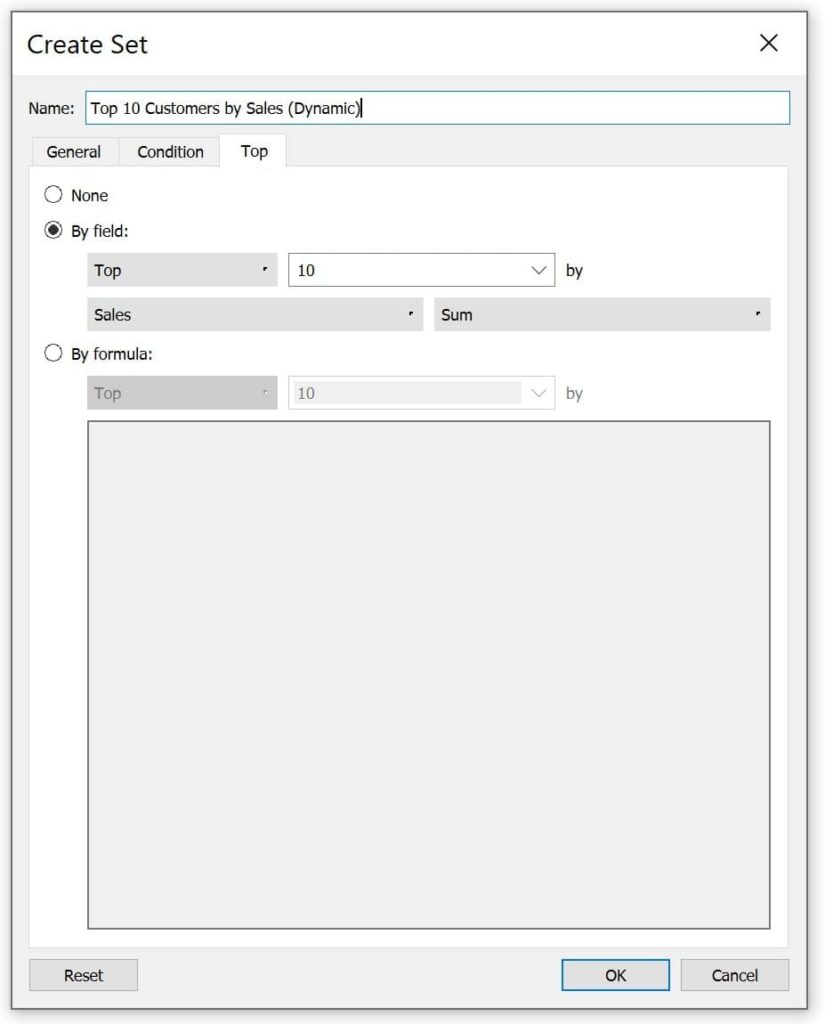
By default, Tableau already has the correct fields chosen for me in this example. However; you can change the fields as needed. For example, Top to Bottom, the 10 to another integer, Sales can be changed to a different dimension, and SUM can be changed to different aggregations. I am going to leave the fields as is and select OK.
Tableau Filters and Order of Operations
We have created our dynamic and static sets. I want to pause here to illustrate the difference between the two sets. I am going to duplicate the sheet with the scatter plot we created in the last section. In the new sheet, I am going to replace the static set on the Color Marks Card with the dynamic set. Next, I am going to add Order Date to the Filters Shelf, select a discrete Month / Year, and choose the first two months in the data which are January and February 2016.
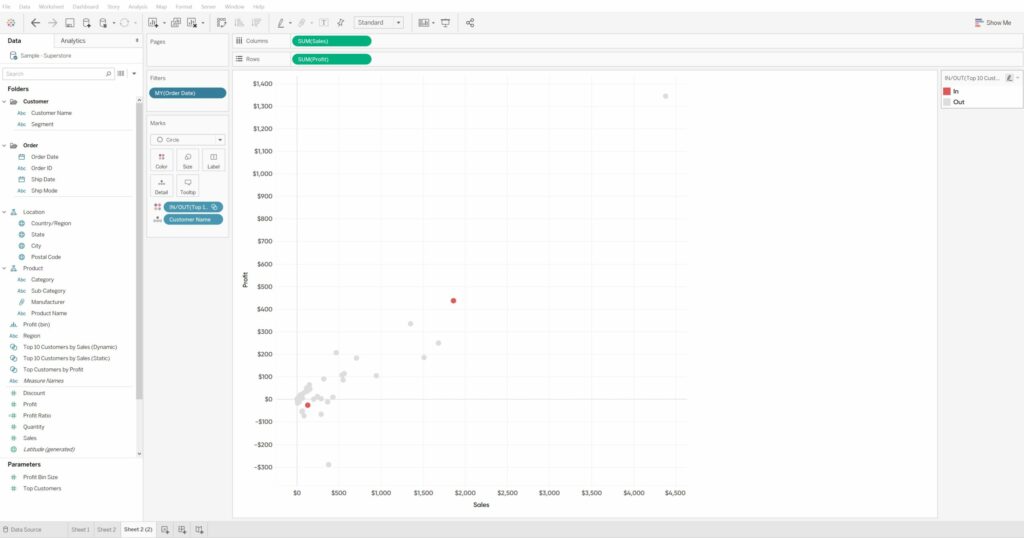
At this point we can see that we are left with only two customers in our set. I am sure you are thinking “wait isn’t this supposed to be dynamic?”. Let’s not forget about Tableau’s order of operations. Watch what happens when I change this dimension filter to a context filter by right-clicking Order Date in the Filters Shelf and selecting Add to Context.
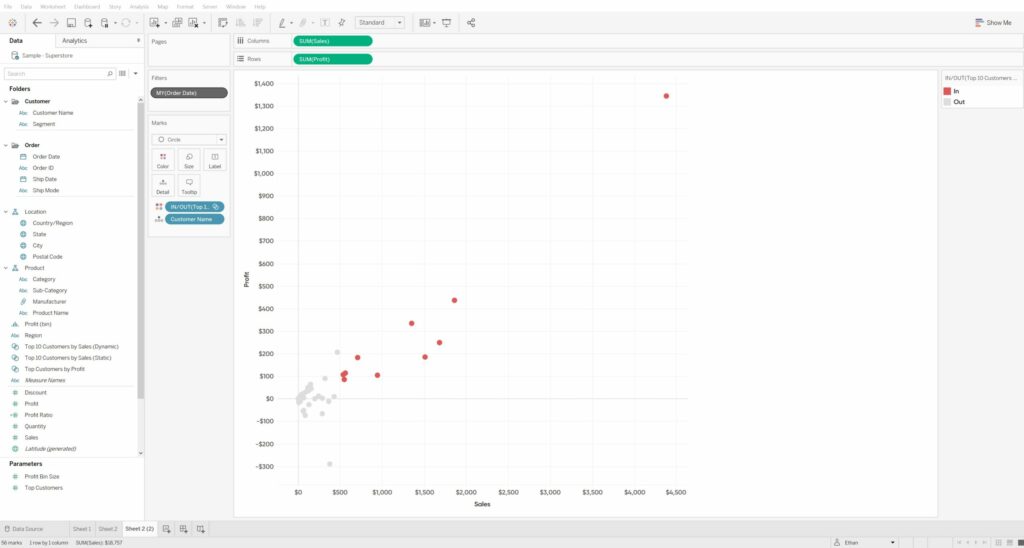
Now I have the view filtered by context, which is above sets in the order of operations, we can see the dynamic set in action. I’ll add the same context filter to the sheet with the static set and add them to a dashboard side by side for comparison.
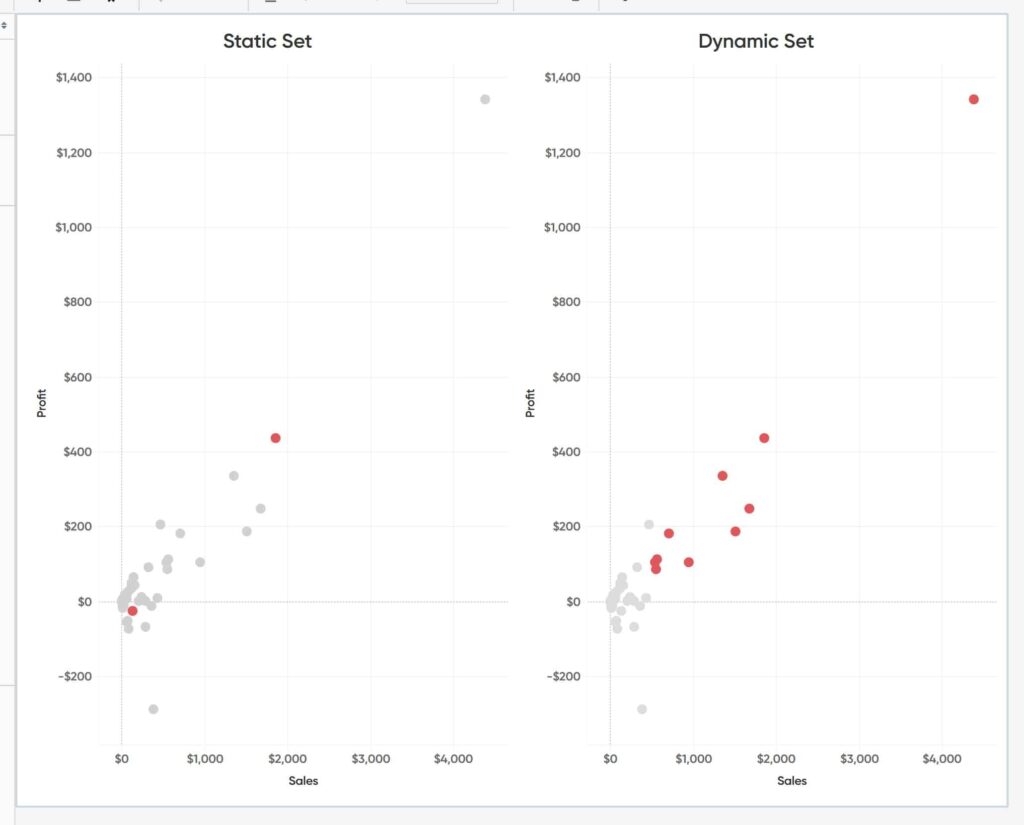
As you can see, the static set did not update. This is because it is still looking at the same dimension members that we set before.
Tableau sets as a filter
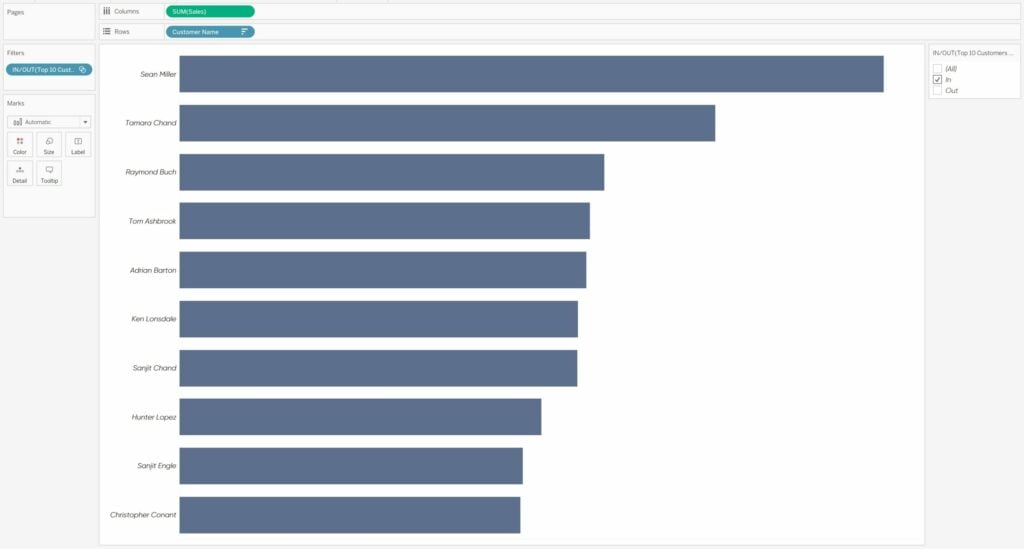
To illustrate using sets as a filter I am going to refer back to the bar graph we began with. In this sheet we have our customers sorted in descending order by Sales.
I am going to add our static set to the Filters Shelf.
By default, Tableau automatically filters to only show dimension members “In” the set. If we right-click on the static set in the Filters Shelf, we can see that the “Show Members in Set” is selected and there is another option to “Show In/Out of Set”.
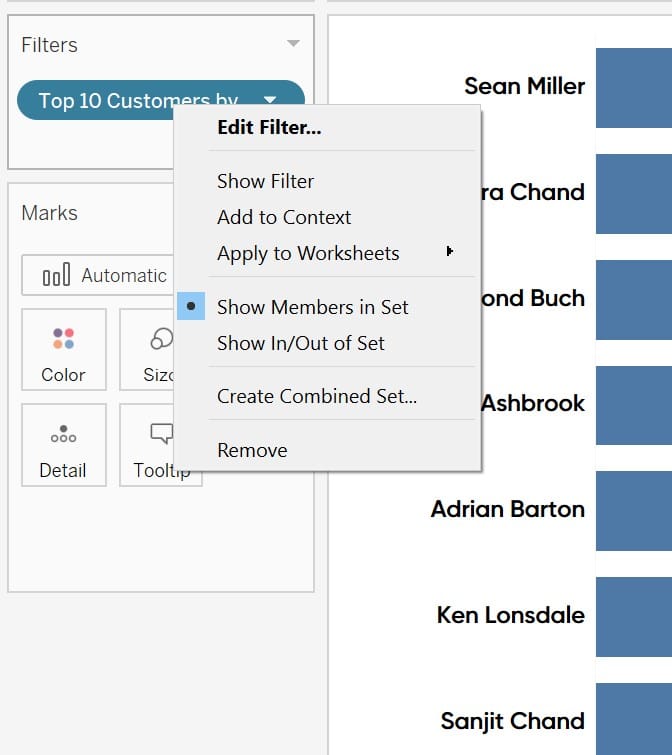
Before we explore the second option, I am going to click Show Filter.
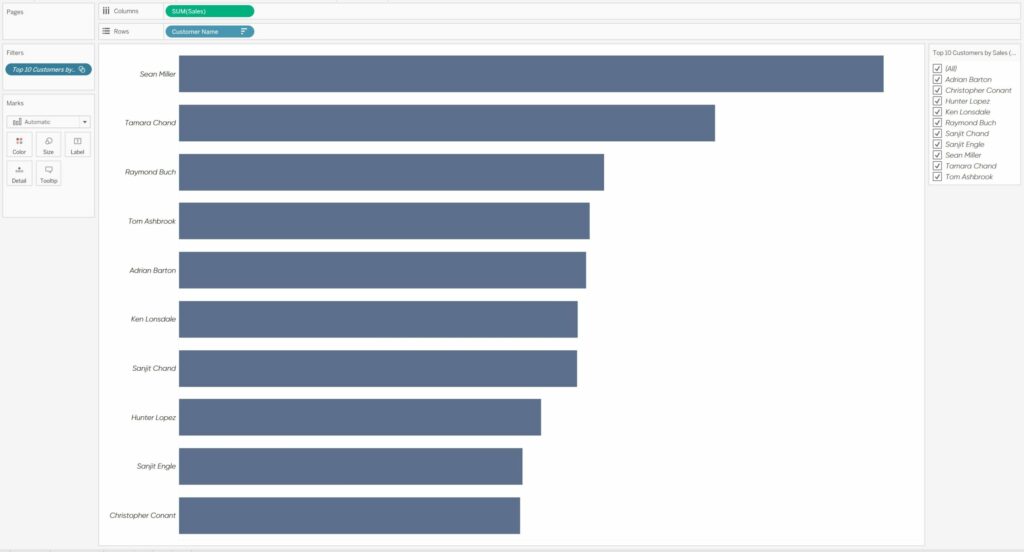
When I do, we can see all the names of the customers in our set appear to the right. Here we can use the filter to exclude or include specific dimension members that are in our set.
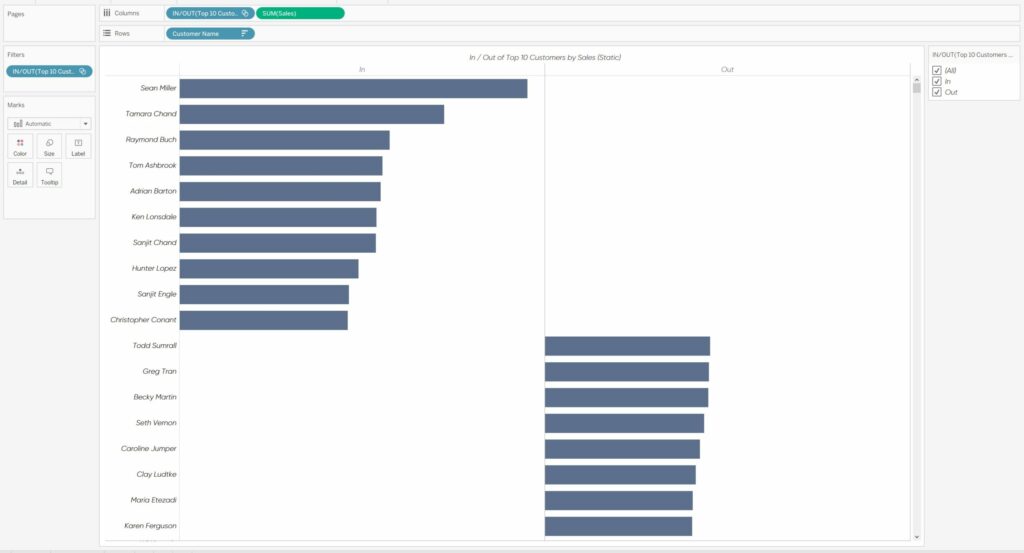
Now I am going to right-click on the static set in the Filters Shelf again and select “Show In/Out of Set”. A dialogue box will appear with checkboxes for In and Out.
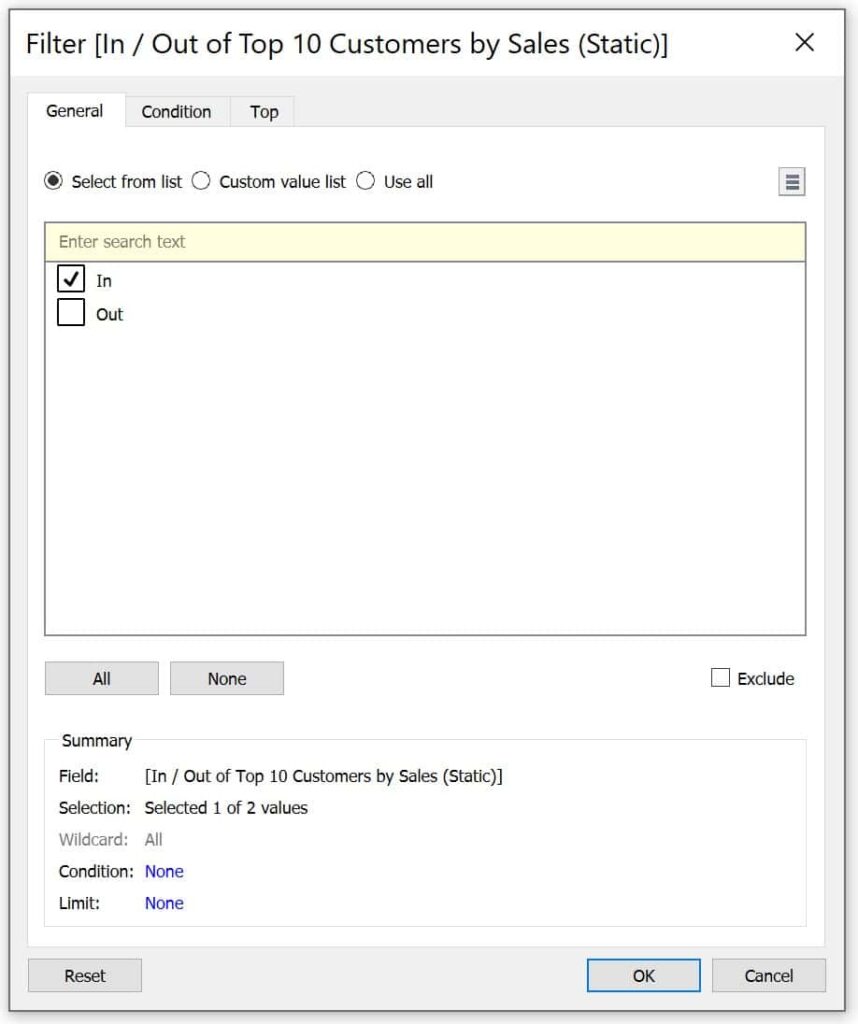
I am going to choose In, then click OK. So far nothing has changed in our sheet. I am going to right-click the static set in the Filters Shelf again, then choose Show Filter.
Now we can no longer filter out specific dimension members from the set, we can only filter on what is in the set, what is out of the set, and a selection for all. This would have the same functionality if we used the dynamic set we created.
Depending on your use case it’s important to keep either option in mind.
Tableau sets as a dimension
To build off of what we created in the last section. I am going to select (All) in the Filters Control and then drag our static set to the Rows Shelf.
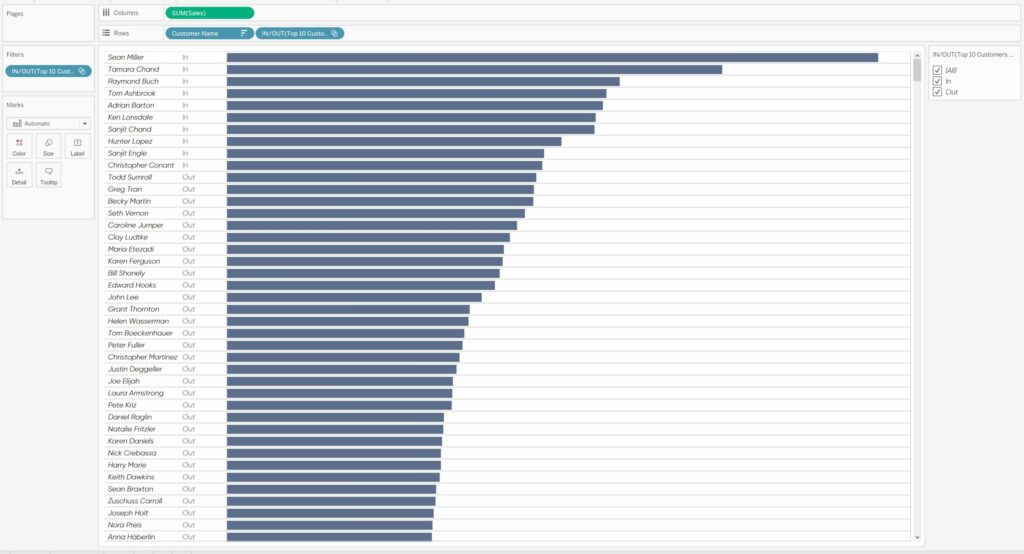
We see that this has added additional detail to our sheet which shows whether a dimension member is in or out of the set. This can be a great way to review your data and calculated fields for quality assurance when building sets.
Because we are using two discrete dimensions in the Rows Shelf, we can reorder them. I am going to drag the static set pill in front of the Customer Name dimension in the Rows Shelf.
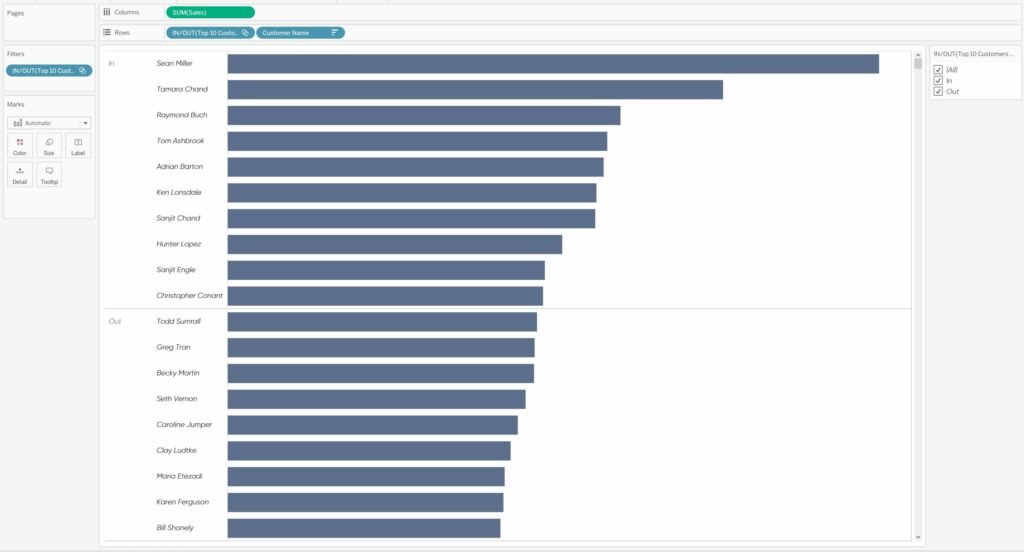
This is going to create a unique view that will create two rows to separate the dimension members to show what is in or out of the set.
Now, I will drag the static set pill from the Rows Shelf and into the Columns Shelf.
This will add one column for dimension members in the set and a separate column for the dimension members out of the set.
Tableau sets within a calculated field
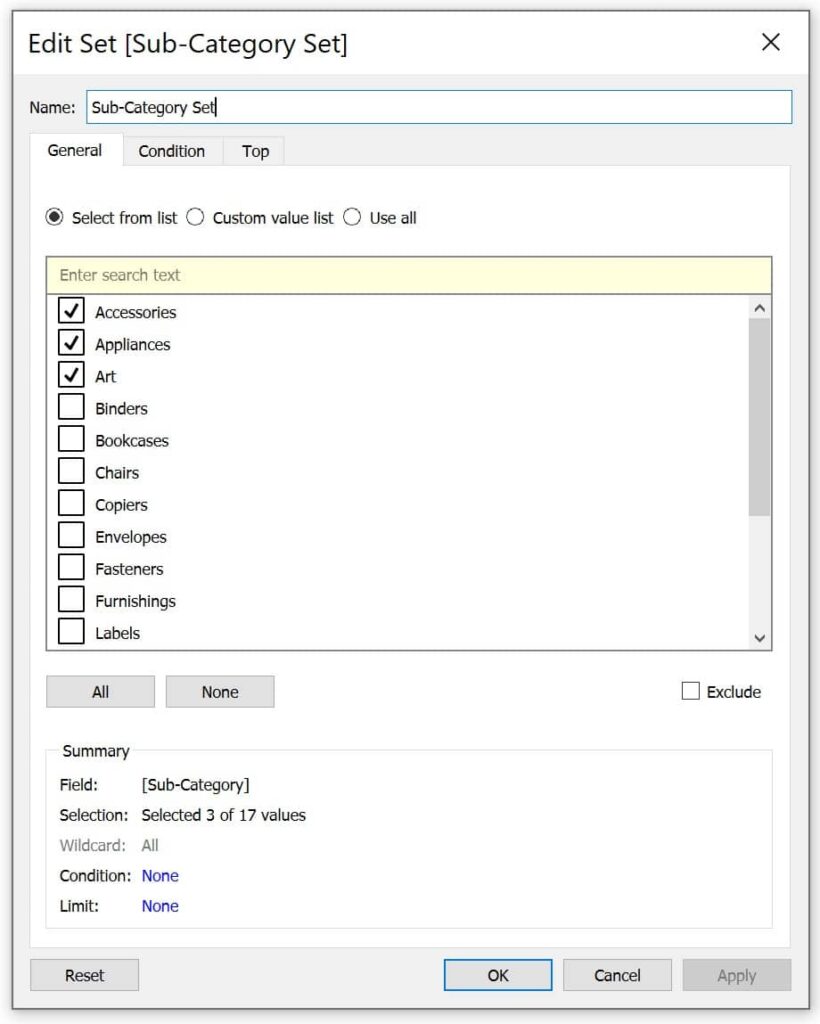
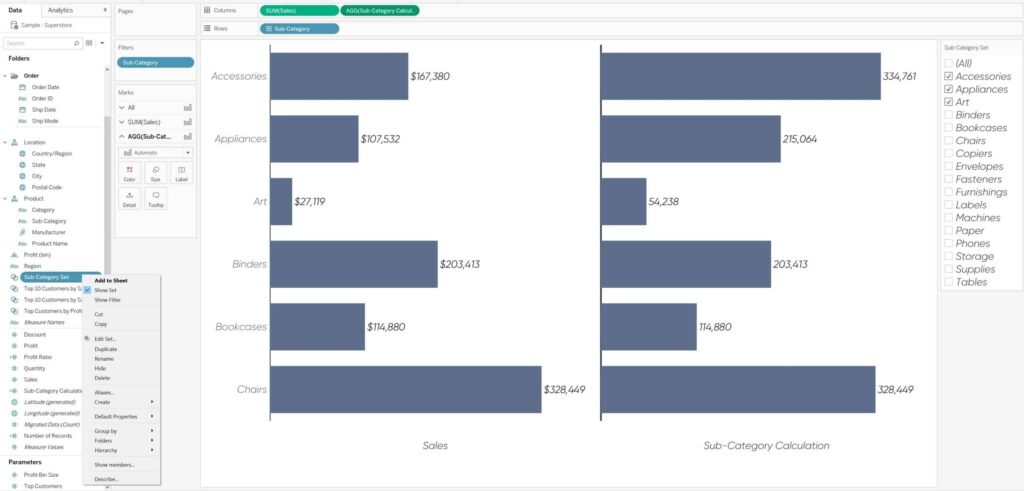
To illustrate this tactic, I am going to create a new set by right-clicking on Sub-Category, navigating to Create, and selecting Set.
When the create set menu appears, I am going to name this set “Sub-Category Set” and I am going to select the first three sub-categories: Accessories, Appliances, and Art. Then click OK.
To create a calculated field using this new set, I am then going to right-click on the new Sub-Category Set, navigate to Create, and select Calculated Field.
An Introduction to Tableau Calculated Fields
For this tutorial, I am going create a simple demonstration. However; when using sets in a calculated field the possibilities are almost endless.
I will title my calculated field “Sub-Category Calculation” and the calculation is going to be:
SUM(IF [Sub-Category Set] THEN [Sales]*2 ELSE [Sales] END)
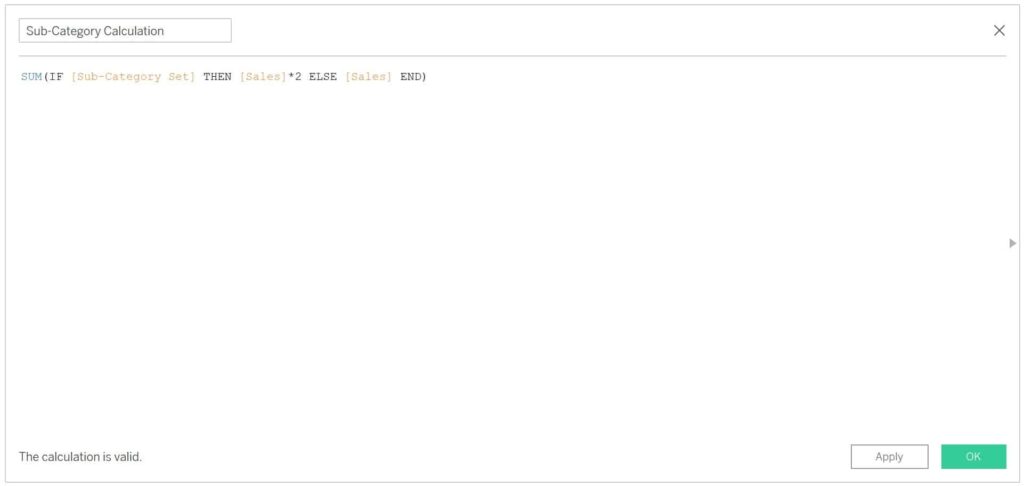
This logic is saying if something is in the set, then multiply the SUM of Sales by two; if it’s not in the set, just give me the SUM of Sales.
One thing to note, this is a much more elegant way of writing this logic than the alternative. Without the set we would have to write multiple ELSEIF clauses within the calculation; something like: IF the Sub-Category equals Accessories THEN do this, ELSEIF the Sub-Category equals Art then do this, and so on. With the set we can quickly make the decision up front on what needs to be included in the calculation. This saves us time, makes the calculation less error prone, and allows us to add or remove dimension members to the set without having to recode the calculation.
Let’s give our new calculation some quality assurance by creating a new sheet, dragging Sub-Category to the Rows Shelf, Sales to the Columns Shelf, and Sub-Category Calculation to the Columns Shelf.
To demonstrate it’s working, I will also click on the Text Marks Card and select Show Mark Labels.
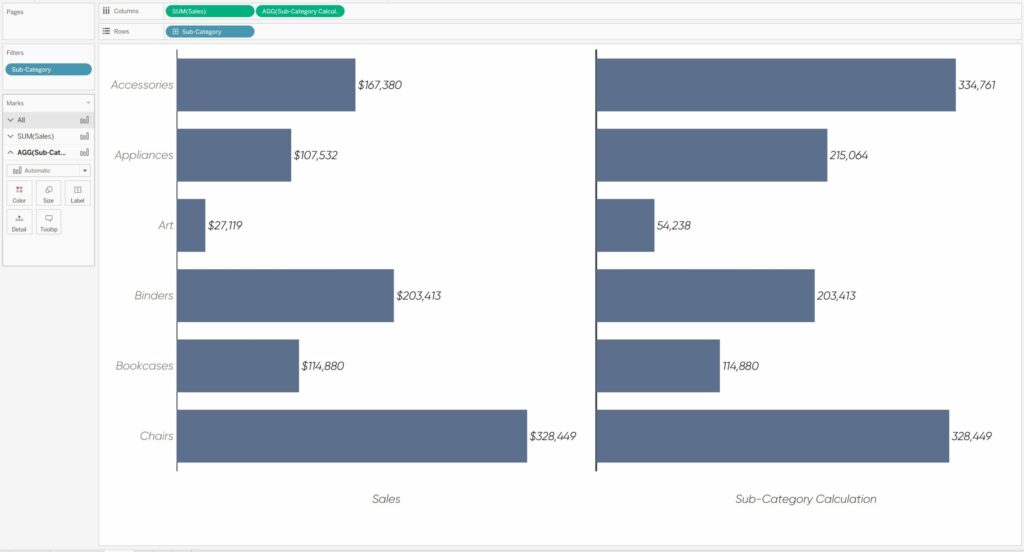
Looking at these bar charts, we can see the regular SUM of Sales on the left and our new set calculation on the right. Recall that we only included Accessories, Appliances, and Art into our set. With that in mind, if we compare those dimension members across this table, we can see that they are indeed being multiplied by two while the dimension members out of the set remain the same.
How to add a set control
Adding a set control is new to Tableau Desktop version 2020.2. This feature allows the author to add a set control much like adding a filter control.
The biggest caveat on set controls is that the set has to be somewhere within the view to allow the feature. For our example we have the set within the calculated field we created. However; the best way to overcome this is to simply add the set to the Detail Marks Card.
To enable the control, I am going to right-click the Sub-Category Set in the Data pane and select Show Set.
This control looks very similar to a filter control. However; this control is not filtering dimension members to include or exclude them from the view. This control is going to assign dimension members in or out of the set.
To illustrate this, I am going to deselect Appliances from the set control.
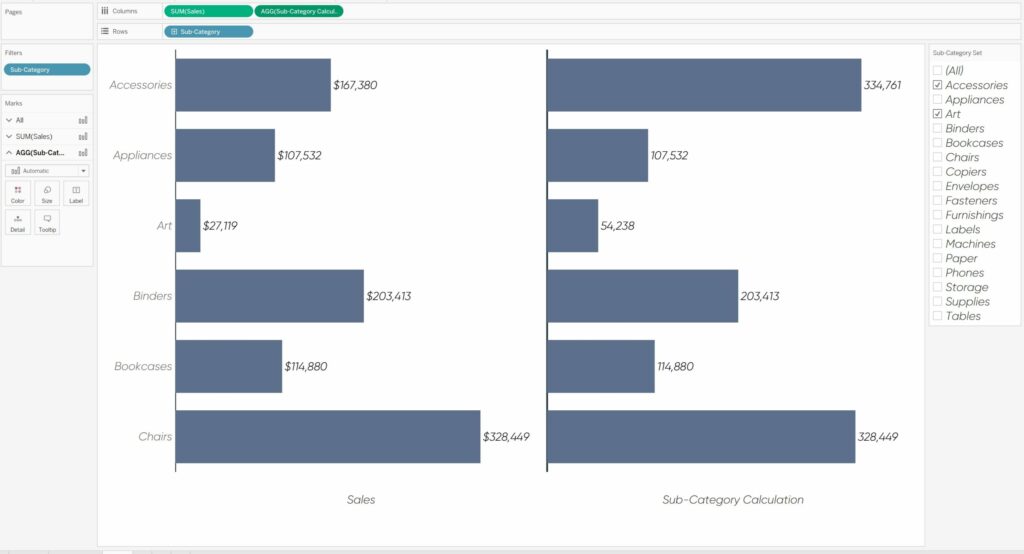
You can see by looking at the Sub-Category Calculation column on the right, the bar chart for Appliances is no longer being multiplied by two. This is because Appliances is now Out of the set.
Dashboard set actions
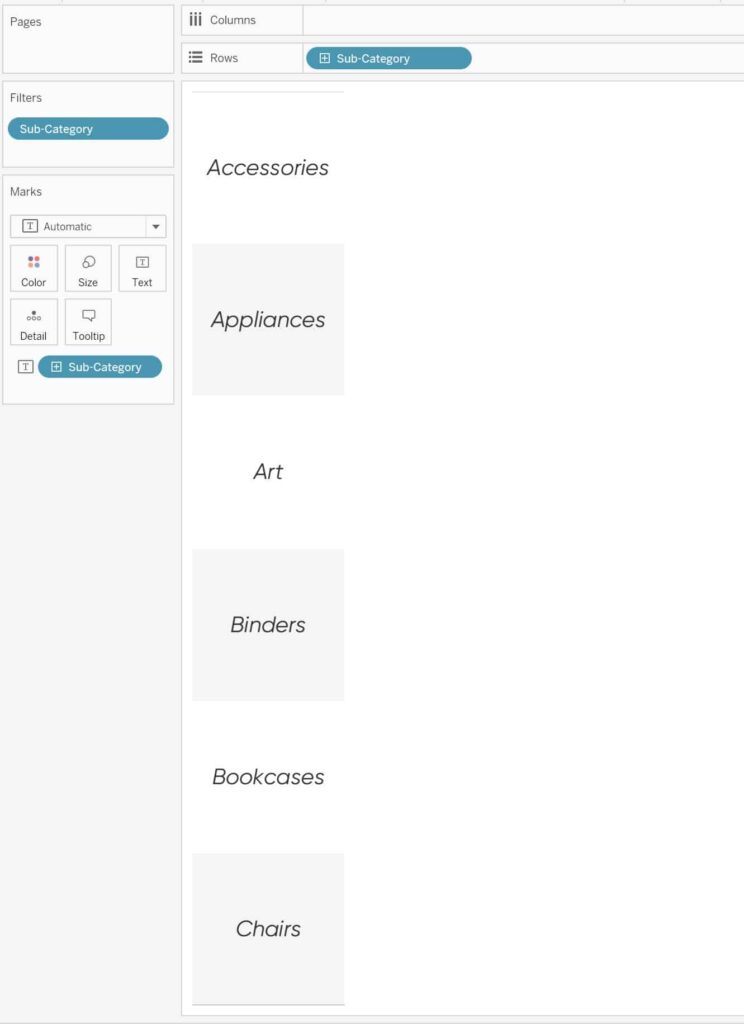
Dashboard set actions were released in Tableau Desktop version 2018.3. To use this feature, I am going to start a new sheet, label it Sub-Category Set Control Sheet, drag Sub-Category to the Rows Shelf, and then drag Sub-Category to the Text Marks Card.
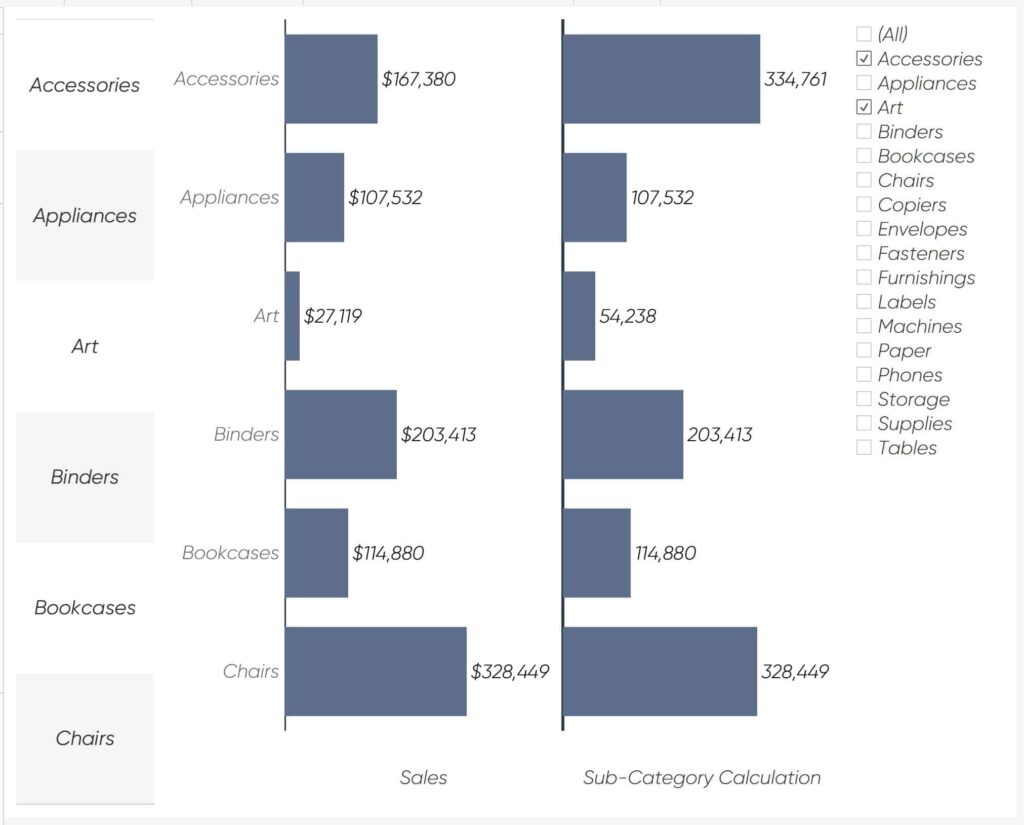
Now I will create a new dashboard and add that new sheet as well as the bar chart that had our set control on it to the dashboard. This will give us the following result:
Now that my dashboard is set up, I am going to navigate to the options at the very top of the Authoring interface and select Dashboard, then select Actions.
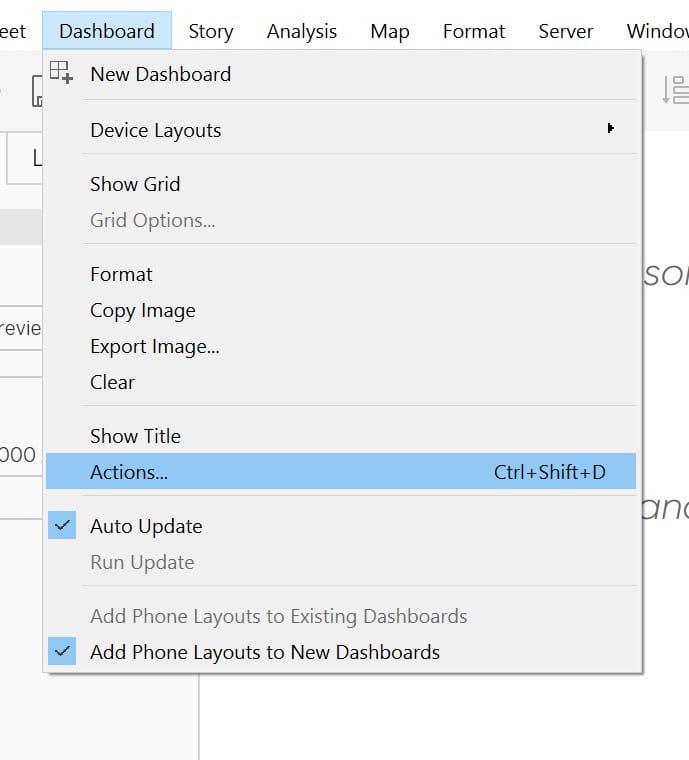
In the Actions menu, I am going to select Add Action in the lower left and then select Change Set Values.
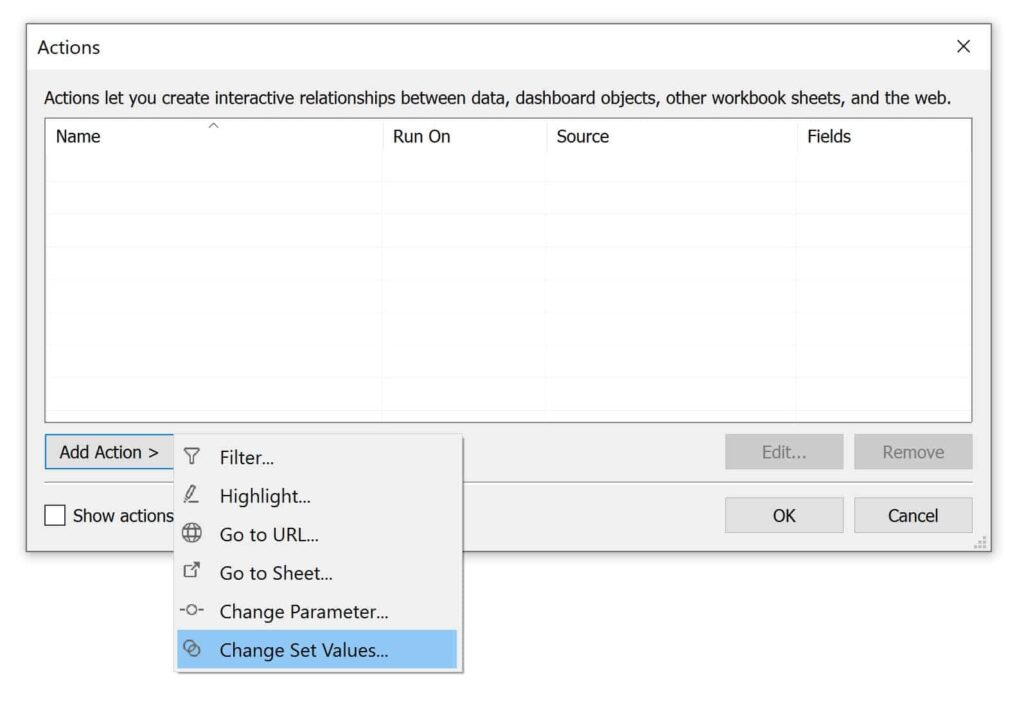
In the Add Set Action menu there are a lot of options. Let me explain what’s there, starting with the top section.
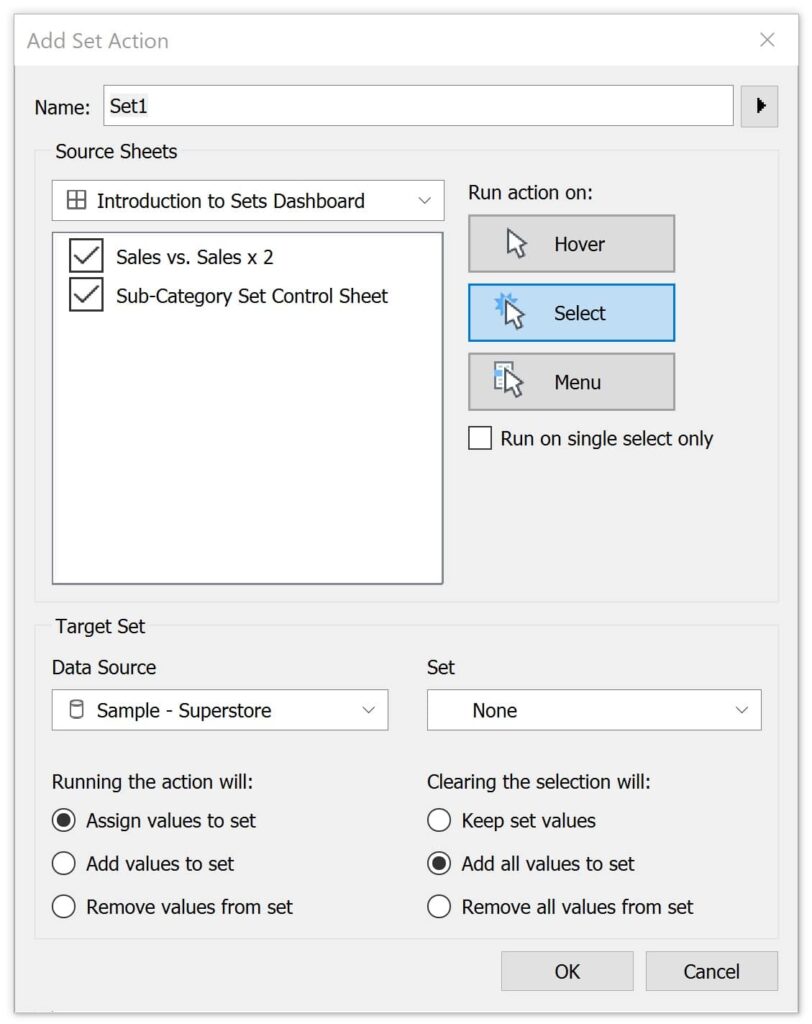
At the very top we can name this action. I always try to keep a pretty detailed naming convention for dashboard actions. Once you get comfortable and begin adding more advanced features to your dashboards these will begin to add up quickly.
The next section down is our Source Sheets. Here you are assigning what sheets will trigger the action and how you would like the user to trigger them. By default, Tableau will automatically select all the sheets on the dashboard as a source.
To the right of this section you can select how you want the action to run. Hover will execute when the user hovers over the source sheets, Select means the user will have to click the source sheet to execute the dashboard action, and Menu will add what looks like a hyperlink in the tooltip when interacting with the source sheet.
The bottom section is titled Target Set. In this section you can select which data source your set resides in and which set we will be overriding.
In the bottom left area, we have three radio buttons to choose what will happen when the action runs. By default, Tableau selects “Assign values to set”.
The last section to the bottom right is where you can choose what will happen when you clear the set; which you can do by clicking the Escape key. By default, Tableau selects Add all values to set. There are use cases for this but I typically change this setting to Remove all values from set.
![]()
I recommend to play around with these settings to find out what interaction is going to work best for your particular use case.
I am going to name this action Sub-Category Set Action, I will deselect the Sales vs. Sales x 2 sheet from the Source Sheets, add Sub-Category Set to be the target set, and change the clearing option to “Remove all values from set”.
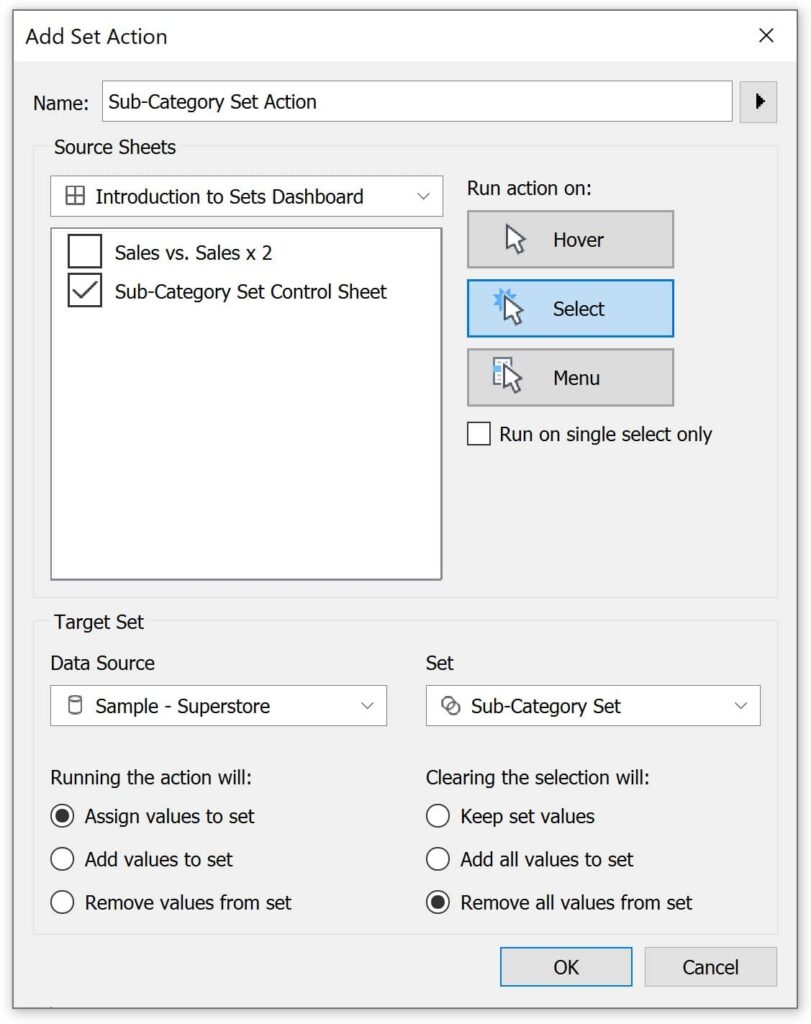
I will click OK. We can now see our Dashboard Action in the Actions interface:
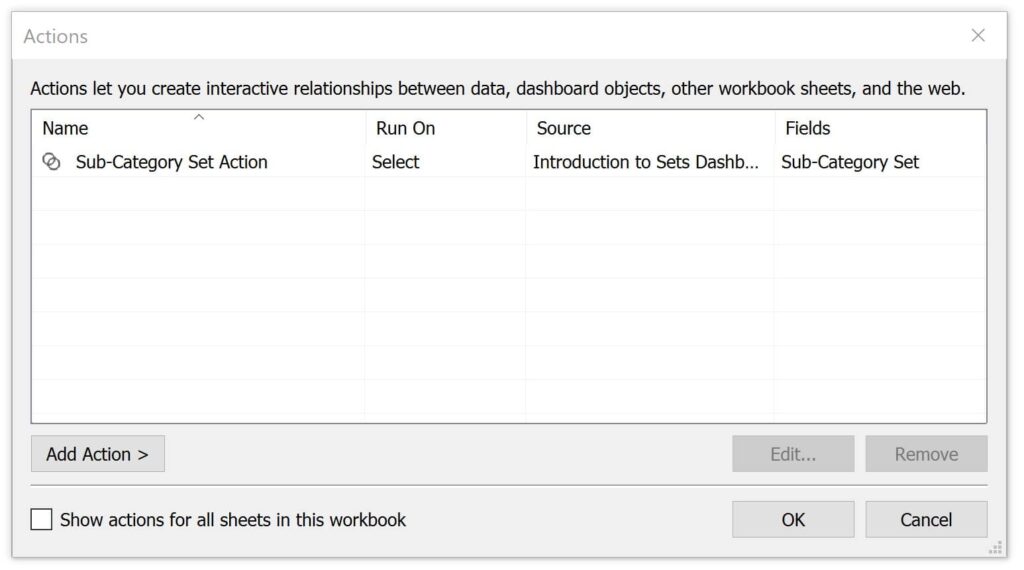
I will click OK again and test out the dashboard action for quality assurance. For extra emphasis, I also placed the Sub-Category set on the Color Marks Card.
You will see that if I click Appliances in the control sheet, it will override the set. Interestingly enough you can see this clearly in the set control to the right as well.
You may be asking yourself, ‘why do all that extra work to setup the dashboard action when you could easily add the control now?’. With the set control you can only format the size and color of the text but not much else. By setting up a control sheet and dashboard action, you have almost unlimited formatting options. For example, if we wanted to display an image of each sub-category in the control sheet, we could load those images as shapes in the “My Tableau Repository” and then edit that in the sheet accordingly.
If adding images as shapes is new to you; here is some related content on that process.
How to Add an Image to a Tooltip
Until next time,
Ethan Lang
Director, Analytics Engineering
[email protected]


Written By
Ethan Lang

Graphic Design
Jason Penrod
Director, Information Design
Related Content
How to Create Persistent Comparison Sets Across Tableau Dashboards
Comparisons help us find and communicate insights in Tableau and segmentation (a type of comparison) is one of the best…
How to Do Better What-If Scenario Planning with Tableau Set Controls
A long time ago, in a Tableau galaxy far away (aka 2014), I shared how to make a what-if analysis…

Ryan Sleeper
An easier solution for filtering to a relative date range Default date filters in Tableau have (1) limited and static…