Understanding Design Thinking for Visual Analytics

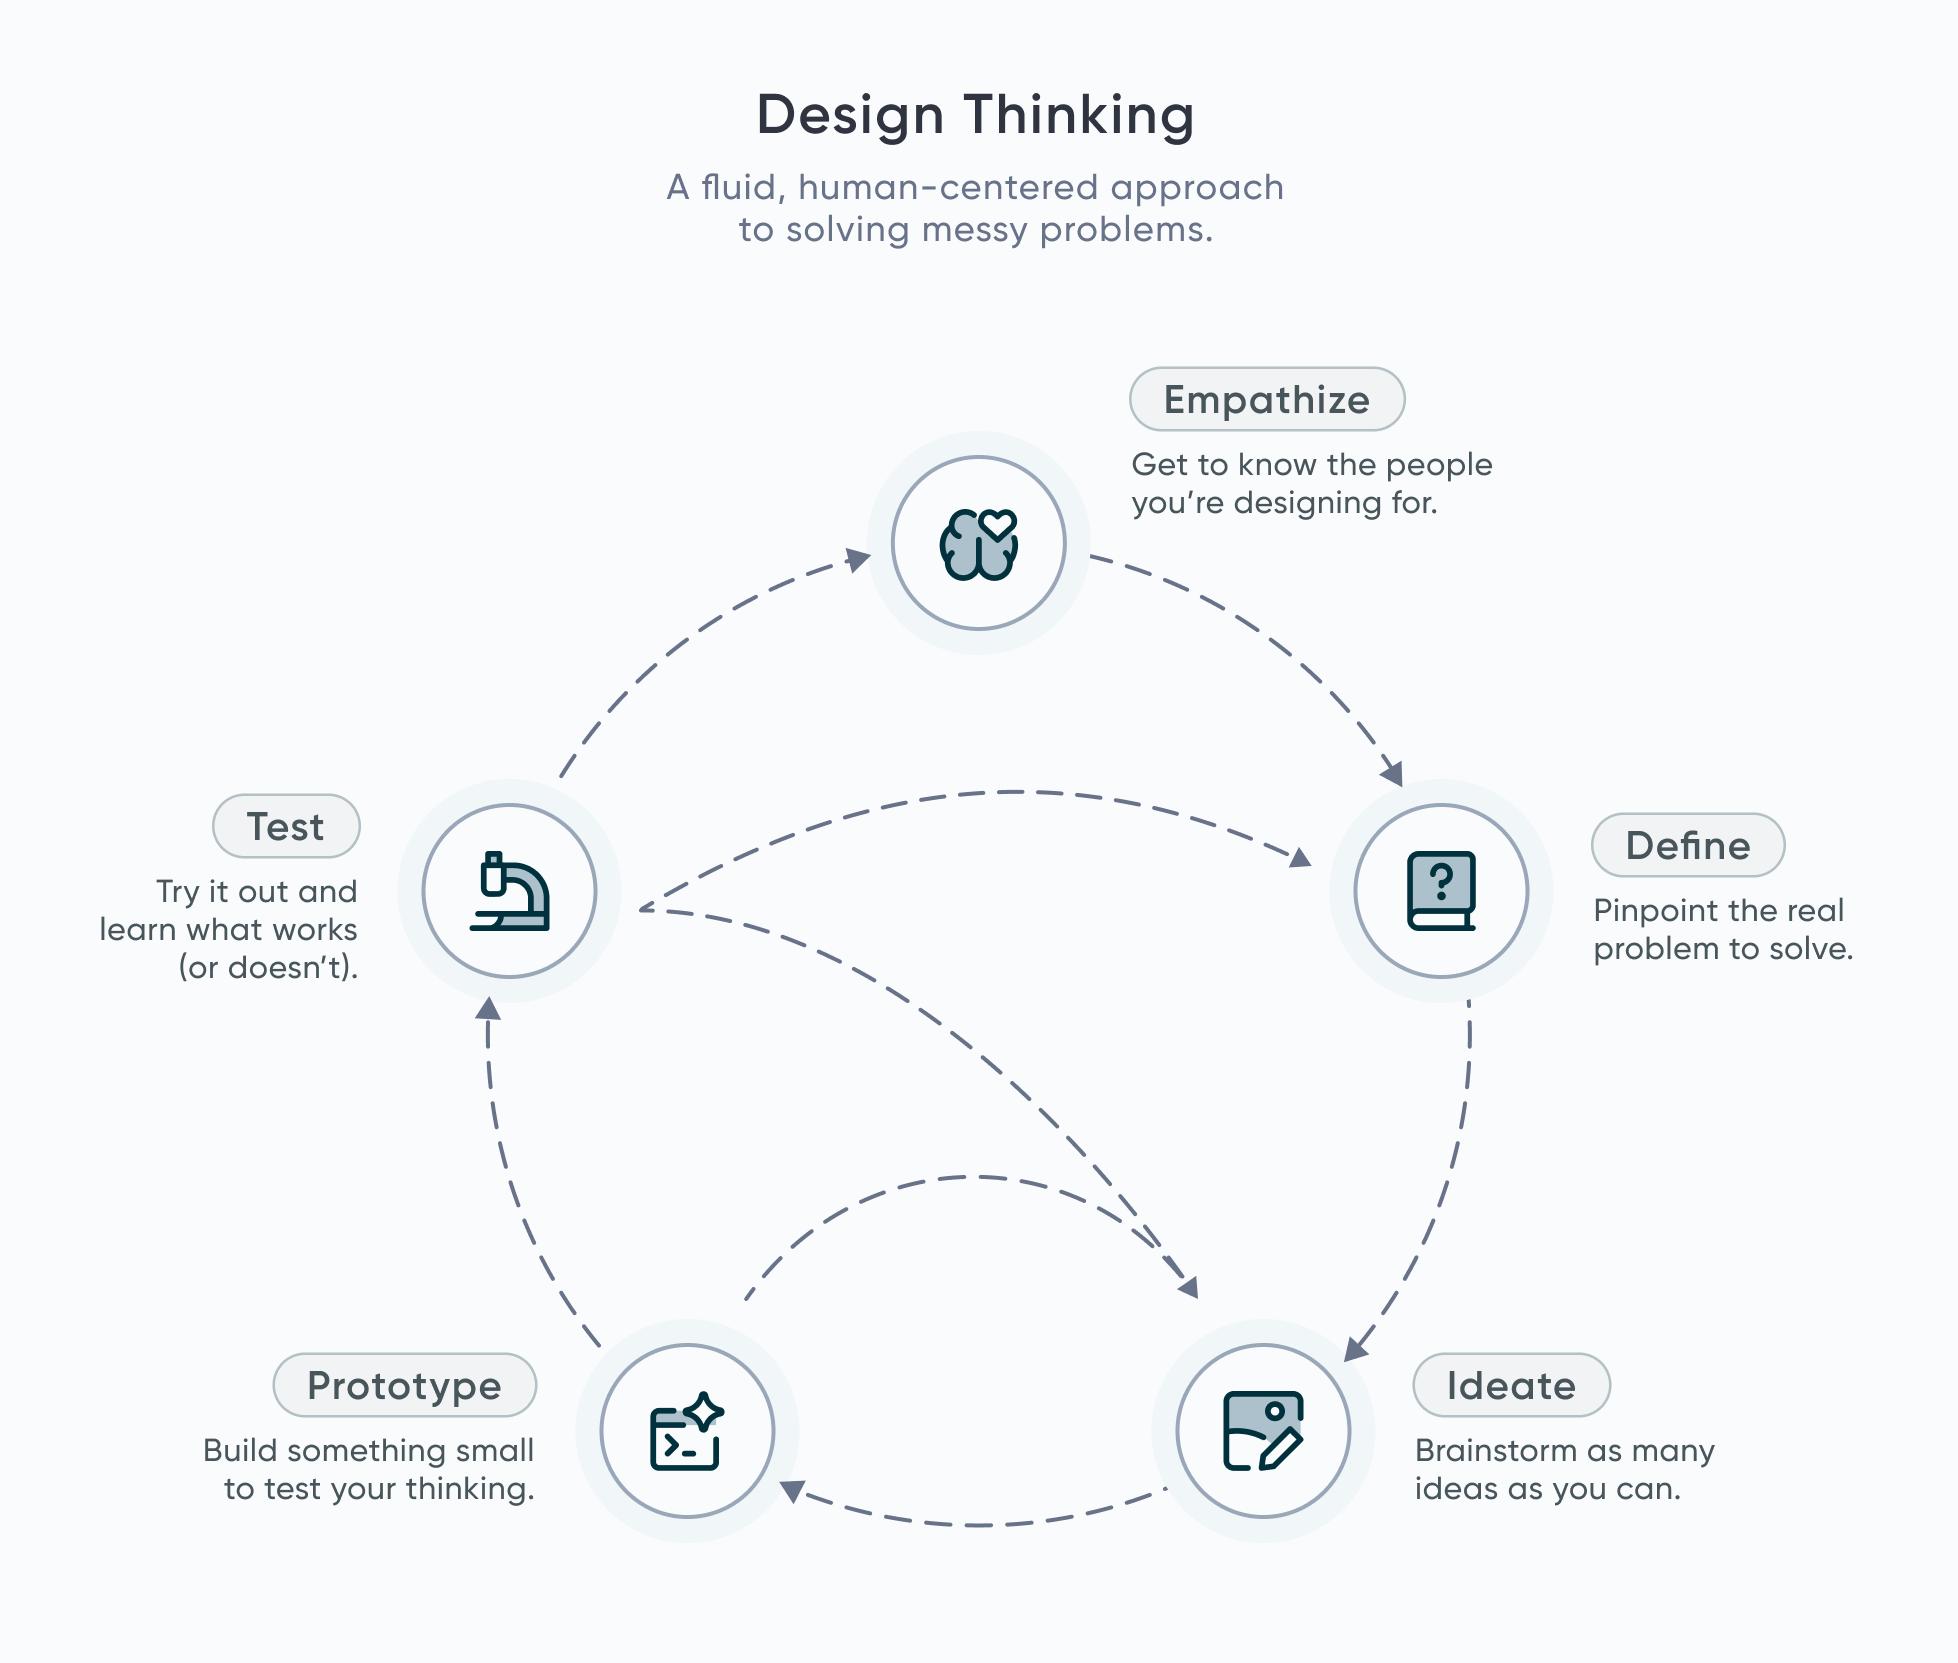
Have you ever faced a messy dashboard problem and thought, “Where do I even start?” That’s where design thinking comes in. It’s a flexible, human-centered approach that anyone can use—not just designers—to make sense of complex challenges and come up with better solutions. This framework has five stages: Empathize, Define, Ideate, Prototype, and Test. When we combine this framework with design and data visualization best practices, what results are highly creative and innovative solutions for stakeholders.
I want to reiterate that design thinking is non-linear. This means that the stages will not occur in a set order for every project. These stages can be run in parallel or even out of the order listed above. You may cycle between ideation and empathy several times before any prototyping has occurred. The results of your testing may mean you need to go through the Define stage again, but then jump back to testing. Let’s discuss each stage in depth.
Empathy
During this stage, we aim to put ourselves in the stakeholders’ shoes via user interviews and research. We search for insights about what is important to users and discover what problems need solving. The key here is to set aside any assumptions you may have about the stakeholders or the problem.
Continue reading with a free account, or login.
Unlock this tutorial and hundreds of other free visual analytics resources from our expert team.
Already have an account? Sign In
By continuing, you agree to our Terms of Use and Privacy Policy.
But what if you don’t have direct access to your end users? There are a few other ways to approach user-first design:
- Speak to an intermediary: If you can’t speak to the users directly, talk to stakeholders who have close contact with them. While not ideal, you can still learn a lot by working with an intermediary.
- Ask, “Who is the audience?”: Create user personas to narrow down who your target audience is – analysts, managers, or perhaps the general public. Think about the experience or information they might want to glean from your tool. Will they want to explore the data on their own, or will they want high-level insights?
- Test with internal teams: If you can’t test with users, run your ideas by internal team members who may have a similar understanding of the target audience. Their feedback can still be very valuable.
Aim to be as specific as possible about who your users are and what they might want from a tool, but don’t worry if you don’t get it right the first time. This process is non-linear, so you can always come back to the Empathy stage.
Define
In the Define stage of Design Thinking, we focus on defining both the user needs and the problems they face. This can include writing problem statements or creating user personas. While personas are fictional profiles used to represent users, they are based on empathy and user research. Rather than assumptions, they should be based on users’ goals, motives, and behavior. Examples of user personas for dashboards might include Jane, the small business owner, who needs to understand which products are selling best and how quickly to optimize her inventory. Or it might consist of John, an analyst at a logistics company, who likes to explore the data to find patterns and insights.
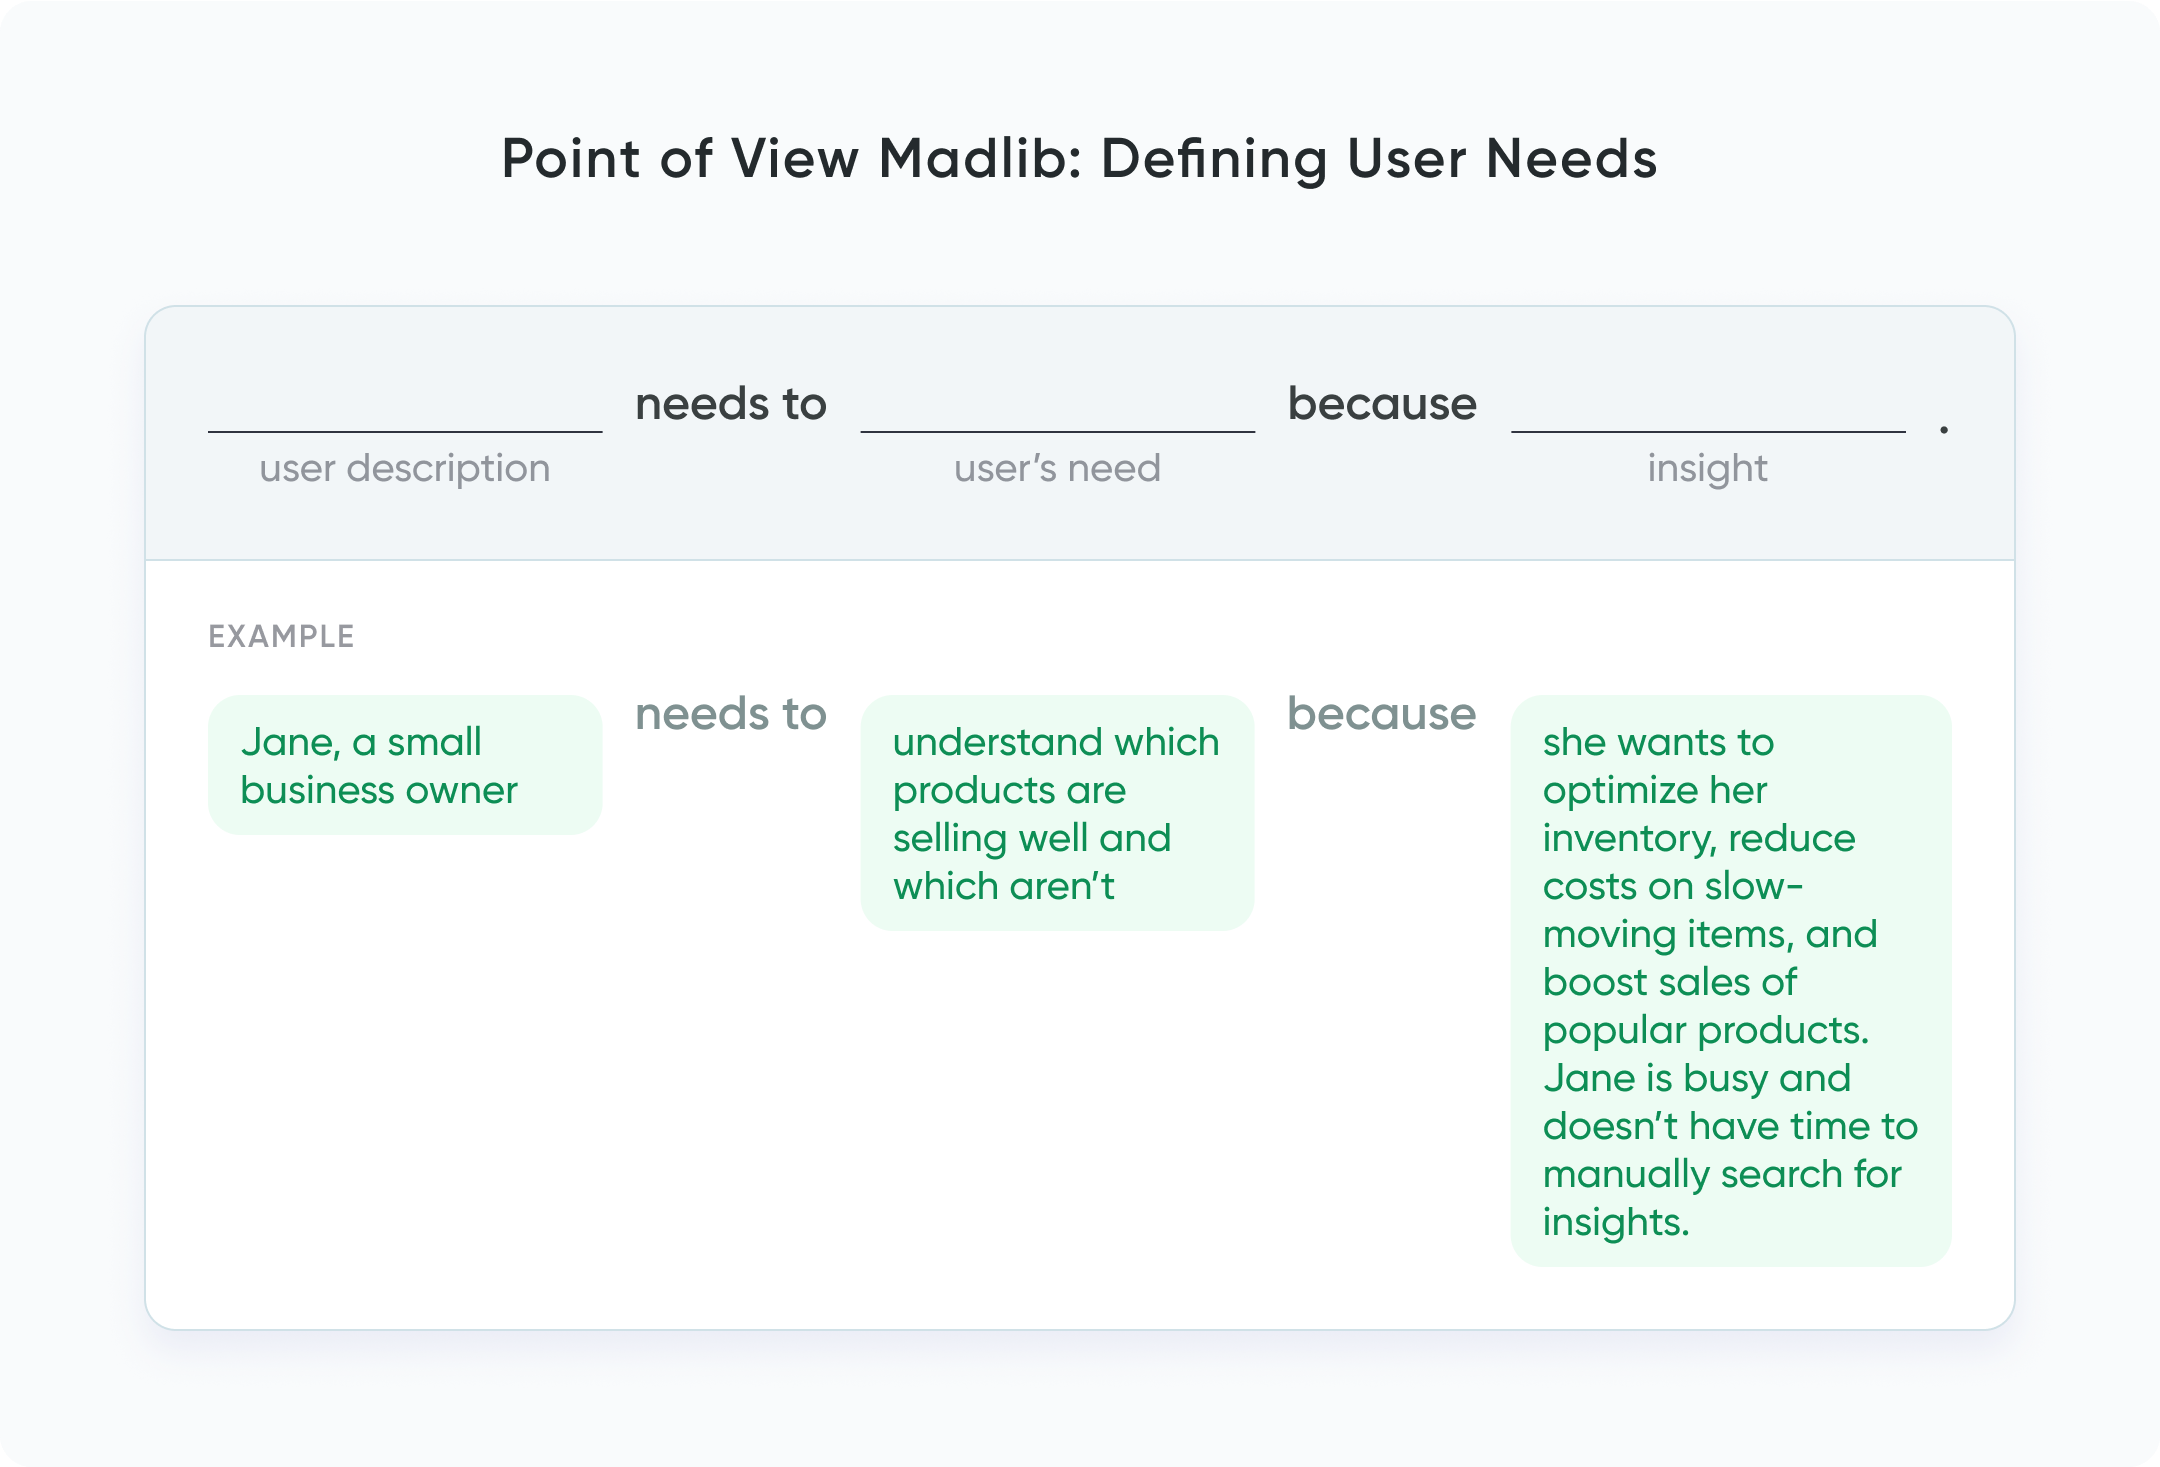
During the Define stage, it’s vital to ensure that you are framing the right problem. That is, you may think you know the solution right away, but you have not identified the correct problem to solve. If you jump straight to a solution, you might solve the wrong problem, like fixing something that doesn’t need fixing, while the real issue remains unaddressed. We can use problem statements to ensure that we are framing the problem from the users’ perspective. Problem statements also help ensure that the scope is appropriate: broad enough for creativity and innovation, but narrow enough to find specific solutions. So, how can you take your findings from user research and turn them into a problem statement? A convenient tool is the POV (point-of-view) Madlib, which breaks down the user research into the user, their need, and an insight: “[User description] needs [action/need] because [insight].”
Vital Question 2: What is the Measurement of Success?
Ideate
In the Ideate stage, the focus is brainstorming ideas to solve the problem. Here, it is key to think outside the box, set aside assumptions, and examine the problem from all angles. This is the time to go wild – no idea is too unconventional or silly. This may look like a whiteboard session with your team, sketching with pen and paper, or creating mood boards in Figma.
![]()
This type of thinking is often described as divergent thinking. Rather than seeking a single “best” solution, divergent thinking encourages generating a wide range of ideas. It helps foster creativity, adaptability, and curiosity since ideas are generated without judgment and with limited constraints.
One way to think about this process is through the Double Diamond framework. This framework breaks the design process into two main parts: the first part is all about exploring a wide variety of ideas (that’s the first “diamond”), and the second part is where we focus on the most promising ideas to move forward with (the second “diamond”).
The first “diamond” in the Double Diamond is about divergent thinking — generating as many ideas as we can without worrying about whether they’re perfect. The goal here is to be expansive, thinking beyond obvious solutions, and exploring all possibilities. Once we’ve done that, the second part of the process is more convergent — we start narrowing down our ideas to the ones that best address the problem at hand.
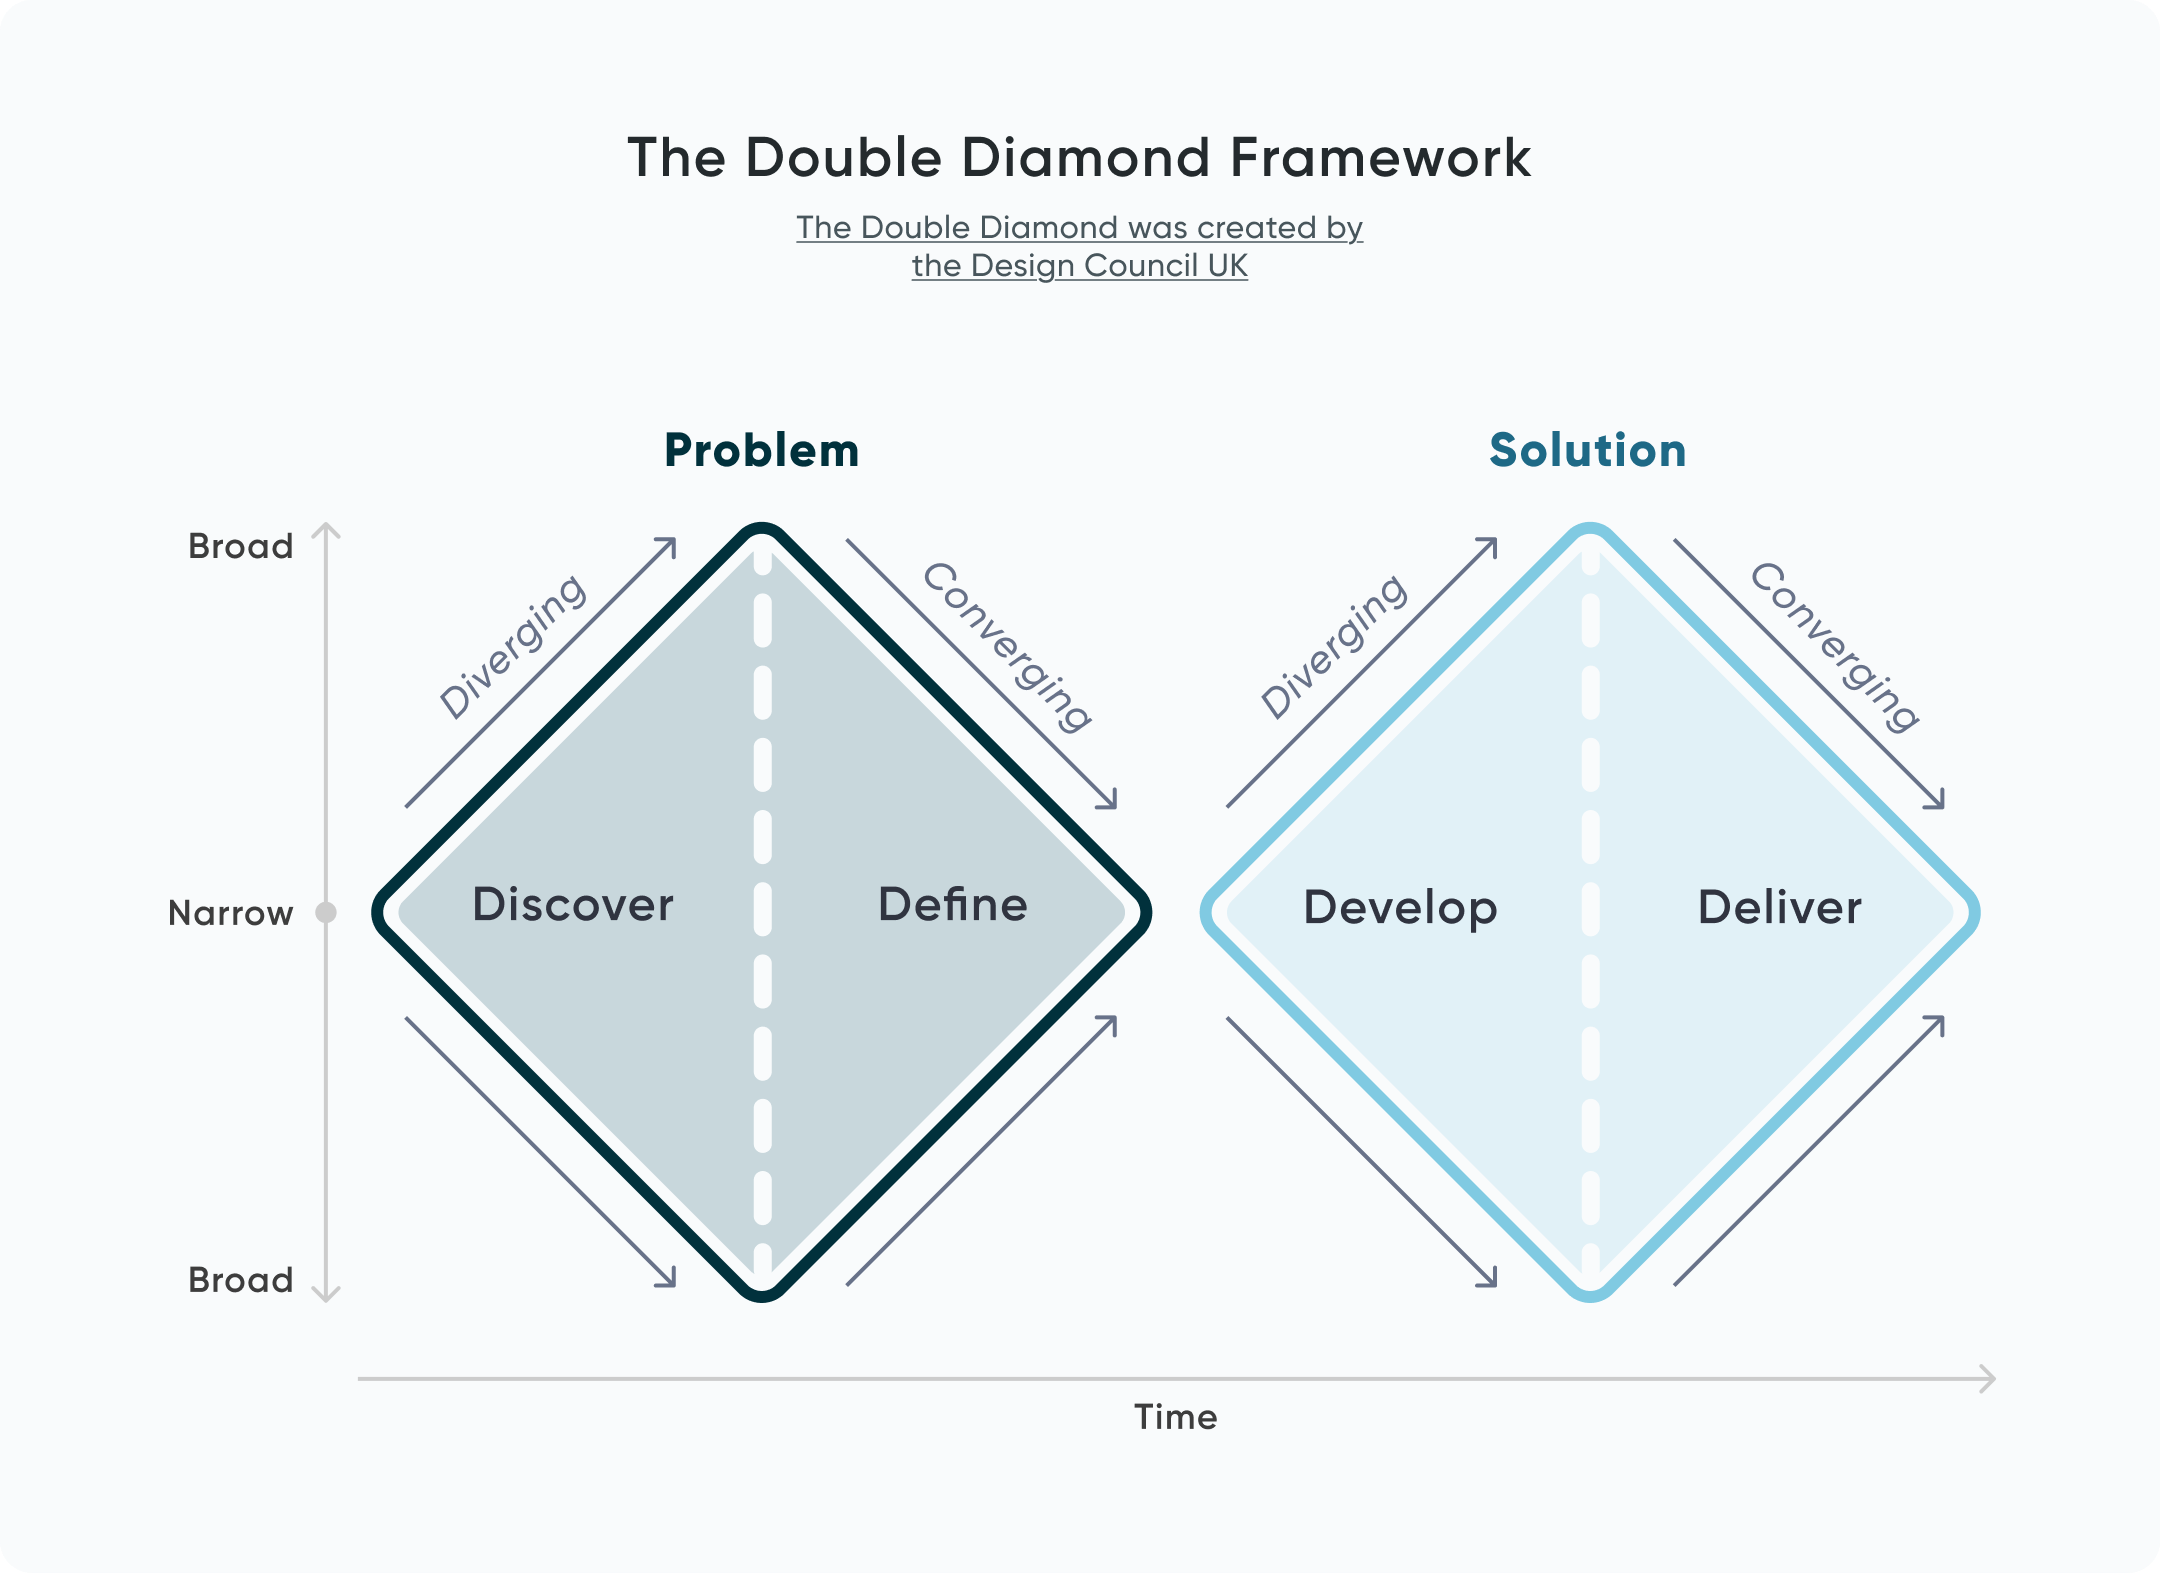
Why is this framework helpful? Because it stops us from jumping straight to solutions without fully understanding the problem. It gives us space to get creative first, and then helps us focus when it’s time to move forward.
Prototype
Convergent thinking is narrowing down the ideas generated during divergent thinking. This takes place during the Prototyping stage. From the list of ideas generated, we can narrow down to a set that we can build as experimental versions of the solutions, which are sometimes referred to as MVPs (minimum viable products). These solutions should be quick, lower-effort, and contain just enough detail to test with stakeholders. It’s not about making something polished or perfect — it’s about learning fast. This might look like building out dashboard wireframes in Figma, or building a simple version of a report in Power BI, Tableau, or Oracle Analytics.
The real value of prototyping is that it gives you something concrete to react to. It helps you learn what works, what needs tweaking, and whether you’re on the right track — all before you invest too much time or effort.
The Value in Low-Fidelity Wireframes for UX and Dashboard Designs
Test
Once a prototype has been created, it moves on to the Test stage. (Remember that design thinking is non-linear, so additional ideating or prototyping may occur concurrently with testing.) In an ideal world, prototypes would be tested on real users, and their feedback would be gathered. However, if you don’t have access to real users, the next best option would be to test your prototype on internal teams, peers, or subject-matter experts. The key is to gather honest reactions: What’s working? What’s confusing? What’s missing?
Regardless, your goal should be to gather enough information to understand what is working and what is not about your solution. You may even return to the Empathy or Define stages. The Test stage is iterative, and often doesn’t end after one round, so don’t worry if you don’t get everything right on the first try. I’ve never designed a dashboard that didn’t get any user feedback! Multiple rounds of testing and feedback are part of a healthy process rather than a result of poor planning or execution. Though we have many strengths, designers are not mind readers.
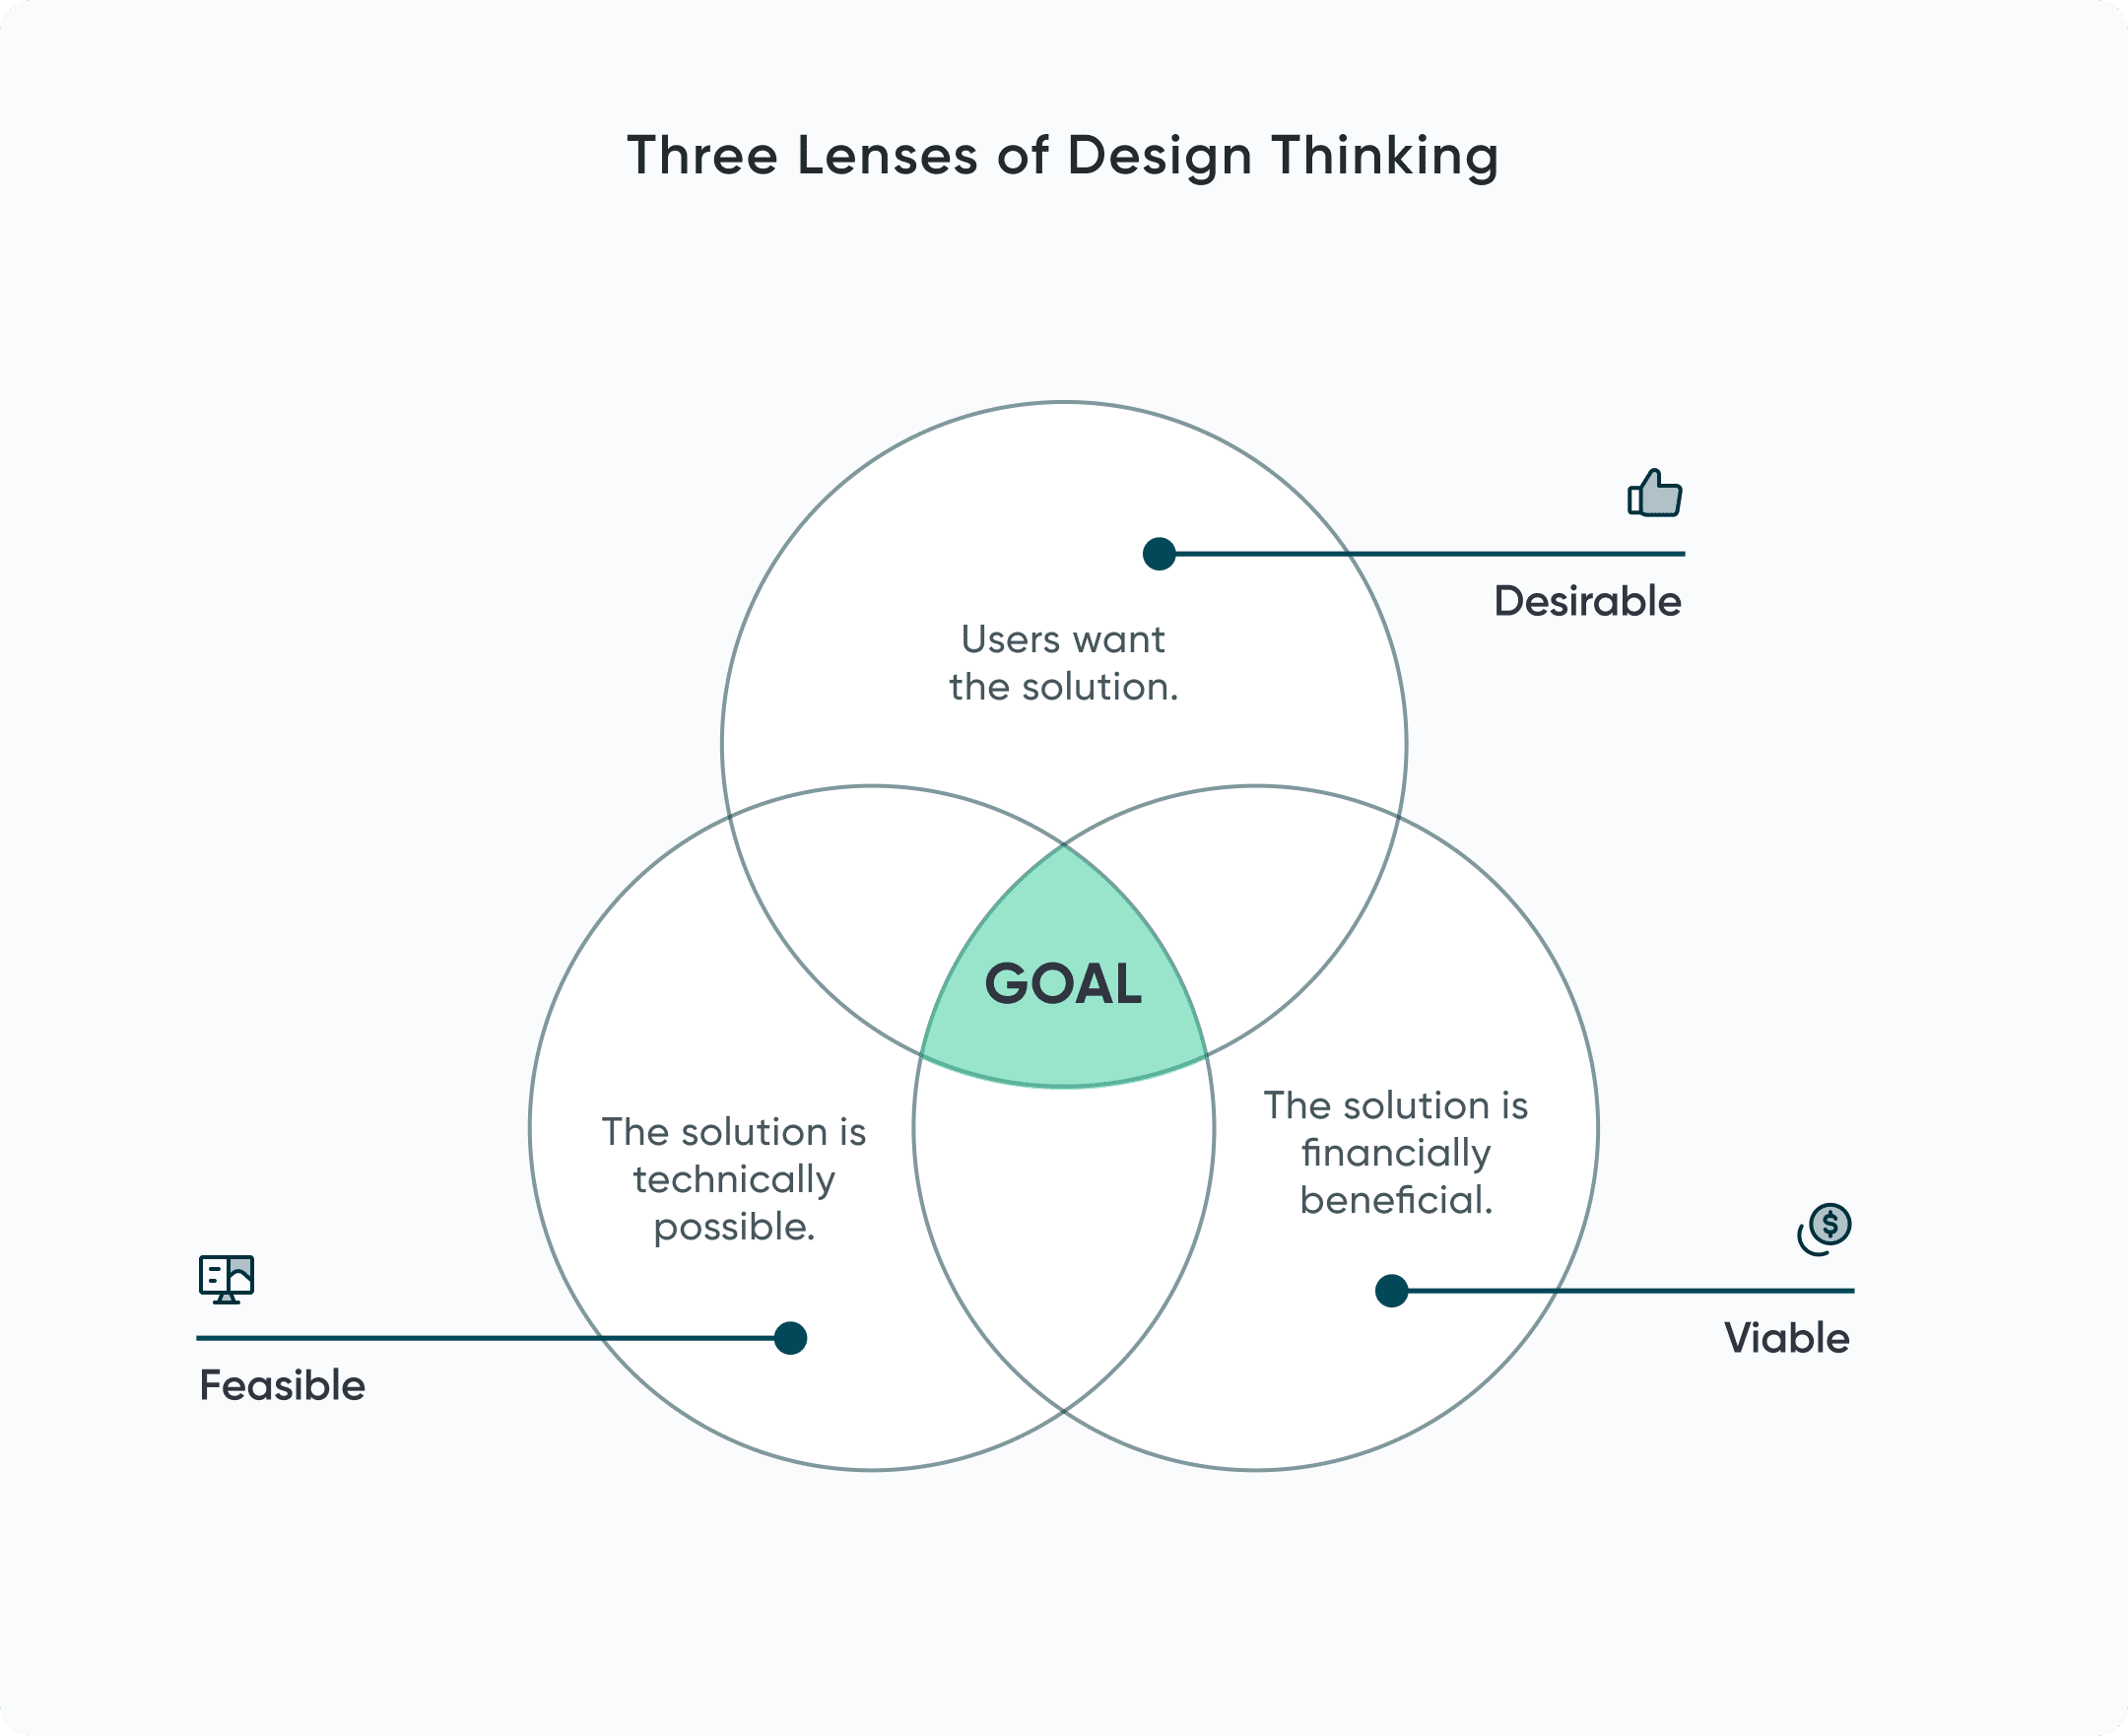
The desirable, feasible, and viable lenses
While it is important to be innovative when designing, how do you know if an idea is worth pursuing at all? Potential solutions must be viewed through the lenses of desirability, feasibility, and viability. So, now that we’ve gone into the stages of design thinking, let’s consider the following problem: I have a spider infestation in my house.
- Desirable: Do users want the solution? While hosting a bat colony in my home might technically solve the spider problem, it only works if I’m willing to do that (I’m not). There could be a myriad of reasons why a solution isn’t desirable for stakeholders, which may or may not seem valid to us as designers. Ultimately, a solution is only successful if people (your users) are actually willing to adopt it.
- Feasible: Is the solution technically possible? Can it be achieved given the time, resources, and effort required? Pursue it only if the answer to all of these questions is yes. I could invent a robot that removes spiders from my home. Do I have the knowledge, time, and resources to achieve this? No. Can I buy an arachnid-eliminating robot? Also no.
- Viable: Is the solution sustainable long-term? Does it make sense financially? Does it align with the company’s and/or stakeholders’ goals? I could solve my spider problem by burning my house down. But this neither makes sense financially nor aligns with my long-term goals. I’d rather have a house with spiders than no house and no spiders.
Design thinking is a valuable way to go about thinking about and solving problems. It results in more creative, effective, and adaptable teams, which in turn helps create user-centered dashboards and visual analytics tools. The result is the best possible solution for stakeholders and businesses.
Happy designing,
Alyssa

Written By
Alyssa Huff

Peer Review
Rafael Simancas
Sr. Manager, Brand Strategy
Related Content
Enhancing UX with Interactive User Guides in Tableau
An effective user guide is a powerful tool when it comes to helping any user get the most out of…
Building Blocks of Dashboards: A Beginner’s Guide to Visual Elements
Lines, shapes, colors, and space are all around us, including in the tools we use every day. On their own…
3 Ways to Avoid Data Visualization Desire Paths

Desire paths are unplanned trails that form when users circumvent the carefully constructed paths before them in favor of routes…