What You Should Know
02. Course Duration
The exam itself is designed to take 60 – 90 minutes to complete, but with hundreds of analytics engineering tutorials, you’re encouraged to study the depth and breadth of topics you find relevant.
03. Target Audience
This learning path was built for anybody who wants to get started bringing insights to life by combining data with design in leading business intelligence tools including Tableau, Power BI, and Oracle Anayltics.
04. Value Proposition
The Visual Analytics Engineering Fundamentals learning path equips you with effective tactics in specific tools and transferrable skills to turn data into value regardless of technology stack.
Learn From a Proven Industry Leader
Meet Your Lead Instructor
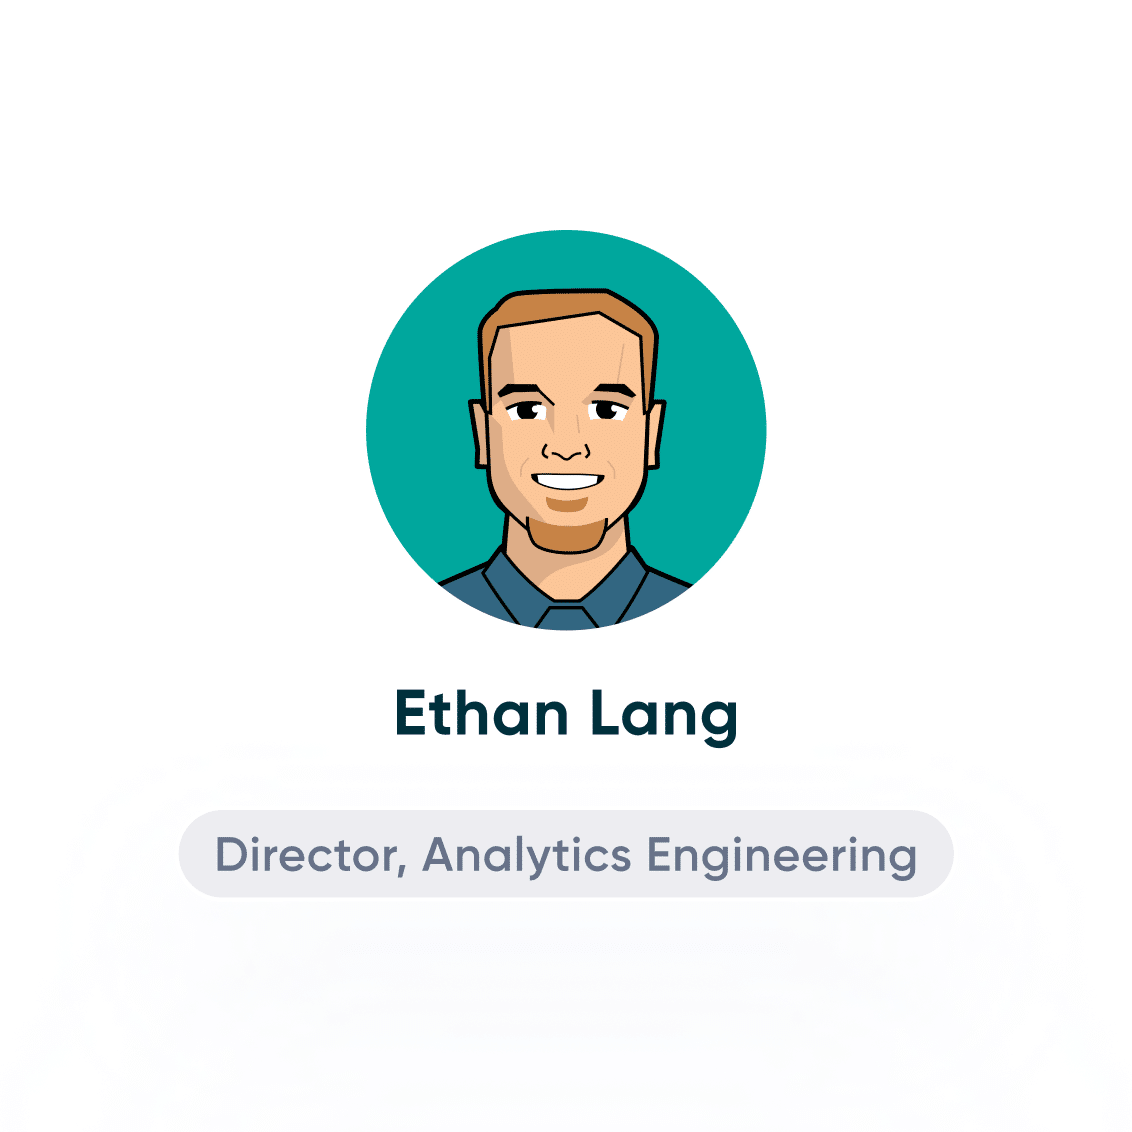
When you learn engineering at Playfair+, you are learning from global leaders in visual analytics. Ethan Lang holds a Master in Applied Statistics and Analytics and is the author of the best-selling analytics in Tableau book, Statistical Tableau (O’Reilly 2024). When not providing instructional tutorials or delivering live training, Ethan applies his role as Director of Analytics Engineering at Playfair Data to lead a team supporting multiple publicly-traded companies, Fortune 500 clients, and even a Global 10 organization.
Meet The Team
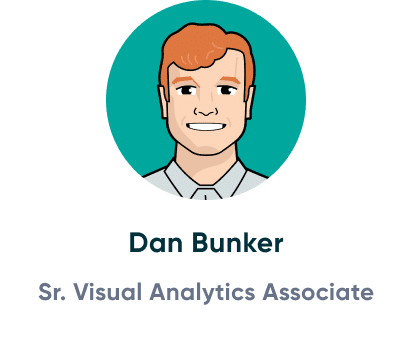
As a rising star in analytics, Dan has been recognized as a NextGen Under 30 honoree in engineering and won the Oracle Analytics Data Visualization Challenge 2025.
Playfair Data’s Associate Director of Analytics Solutions, Felicia, is an expert in both data and Tableau engineering. She is one of 46 current Tableau Visionaries in the world.
Matt is an expert in both Tableau and Power BI engineering, holds a Master in Data Science and Analytics, and has personally trained one of the premier sports teams in the US.
Frequently Asked Questions
You ask. We answer.
Ready to start learning visual analytics engineering?
