The Definitive Guide to Filters in Tableau

When designing a dashboard, we often want to give our users the ability to slice and dice the data on their own. We may just add several dimension filters to our view but is this the most optimal way? Looking at the filter order of operations, there are actually eight different types of filters in Tableau.
In this tutorial, I will walk you through each of these filter types. I will also give you some common use cases for each one and discuss how they cascade down to each other.
Tableau Filters and Order of Operations
Before we dive into each of the filters, let’s reacquaint ourselves with the order of operations in Tableau.
Order of operations overview
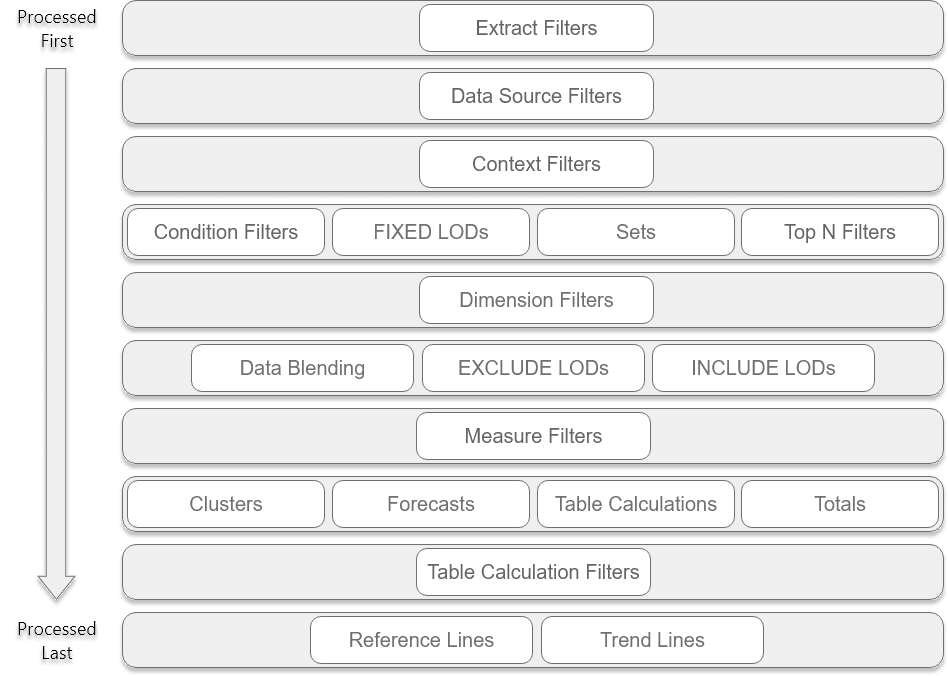
Below is the order of operations in Tableau. It runs from top to bottom, meaning everything at the top gets processed first. We can see that the first five batches of processes contain a filter and all together there are eight different filters that are processed.
Let’s jump into each of the filters in more detail.
Continue reading with a free account, or login.
Unlock this tutorial and hundreds of other free visual analytics resources from our expert team.
Already have an account? Sign In
By continuing, you agree to our Terms of Use and Privacy Policy.
Extract and data source filters
Extract filter
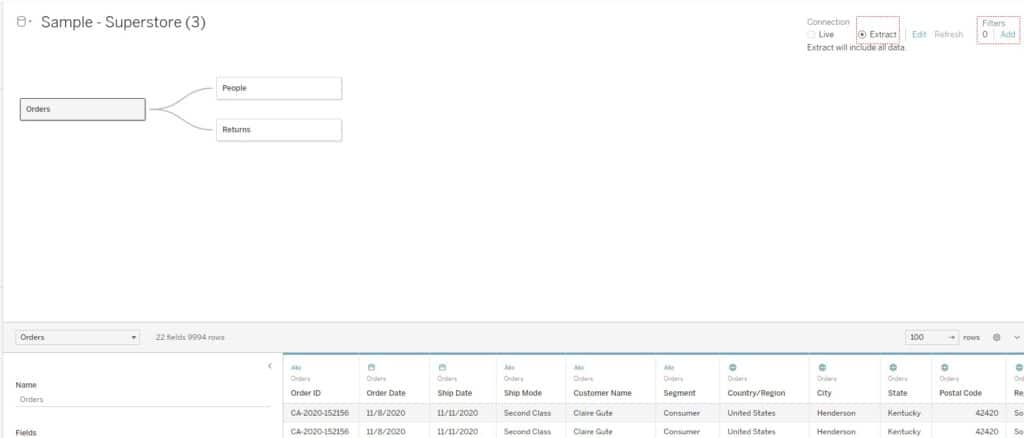
The extract filter is the first to be processed. You can create an extract filter from the Data Source pane by clicking on “Add” in the top right of the screen and ensuring that the Extract radio button is selected.
For this demonstration, I want to filter to a specific region. To add this as an extract filter, I will click Add to open the dialog box.
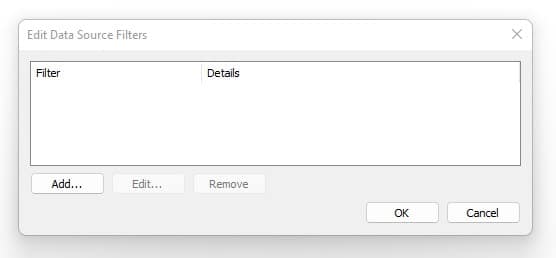
From this menu, I will click Add and select Region from the list of dimensions.
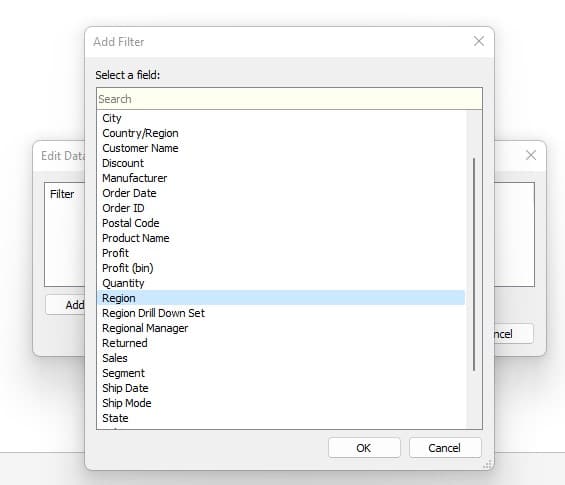
I will select OK, which will open a new menu. I will select Central and then click OK to close the menu.
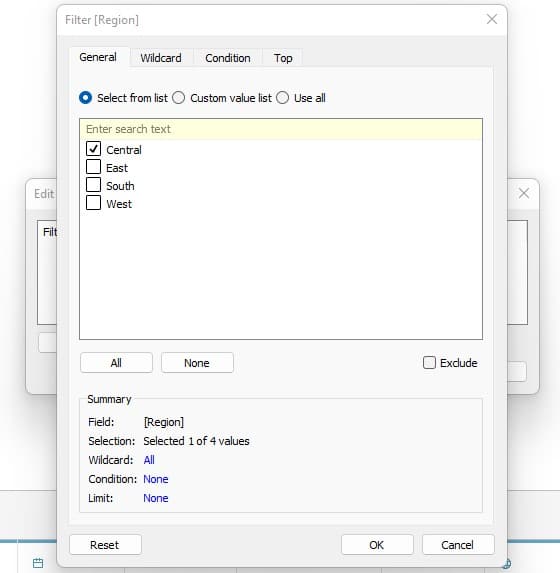
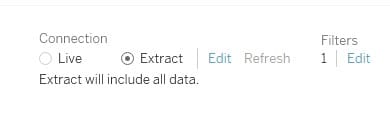
Now, we see a “1” appear to the left of the filters and the entire workbook is now filtered to the Central region.
With this Extract filter in place, all of the calculations moving forward are only happening on these rows of data. It’s like we’ve created a sub-set of our total dataset.
![]()
Data source filters
A data source filter works similar to an extract filter but is processed when Tableau processes the query. To demonstrate the difference I am going to remove the extract filter and drag Region to the filters shelf in my view and select central.
I will click OK then I will right-click on Region in the filters shelf, navigate to Apply to Worksheets, then click All Using This Data Source.
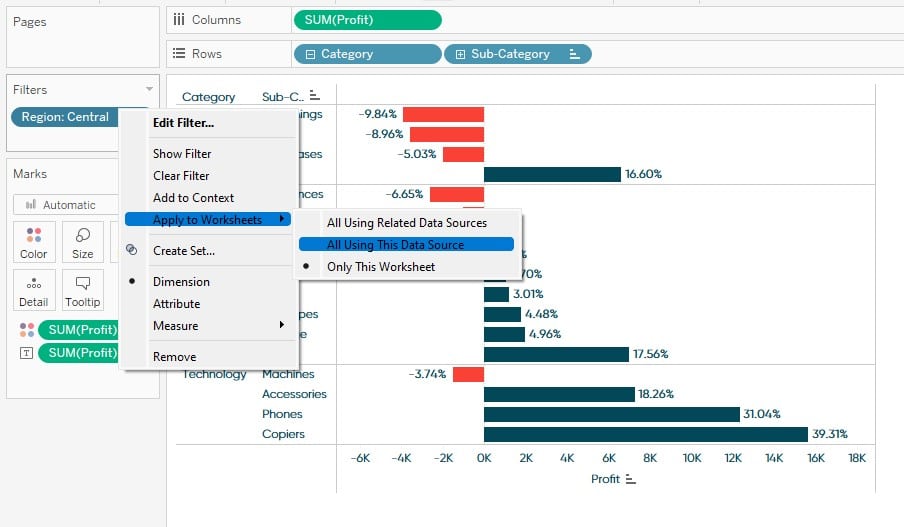
This will create a data source filter. While extract and data source filters are similar the extract filter is limiting the number of overall rows in the extract while the data source filter is not. You can also use them in tandem as well. For instance if you applied a extract filter on Region and a data source filter on State.
Context filters
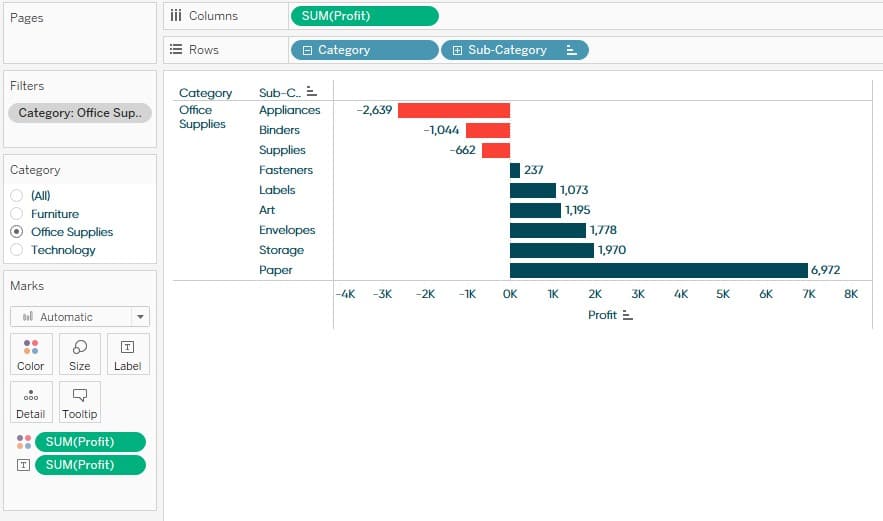
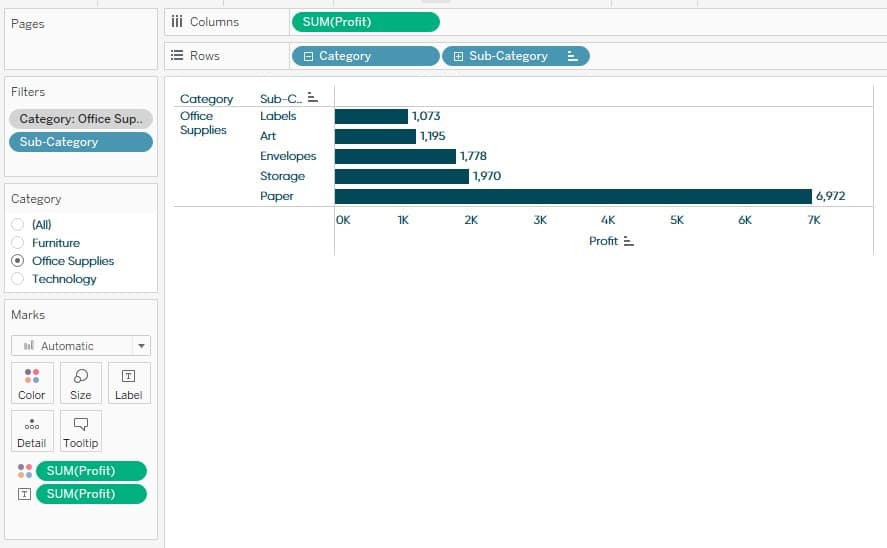
To demonstrate a context filter, I have created a diverging bar chart that shows the Sum of Profit and I want to add a context filter for Category.
To add the Category context filter, I will drag Category to the Filters Shelf and click OK on the menu that pops up.
We can see a dimension filter get added to the Filters Shelf represented by a blue pill.
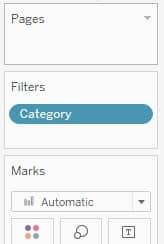
To change that to a context filter, I will right-click on the Category dimension filter and select “Add To Context”.
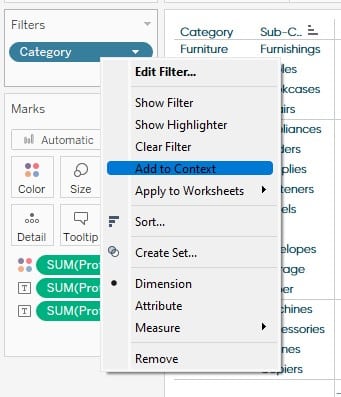
You will see the blue pill turn to a gray pill. This gray color represents that this is a context filter. A few things to note about a context filter that make them different from a regular dimension filter. Going back to the order of operations in Tableau, the context filter gets processed first which adds a speed boost by cutting unnecessary rows from being processed. We also get a cascading effect down to other filters, meaning that my dimension filters will be filtered down to what I have in context as well.
I will explain more about the cascading when we cover dimension filters. For now, I will set my context filter to a single value selection and choose Office Supplies.

Two Ways to Make a Diverging Bar Chart in Tableau
Condition filters, top N filters, and dimension filters
Condition filters
To demonstrate a condition filter, I will drag Sub-Category to the Filters Shelf. By selecting the Condition tab from the menu, we now have the ability to create a condition filter.
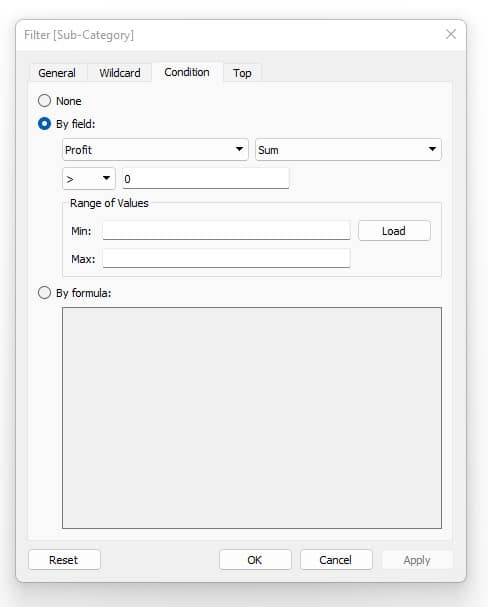
We can see we have a couple options: By Field and By Formula. Selecting By Field allows us to create some basic conditions using a drop down to choose a measure, an aggregation, an operator, and then a value.
We also have the ability to choose a range of values. If you click Load, to the right of the Min and Max boxes, it will auto populate the Min and Max values from the view.
Last, we can select By Formula. Choosing this option will give us the ability to enter in a custom formula similar to creating logic in a calculated field. As such, we can pair this option with a parameter to allow the user to change the condition from the tool rather than it being fixed.
Top N filter
To create a top N Filter, I will use the Sub-Category dimension again. Just like the previous section, I will drag Sub-Category to the Filters Shelf and click the “Top” tab.
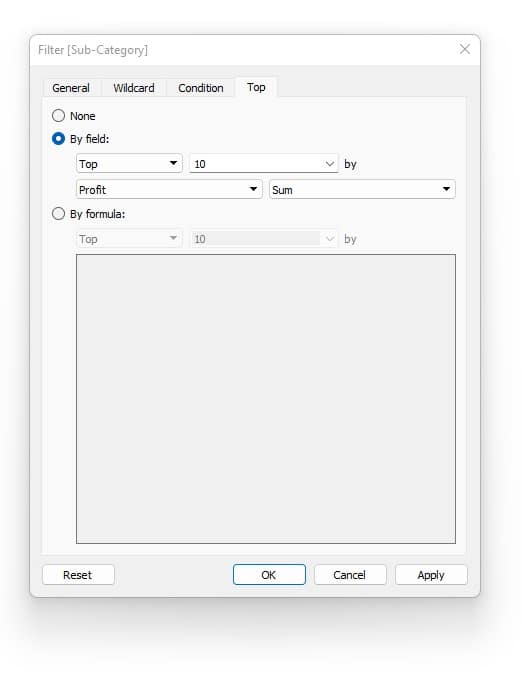
You can see we are presented with similar options as before; By Field and By Formula. If we select By Field, we have the ability to set certain conditions such as Top or Bottom, the number to display, measure, and aggregation.
If we select By Formula, we can define the top or bottom and the number to display by a custom written formula. Again, this is a great opportunity to pair this tactic with a parameter so the user can interact with the filter.
As a demonstration, I will select the top 5 by the SUM of Profit.
Before:
After:
You can see that the view has filtered down to the top 5 based on the SUM of Profit. Watch what happens though if I remove the Category filter from Context, which you can do by right-clicking on a context filter and selecting “Remove from Context”.
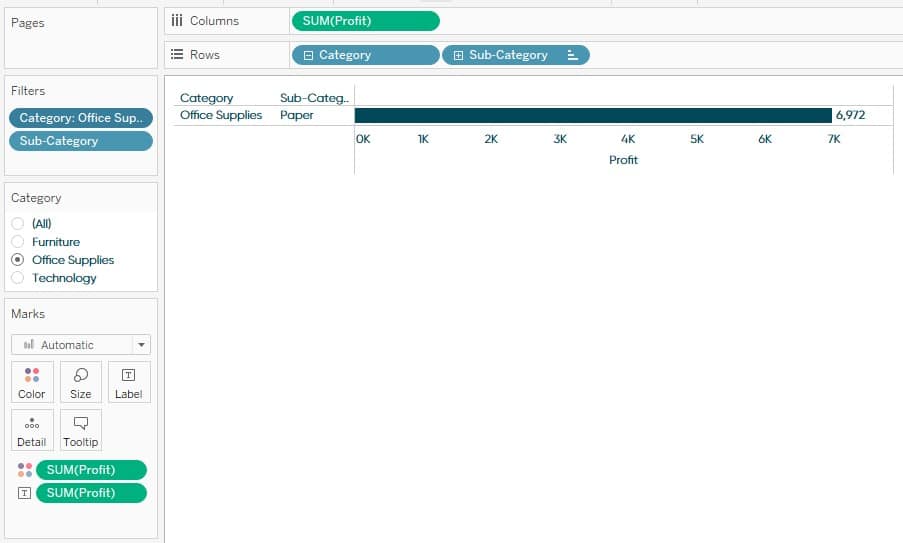
You can see the only change I made was to change the Category filter to out of context and I made it just a regular dimension filter. However; we only have a single Sub-Category in the view. What happened to the top 5?
This is where the order of operations and cascading comes in.
We can see that context filters are processed first before the Top 5 filter. This means that the data the Top 5 filter is being applied to is narrowed down to what is in context. In this example, that would have been Office Supplies. Now the Category is just a regular dimension filter and the Top 5 filter is being applied to all the data before dimension filters are processed.
Dimension filters
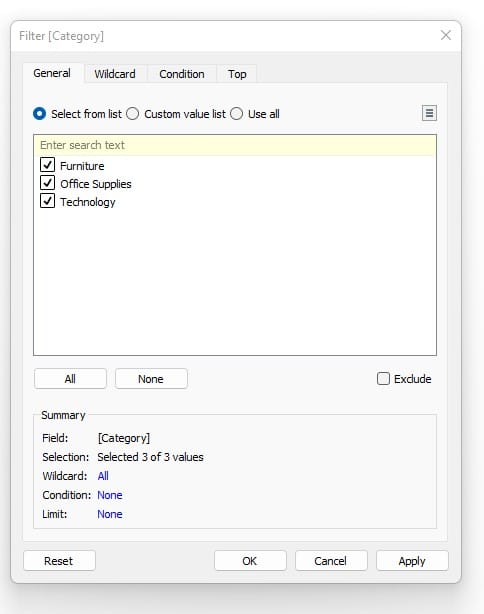
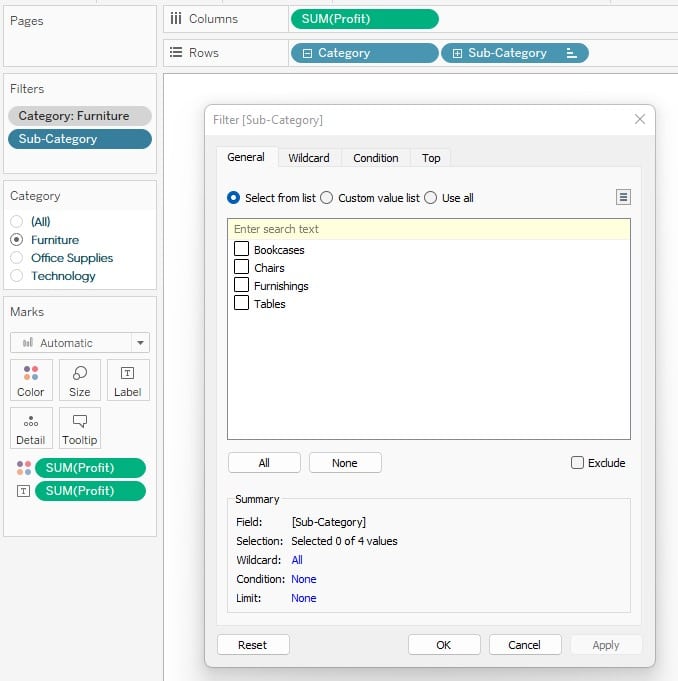
I will use the Sub-Category dimension once again to demonstrate this type of filter. To add it, I will drag Sub-Category to the Filters shelf and the Filters menu will pop up. The default tab of this filter is General, which creates a dimension filter.
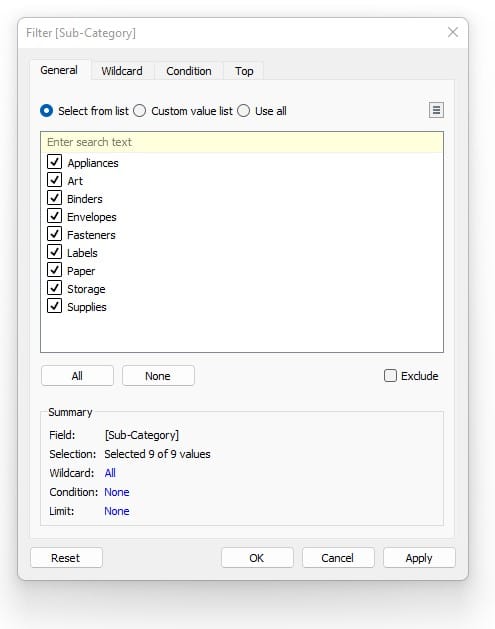
In the menu you can select or unselect which dimension members you want to filter to. There is also an option to check the Exclude checkbox on the right of the screen. This will exclude the values you have selected and include the ones you do not.
One more thing to note. Look at our list of available values; notice that these are only Sub-Categories from the Office Supplies Category? This is another effect of our Context Filter, but in this case it could create a bad experience for our users. To show you what I mean, let’s select the first three Sub-Categories.
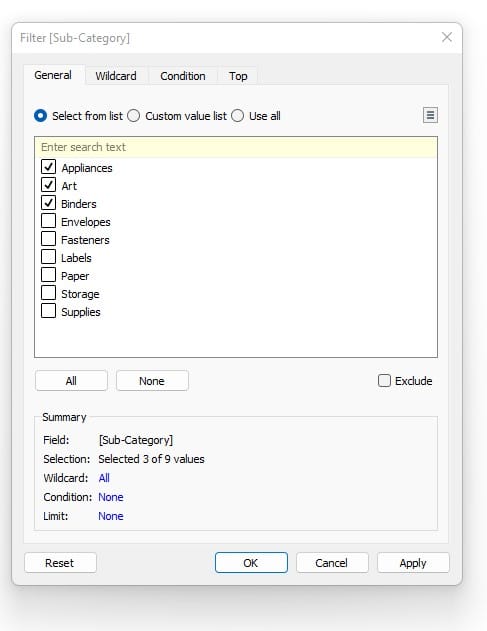
I will click OK then change my Category context filter to Furniture. Everything disappears because I have only included those three Sub-Categories that are a part of the Office Supplies category.
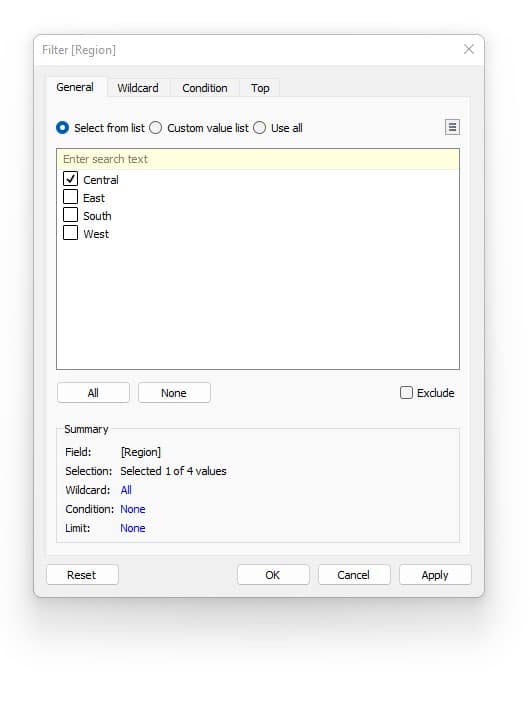
Given that you have the filter options on your dashboard, the user could make a new selection – but there is a better way! To overcome this, there is a way you can kind of override the Context filter. At the top right corner of the Filter menu, there is a little square with three lines in it. Clicking it will display a list of options as seen below.
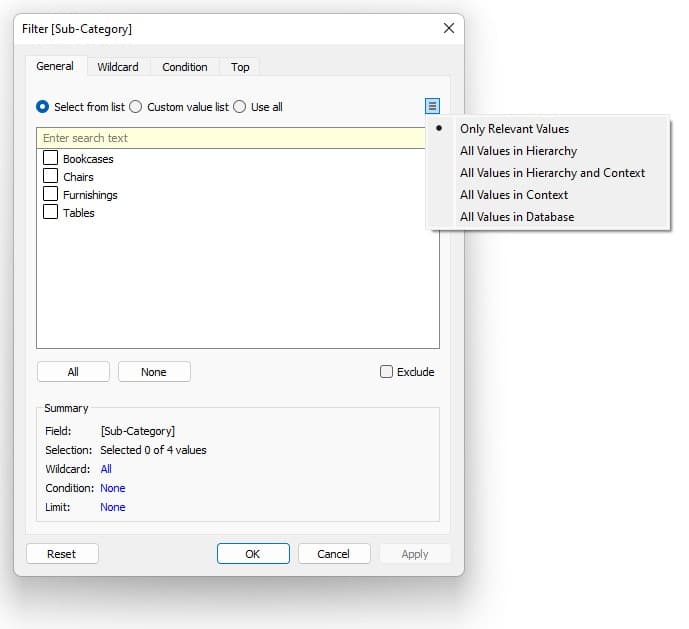
If you choose All Values in Database, you can automatically select all of the Sub-Categories by default. Then selecting Only Relevant Values again, the user will still only see the values in context. However, now when switching to another Category the view won’t just disappear.
I’ll start over and walk us through those steps.
Add the Sub-Category dimension to the Filters shelf, click the menu icon in the top right, select All Values in Database, and click the All button. This will check all the Sub-Categories.
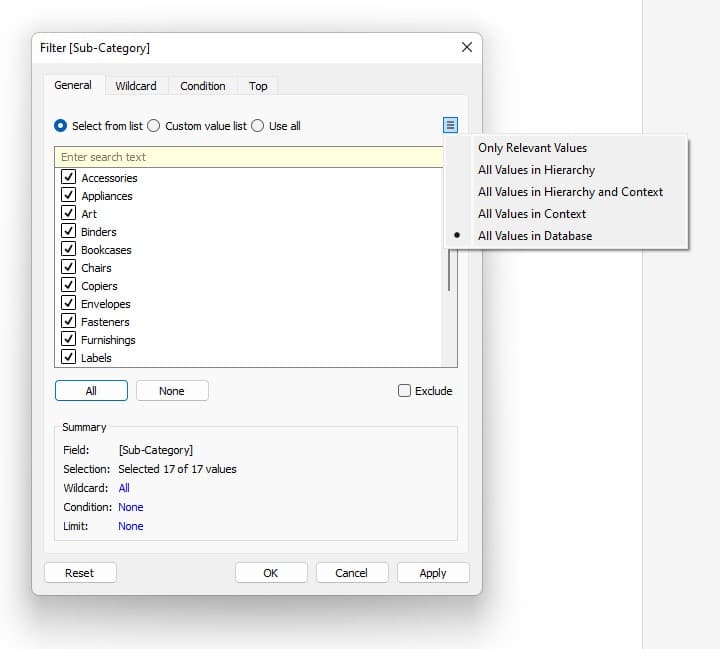
Select Only Relevant Values from the menu again then click OK. All the values are now selected and if the filter options are displayed to the user, they will still only see the values that are in context. Now if a user changes the category, the view wont disappear.
Measure filters and table calculation filters in Tableau
Measure filters
Next in the order of operations are measure filters. To demonstrate this one, I will drag Profit to the Filters shelf. We will see the following menu appear.
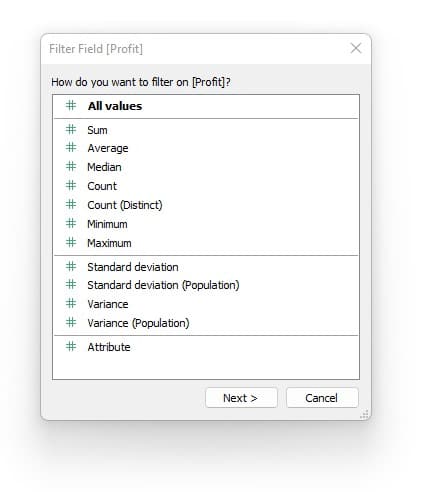
We have all kinds of options here. There are different types of aggregations we can apply to the Profit measure and some conditions like Variance and Standard Deviation. To make this easy to explain, I am going to select the same Aggregation we have applied to Profit in the view, SUM. Then I will click OK and a new menu will pop up.
This is probably the most common use of a measures filter. Here you can set MIN and MAX values or click on the At least or At Most tab to set one or the other. Again, the order of operations comes into play here.
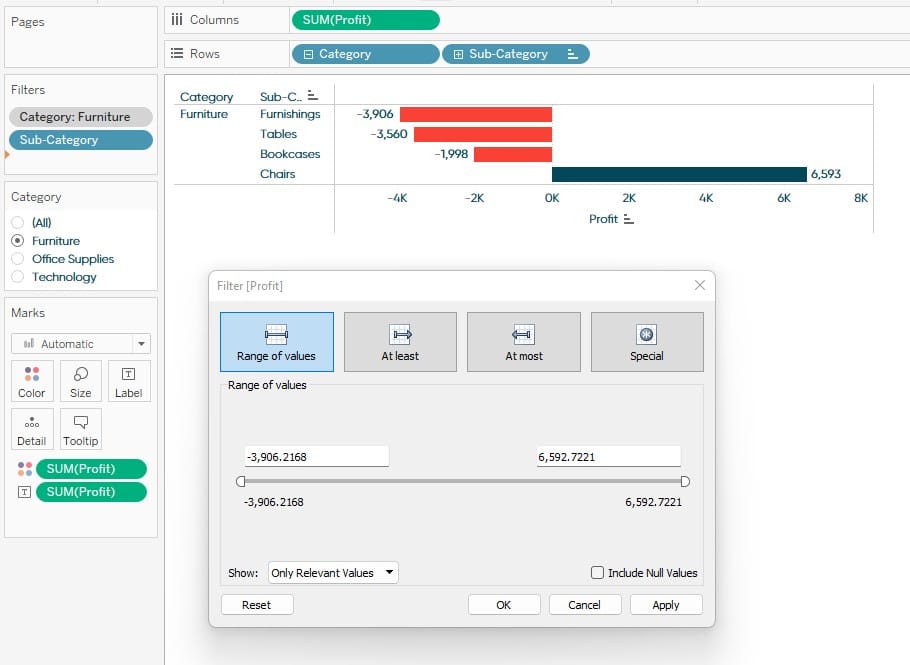
Notice the MIN and MAX values are the values from the Furniture category. If I switch to Office Supplies and then add this measure filter again, the MIN and MAX values will change.
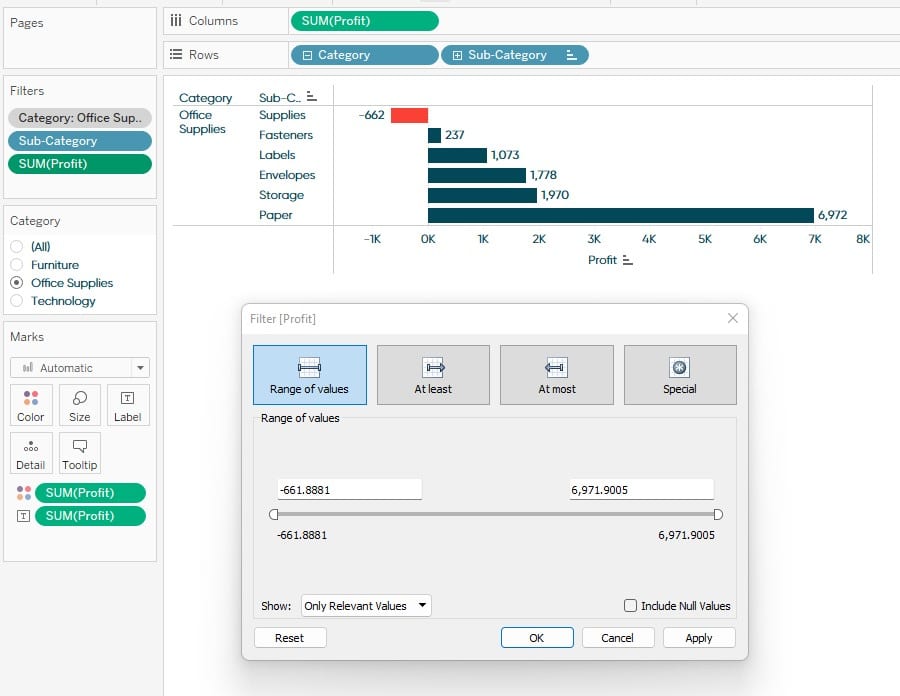
If I have my range of values set to the MIN and MAX from the Office Supplies category and I switch to Furniture, some Sub-Categories will be filtered out. To overcome this, select the drop down at the bottom left of the menu and choose All Values in Database.
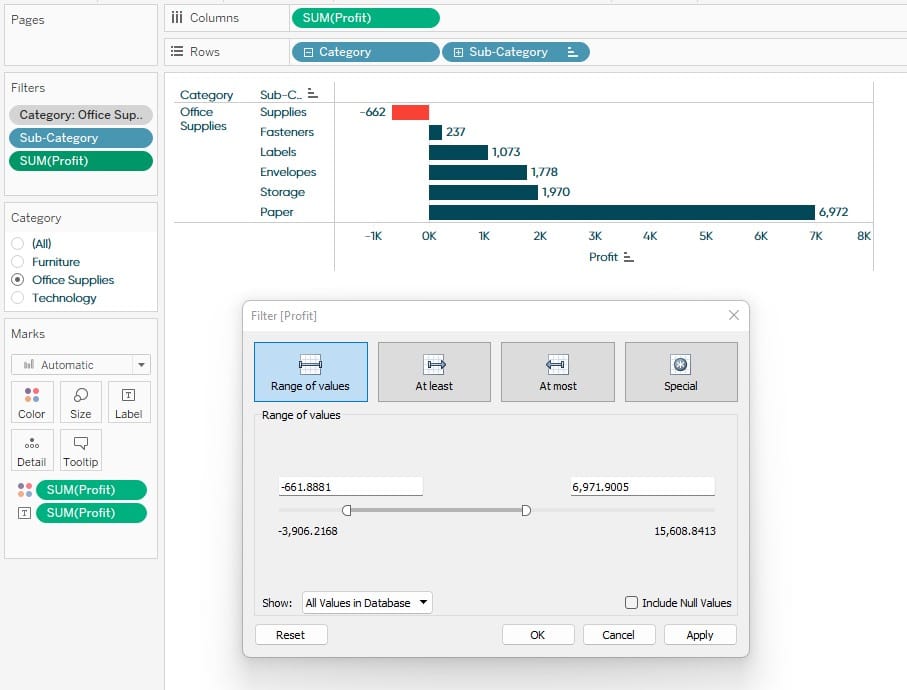
This will create a much better user experience if they have the full range to filter to. If you show the filter in your dashboard, Tableau will also show the range of what is in your view, represented by the darker space on the slider bar.
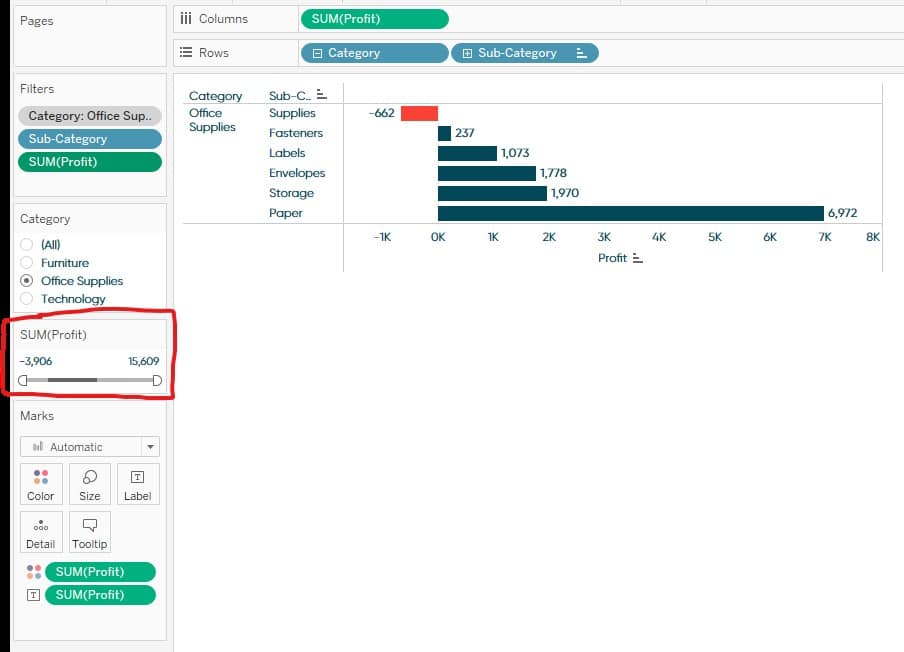
Table calculation filters
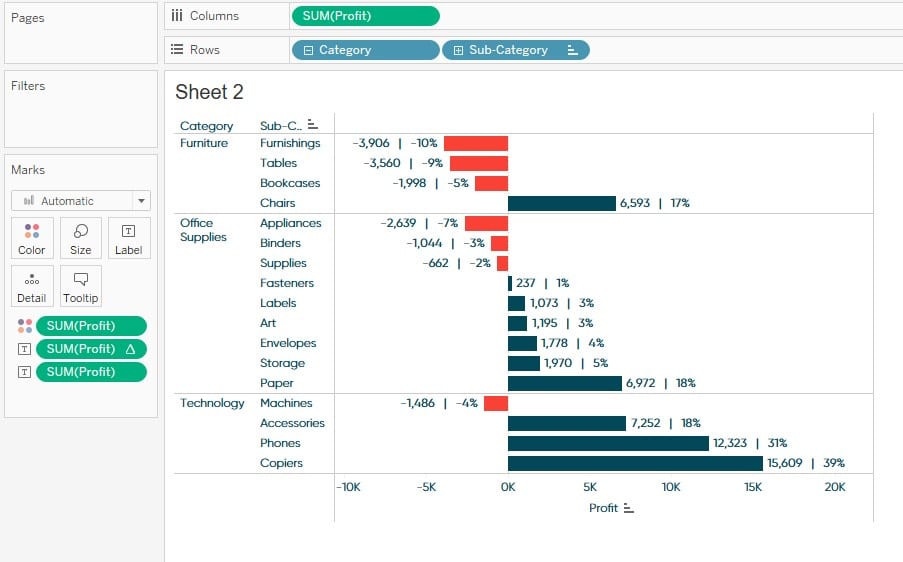
For table calculation filters, I am going to change SUM of Profit to the percent total of Profit by right-clicking Profit in the Marks card, selecting Quick Table Calculations, and choosing Percent of Total.
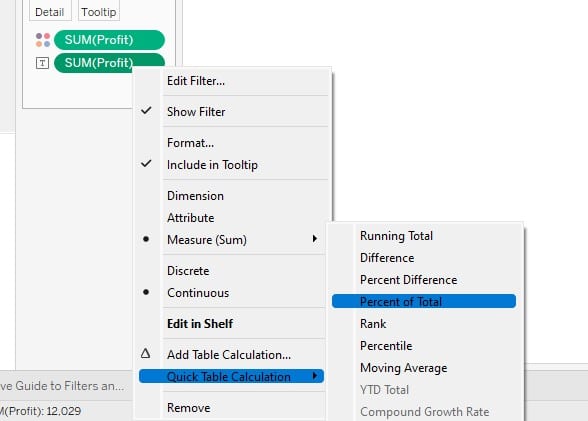
Now I want to add this table calculation to the Filters shelf. To do this, right-click on the pill and select Filter.
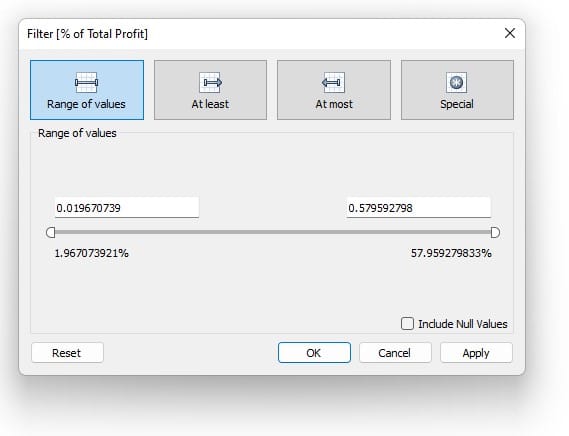
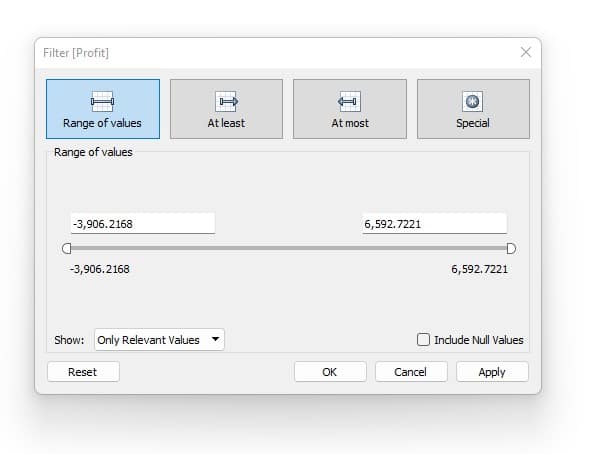
This filter menu is similar to the measures filter we covered in the previous section with one major exception. Notice in the bottom left corner we no longer have the ability to show all the data in the source. Table calculations are a special type of calculated field that computes only on what is in the view. So, unlike the measures filter we can only add a table calculation filter to what is in the view.
![]()
With that said, I will click OK and add this to the view. We now have 4 different types of filters on the Filters shelf.
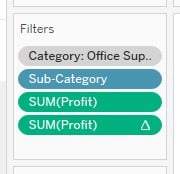
Remember, the grey pill is our context filter, blue pill is the condition, top N, and dimension filters, and the green pills are our measure and table calculation filters.
Looking for more Tableau technical feature fundamentals? Check out our other “definitive guides”:
- The Definitive Guide to the Analytics Pane in Tableau
- The Definitive Guide to Buttons in Tableau
- The Definitive Guide to Tableau Sets
Until next time,
Ethan Lang
Director, Analytics Engineering
[email protected]


Written By
Ethan Lang
Related Content
The Definitive Guide to Tableau Sets
In this post you will learn how to: (1) create static Tableau sets, (2) create dynamic sets, (3) use sets…
3 Innovative Ways to Use Filters in Tableau

Tableau filters are a dashboard engineer’s best friend. They help us convey a story, enhance the user experience and stay…

Ryan Sleeper
Make user selections stick when navigating between reports Ryan shows you how to add query strings to URL dashboard actions…