How to Use INDEX() for Easier Top N Tableau Filters
With each new field you add to the Tableau Filters shelf, you increase the complexity of the view and it becomes increasingly challenging to manage the combination of filters being used. Each filter being used acts as an AND statement, meaning that all criteria between every filter have to be met in order for the mark to show on the view. To make things trickier, some of the filters can be include, while others can be exclude. To make things even trickier, you can have measure filters and dimension filters, but the condition tab in a dimension filter can include measures – what?
Sometimes you simply want to show the top N (i.e. top 5, top 10, etc.) for whatever is left after entering all of the criteria. This post provides a very quick tip that I sometimes use to make my filters easier to manage and more predictable. This trick has the potential to not only improve the user experience of a view, but also of the authoring experience itself.
This content is excerpted from my book, Innovative Tableau: 100 More Tips, Tutorials, and Strategies, published by O’Reilly Media Inc., 2020, ISBN: 978-1492075653. Get the book at Amazon.
Traditional use cases for Tableau filters
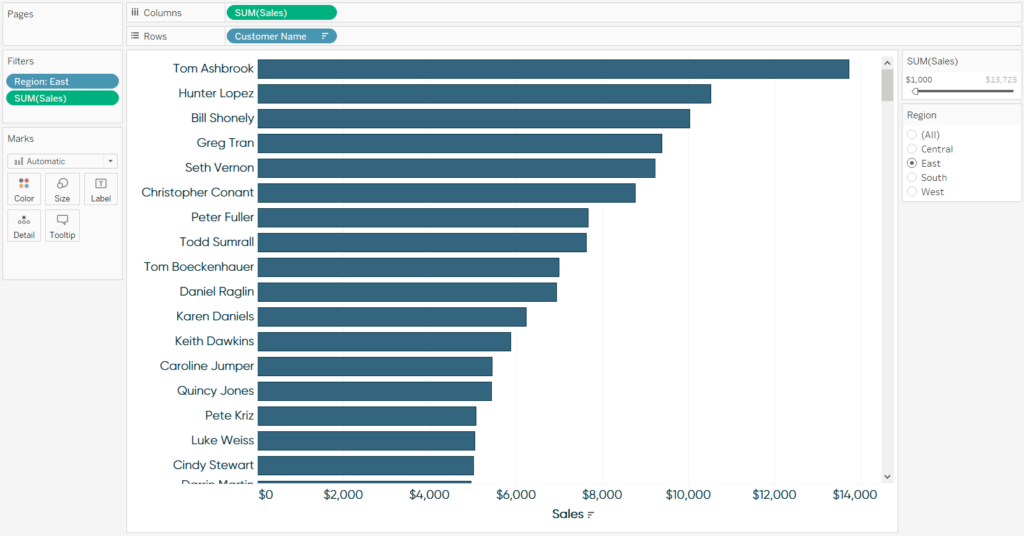
To illustrate this tip, consider the following view showing Sales by Customer Name in the Sample – Superstore dataset. The view is currently filtered to show customers in the East region who have spent at least $1,000.
Create a free account, or login.
Unlock this tutorial and hundreds of other free visual analytics resources from our expert team.
Already have an account? Sign In
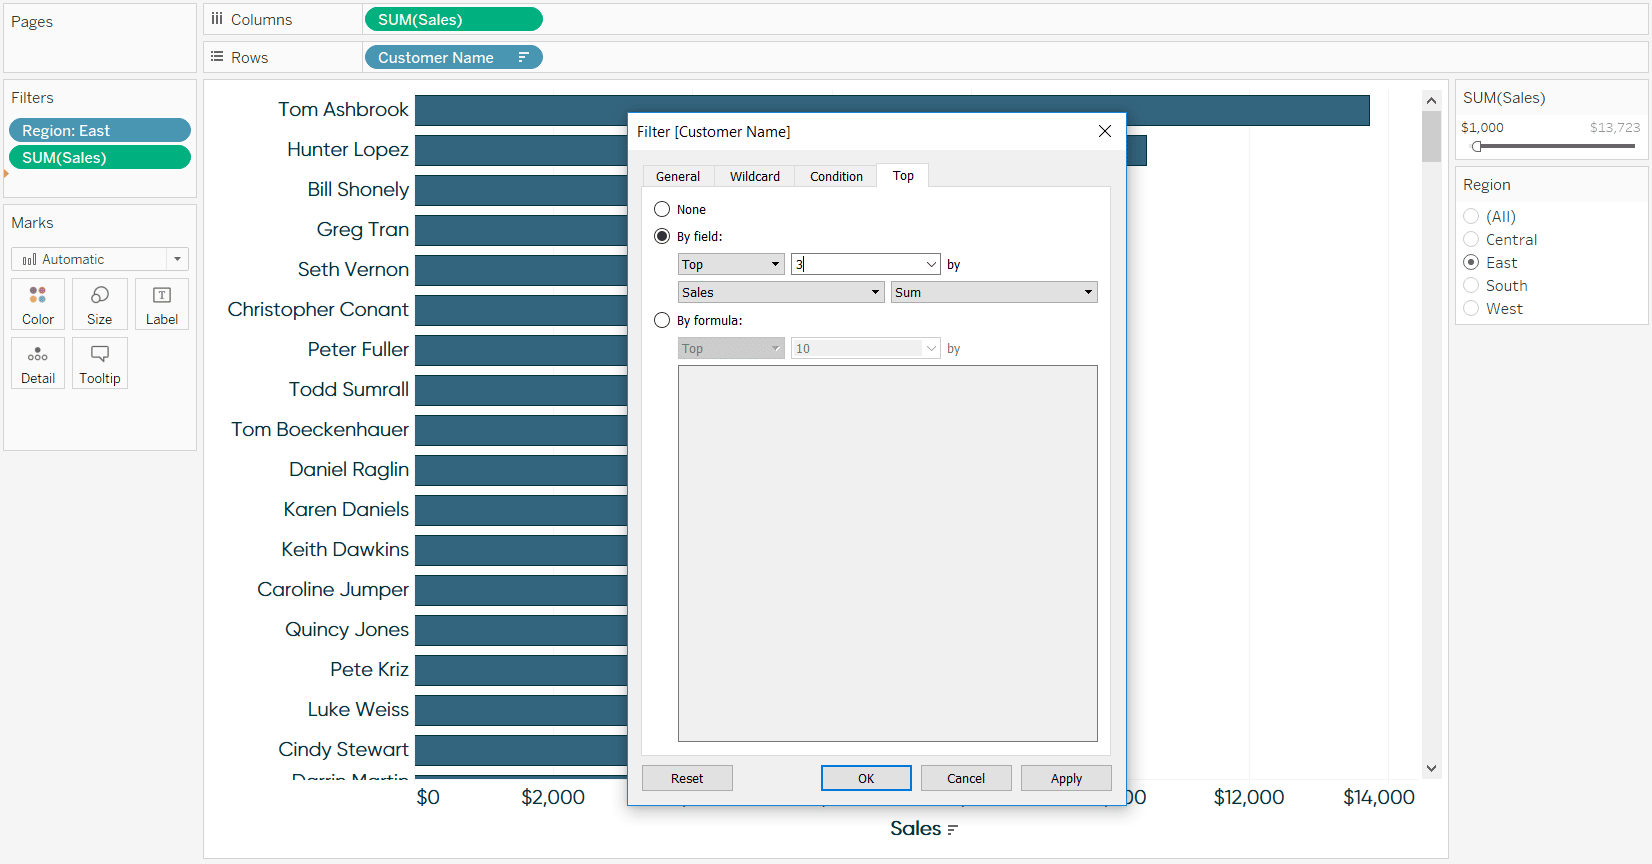
Now let’s say you want to keep the top 3 names on the view: Tom, Hunter, and Bill. Your first instinct may be to add a filter for Customer Name, navigate to the Top tab, and set it up to keep the top 3 by SUM(Sales).
And we’re left with Tom, Hunter, and…. Ken?
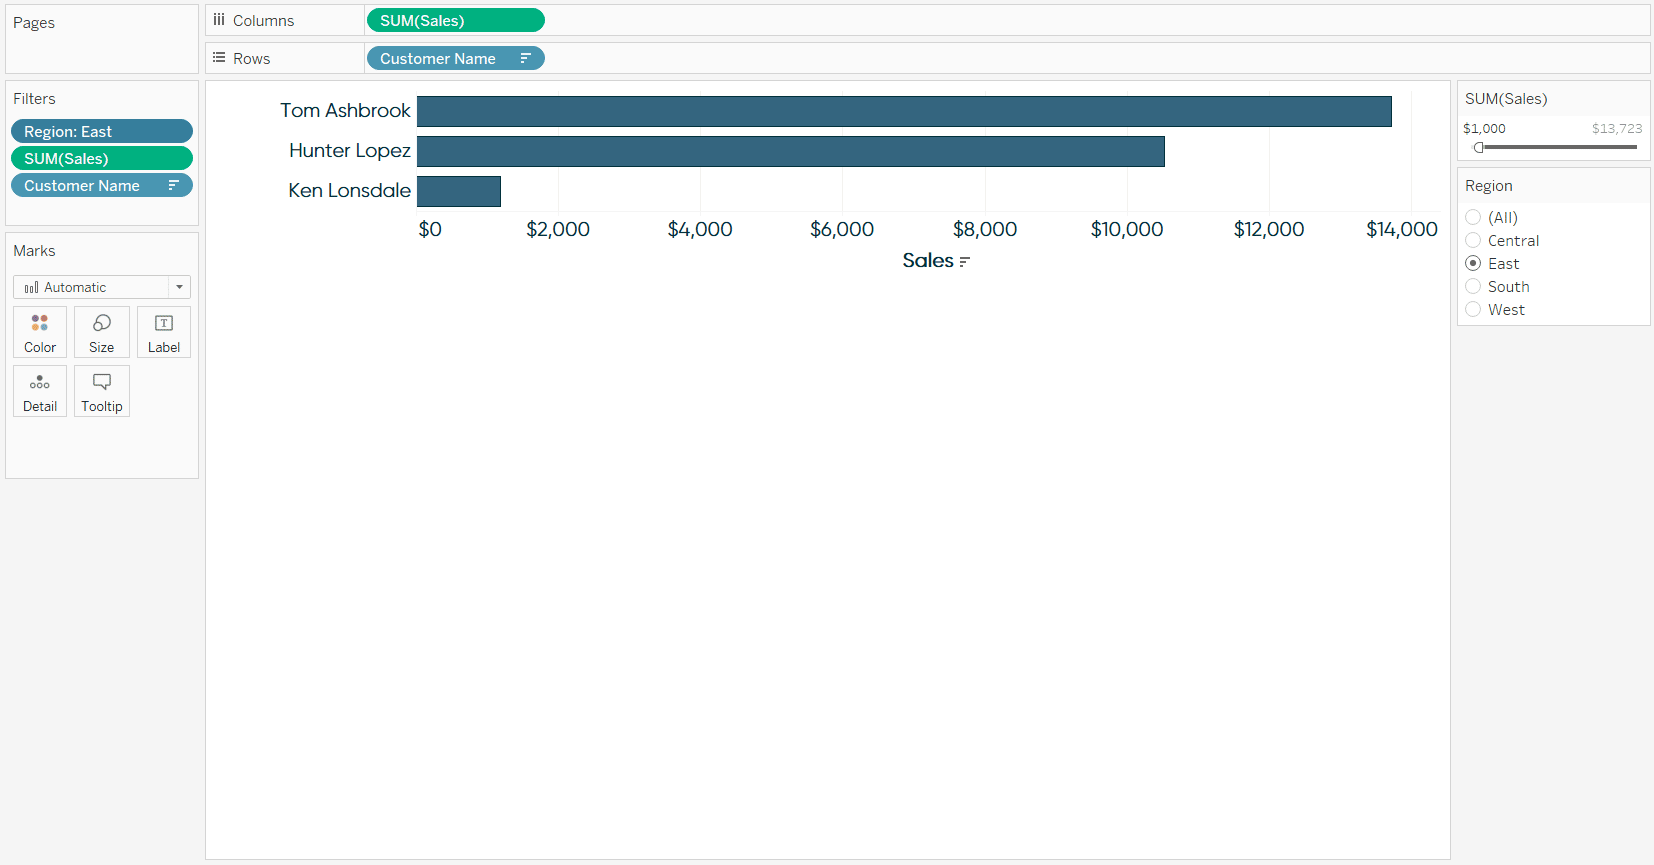
That’s because the filters are acting as AND statements, so all criteria have to be met, and Bill is not in the top 3 customers by SUM(Sales) overall. He is only in the top 3 of the East region. We could add the Region filter to context to get the result we are looking for, but that’s a conversation for a different post.
![]()
The INDEX() calculated field
Here’s the trick I like to use instead for faster, more predictable results. Set up a calculated field that looks like this, replacing the “3” with the number of records that you want to keep.
INDEX() <= 3
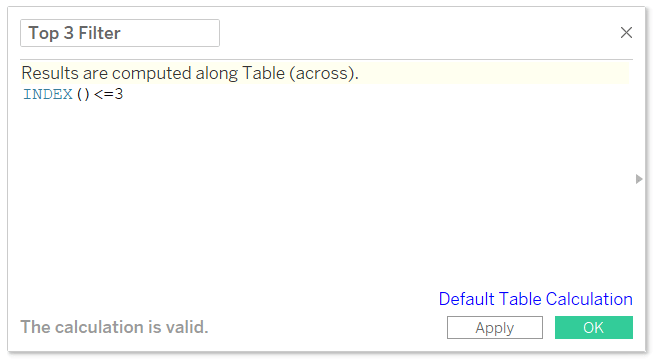
In this case, INDEX is synonymous with row number, so if your view is sorted in descending order, the top 3 will be kept on the view. If your view is sorted in descending order, the first 3 rows will be kept, which is actually the bottom 3 performers (of whatever rows are left from your other filters). The formula is binary, which is very efficient because there are only two outcomes to compute; the row is either less than or equal to 3 or it’s not. You could have also wrote this formula as INDEX() < 4. Here’s how the view looks when I replace the Customer Name Filter with this newly created top 3 Filter.
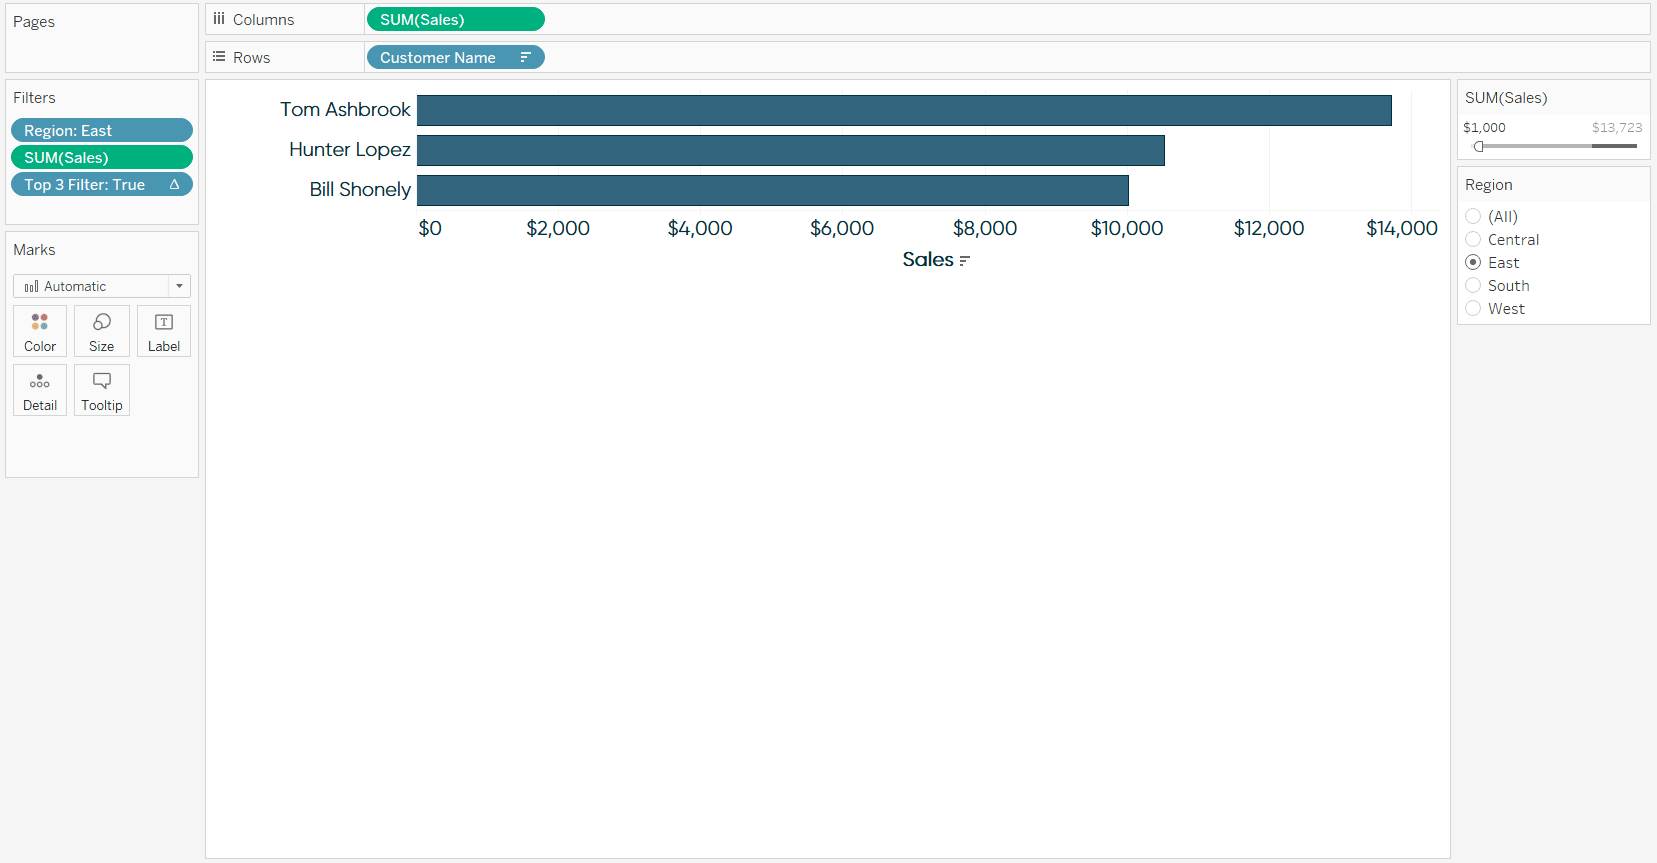
As you can see, we’re back to the expected result. What’s great about this is that the first three rows will always be kept, no matter which combination of filters is being used.
Tableau Filters and Order of Operations
Parameterize the top N for a better UX
To improve the user experience, you could ‘parameterize’ the number being used for the top N, allowing your end user to choose how many rows are being displayed. So instead of hardcoding a number in the top N Filter calculated field, replace it with a parameter that has allowable values for your end user to choose from. If you need some more information about parameters, see An Introduction to Parameters in Tableau.
Thanks for reading,
– Ryan


Written By
Ryan Sleeper
Related Content

Ryan Sleeper
Data source filters > context filters > dimension filters > measure filters See how the different types of Tableau filters…
How to Show Top 10 Lists in Tableau Tooltips
You may have heard the recommendation to provide your dashboard users details on demand. While I generally agree with the…
Ryan Sleeper
A tactic for improving the focus of an analysis Reduce the cognitive load on your end users and focus on…