3 Reasons to Learn Figma as a Data Analyst

Figma isn’t just for designers. If you’re a data engineer, analyst, Tableau / Power BI user who has been curious about using Figma for data but felt intimidated by not being a designer, consider this an invitation from the Playfair Data design team to jump into Figma! Whether you’re working on a team with designers or are navigating the design landscape independently, here are three reasons why you should add Figma to your toolkit.
Real-time collaboration for efficient decision-making
What sets Figma apart from other design programs is its ease of collaboration. In my experience as a designer working with engineers, it’s amazing how working with an engineer in Figma can save time and minimize miscommunication. The ability to hop on an audio call within Figma and follow each other’s cursors facilitates real-time interaction. Additionally, Figma’s FigJam is a great whiteboard collaboration tool that also has templates to help with the brainstorming and development process. Engineers can see and participate in the ideation, design, and iteration process. This is a great opportunity to give direct feedback on feasibility and quickly make design decisions.
These real-time collaboration capabilities go beyond the typical designer-to-developer workflow. Being part of the design journey provides valuable context, allowing engineers to gain a deeper understanding of the design’s original intention, its nuances, and the user experience it aims to deliver.
The value goes both ways though, as the engineer’s expertise is seamlessly woven into the fabric of the design. This level of collaboration is a game-changer if you’re working in a fast-paced environment, shifting the process from linear to a dynamic interactive exchange.
Continue reading with a free account, or login.
Unlock this tutorial and hundreds of other free visual analytics resources from our expert team.
Already have an account? Sign In
By continuing, you agree to our Terms of Use and Privacy Policy.
Interacting with design specifications
Navigating a Figma file independently empowers you with the ability to access precise values for spacing, font, color, and other elements used in a design. Having access to this can especially be beneficial in the instance when a designer is not immediately available. Compared to regular documentation, being able to directly go into Figma gives you the ability to interact with the design and clarify any ambiguities.
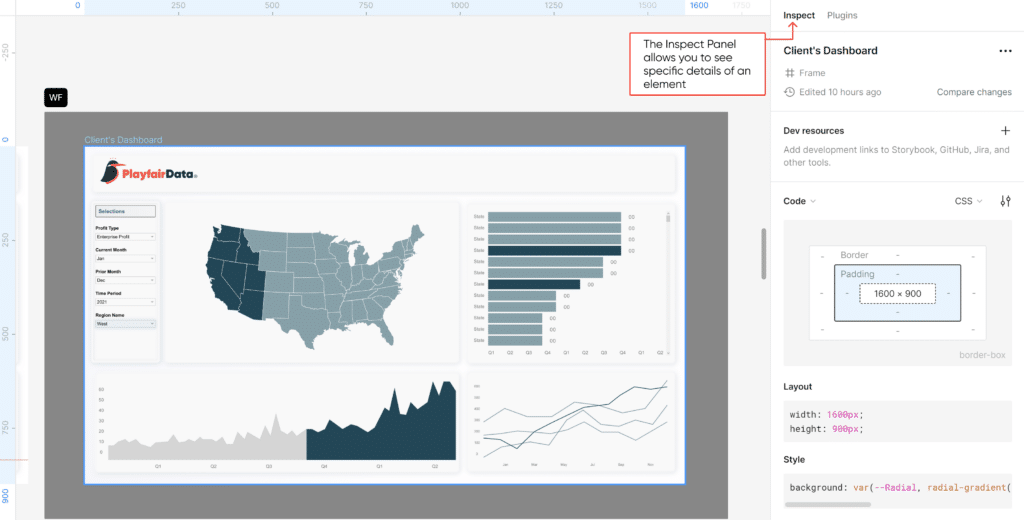
Figma’s Dev Mode serves as a bridge between design and development, offering a range of features that streamline this process. The Inspect panel, provides a detailed view of design elements, allowing access to specifications for spacing, font details, color, or even code if you need it.
Being able to go into dev mode can sometimes be more efficient. It’s easy to export specific assets like images or icons directly from the design, without the need for back-and-forth communication.
Accessing Dev Mode
• Navigate to the upper right-hand corner of the Figma interface.
• Locate (next to the share button) and switch the toggle to enable “Dev Mode”. If elements turn green, that means you’re in the right spot.
Inspect Panel
• In the Inspect Panel, you can access information about your design element such as:
• Specifications: View details of text, shapes, and components.
• Styles and Assets: Explore the properties of a component.
• Code View: Examine layout and style code, which is especially helpful for specifications like padding and typography details (color, font-size, font family, line height).
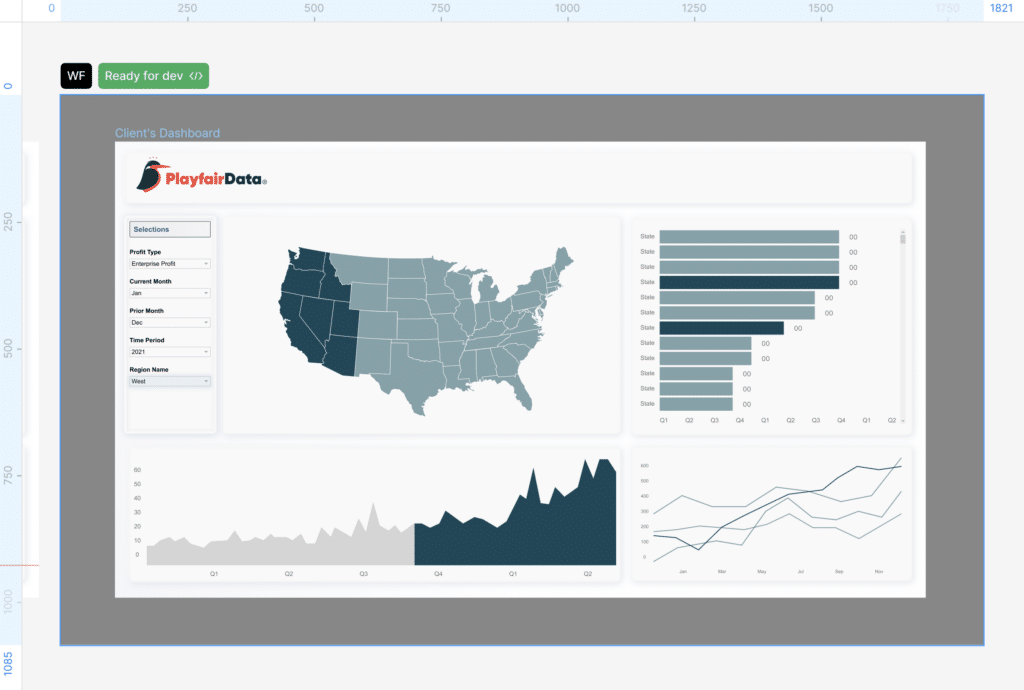
Development-Ready Feature
Utilize the “Ready for Development” tag to mark sections that are finalized and ready for development.
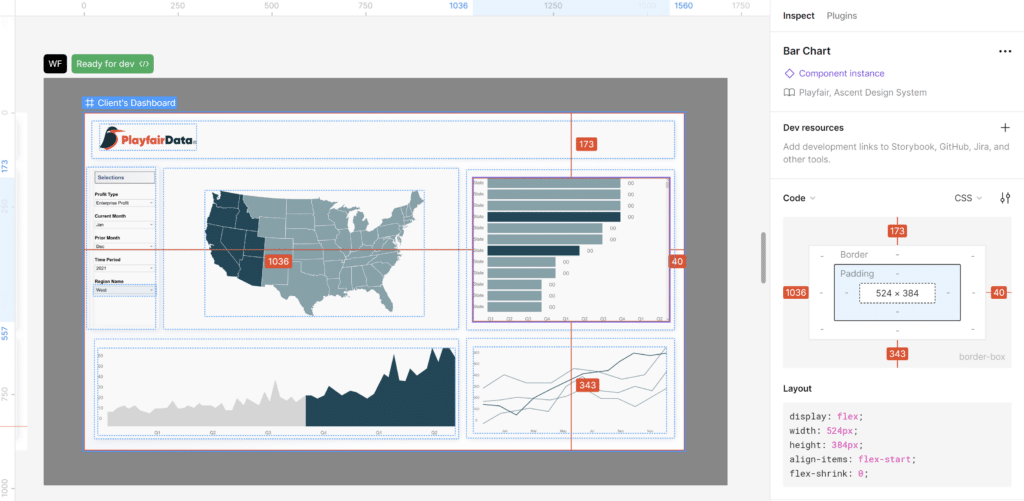
Hover
Hover over any element in your design or wireframe to view detailed specifications, including element dimensions and spacing.
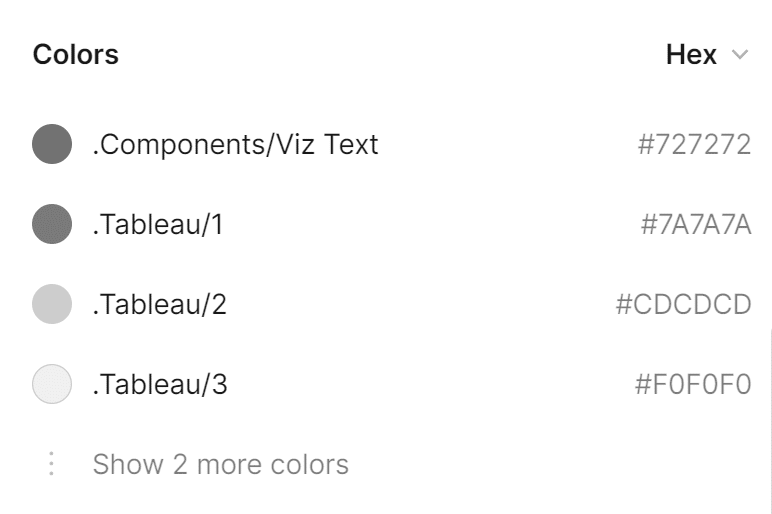
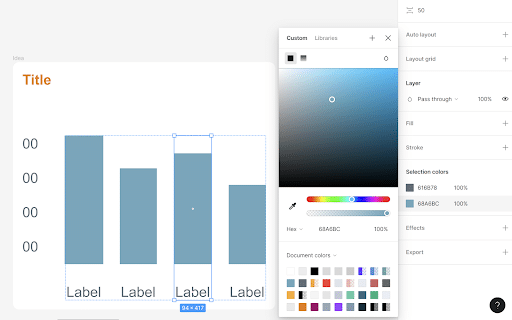
Color Hex Codes
Easily identify and copy color hex codes for precise color matching.
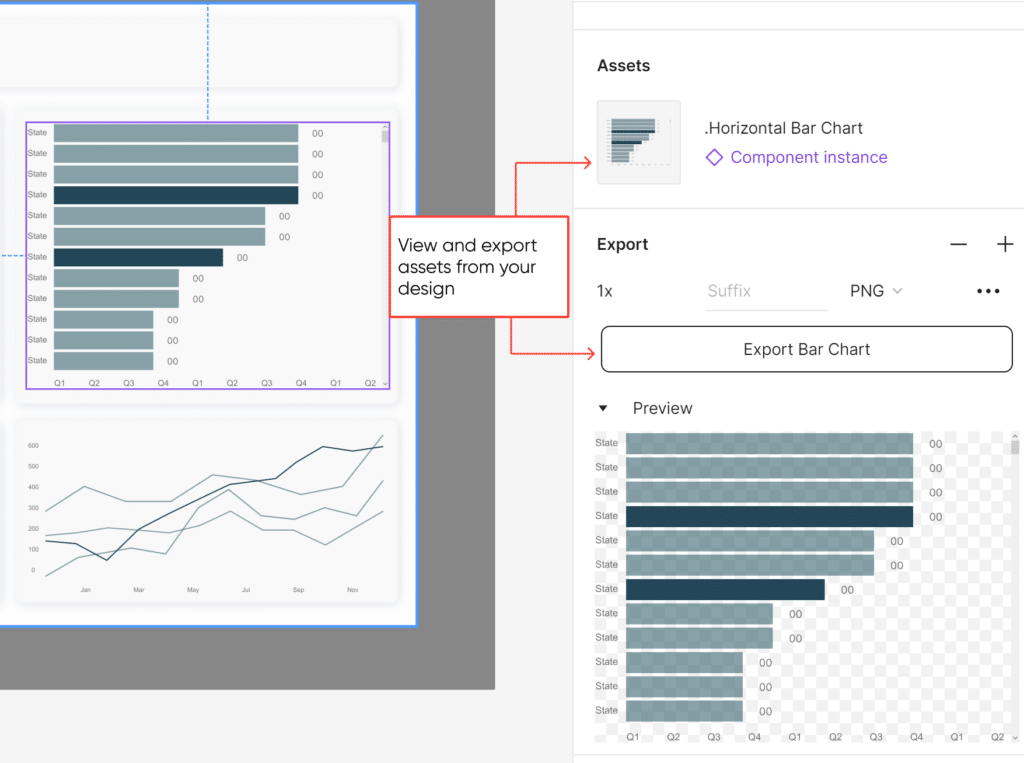
Export
Use the panel to conveniently export assets.
Quick sketches using Figma for data
Feeling creative? Do you have an idea for a visualization you’d like to brainstorm? With a design software like Figma, you can use it as a playground to brainstorm and ideate before investing time and energy into engineering. Instead of jumping straight into the development phase, you can first explore and refine your ideas in Figma. It provides an environment where you can experiment freely, moving elements around, trying out different styles, and rapidly iterating your visualization concepts.
Luckily, you don’t have to be a design expert to use Figma. Its intuitive interface and easy-to-use tools make it accessible for all levels. A basic knowledge of the tools is all you need to begin visualizing your concepts. This means you can explore your creative side and fine-tune your data visualizations fairly quickly even as a beginner.
Here’s a quick rundown of how you can get started ideating your visualizations.
Getting Started
Open Figma and create a new project. Familiarize yourself with the Figma interface, including the toolbar, layers panel, and design panel.
Setting up your Canvas
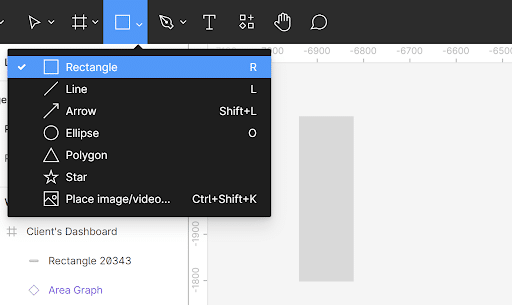
Create a new frame by clicking on the frame tool in the toolbar. This will be the container for your visualization.

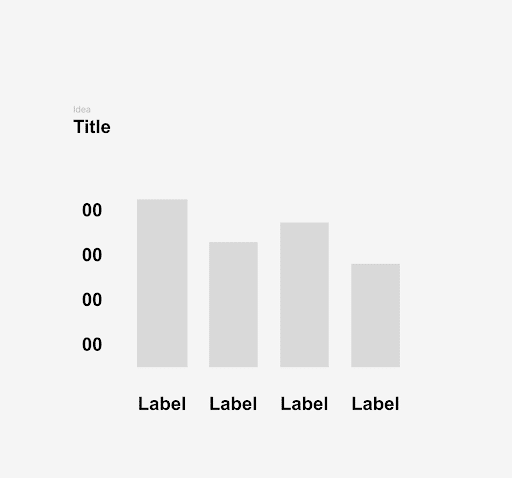
Visualizing Data
If you have data you would like to visualize, you can create shapes or text layers to represent the data points. For example, rectangles can be used to represent bars in a bar chart.
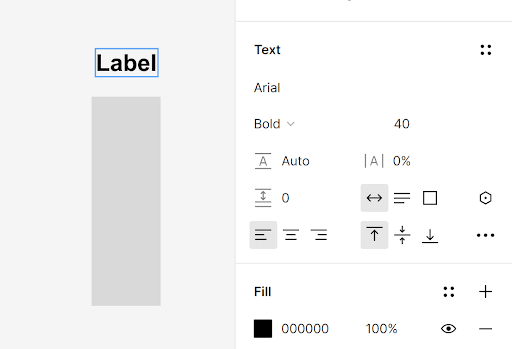
Adding Labels and Titles
Use the text tool to add labels, titles, and any other text elements that can provide context to your visualization.
Customizing Colors and Styles
Experiment with different colors and styles to make your ideations visually appealing. You can use the fill and stroke (outline) options in the properties panel to customize shapes.
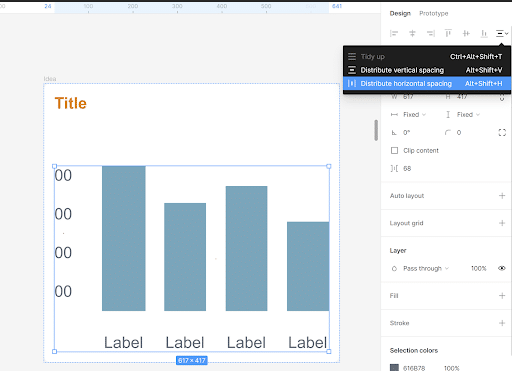
Arranging and Aligning Elements
Use the alignment tools (or auto layout) so that your elements are neatly arranged.
And if you’re feeling keen on enhancing your skills, there is a wealth of resources available to you. From online tutorials to community forums, you’ll find support and inspiration to take your data visualization ideas to the next level. Figma’s official website and YouTube channel have great tutorials, or get started by picking out some of the related content below this tutorial!
If you are a data engineer, analyst, or tableau user, learning Figma will give you confidence allowing you to efficiently collaborate with your team, provide you with accurate information when engineering, and if you’re feeling creative it’s a great space to help you visualize your data.
Thanks for reading,
Zoya

Written By
Zoya Zafar

Peer Review
Luke Lewis
Information Design Associate
Related Content
3 Ways to Wow Stakeholders with Figma
When it comes to demonstrations, it goes without saying that you want your stakeholders to walk away “wowed.” But what…
Tips for Creating Custom Color Palettes for Visual Analytics
When thinking about how we can tell a story through data, we often view the element of color as a…
3 Innovative Ways to Use Figma in Your Visual Analytics Projects


What does design software have to do with visual analytics software like Tableau? At Playfair Data, we approach our visual…