3 Ways to Make Lively Lollipop Charts in Tableau

If you’ve worked in data analytics or data visualization for any length of time, you’ll know that bar charts are one of the most prolifically used data visualizations out there – and for good reason. They’re generally easy to read and can be used in a variety of ways. Because of this, it’s not very hard to create a dashboard or report composed entirely of bar charts. While this may be easy for the end user to understand, it’s not very visually appealing or interesting to look at. (Although I don’t think that tops the report I once saw that was made entirely of pie charts. I wish I were kidding, but that’s a blog post for another day.) So how do you add visual interest and move away from the beloved bar chart, you ask? A great alternative is a lollipop chart, which can be just as easy to read, but also offers additional customization options that can liven up a dashboard. In this blog, I’ll explore some of those customization options, and by the end, you’ll be able to create a classic lollipop, diverging lollipop, and a multi-layer lollipop. Let’s get to it.
Explore more chart types with Atlas from Playfair+
The classic lollipop chart (plus a little pizzazz)
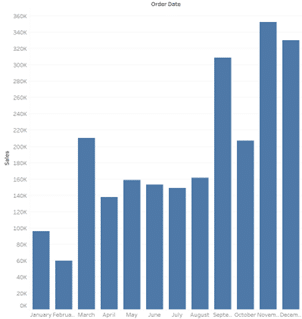
First, we’ll create a classic lollipop chart. To start, we’ll make a bar chart, which will act as the sticks for our lollipops. After connecting to the Sample Superstore dataset, drag Order Date to the Columns shelf and choose Discrete Month, then drag Sales to the Rows shelf. Change the mark type from Automatic to Bar. You should see something like this:
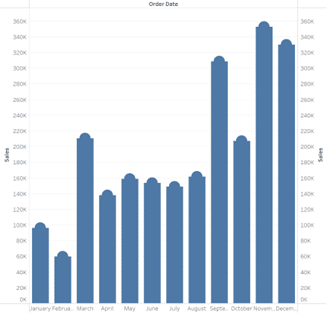
Next, drag Sales onto the Rows shelf again. You should see two bar charts stacked on top of each other. Click the dropdown on the second Sales pill and select Dual Axis. Right-click on one of the y-axes and make sure Synchronize Axis is checked.
![]()
Continue reading with a free account, or login.
Unlock this tutorial and hundreds of other free visual analytics resources from our expert team.
Already have an account? Sign In
By continuing, you agree to our Terms of Use and Privacy Policy.
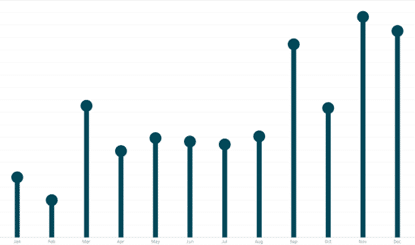
On the Marks card, choose the second instance of Sales. Change the mark type from Bar to Circle. These circles create the candy portion of the lollipop. Now we need to adjust the sizing to make our visual look more like lollipops.
Select the first instance of Sales on your Marks card, then click Size. Move the slider to the left to decrease the width of your “sticks.” Generally, I make the “stick” width about one-third of the circles’ diameter. You can also increase the size of the circles (the “candy” portion of the lollipop) to achieve the proportions you want.
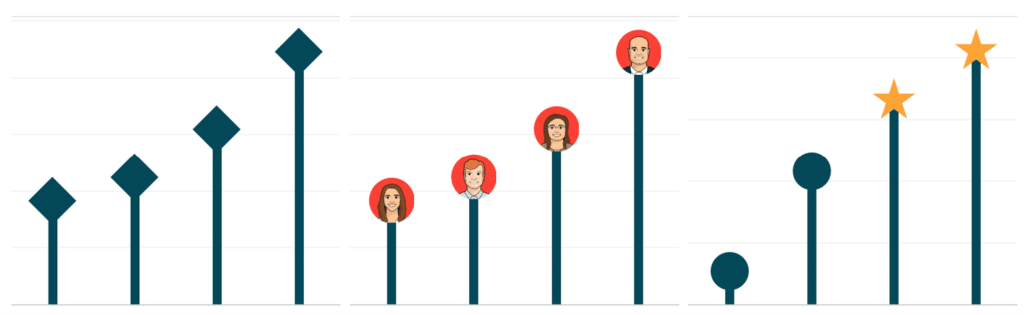
You can stop here with a nice, basic lollipop chart, or customize your lollipops by replacing the circles with different shapes, something not possible with bar charts. This is a fun way to add branding, attract interest, or implement visual encoding. Here are a few examples:
For more information on incorporating custom shapes into Tableau, check out how to make custom gauges from Ryan Sleeper.
Diverging lollipop chart
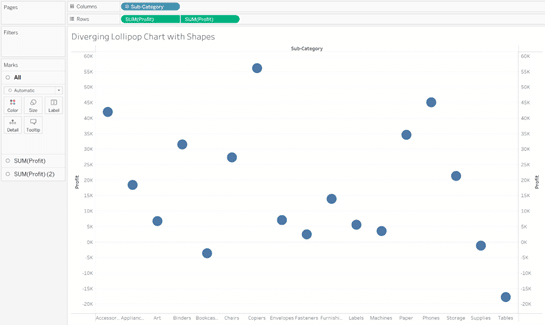
Next, we’ll build a diverging lollipop chart. I really like the visual movement you can create with this chart – it’s a great way to emphasize the directionality of your data. To start, drag Sub-Category to the Columns shelf and add two instances of Profit to the Rows shelf. Again create a Dual Axis and make sure Synchronize Axis is checked. Tableau will automatically swap all the mark types from bar to circle.
Click on the first instance of Profit and change the mark type from Automatic to Bar. This time we will use dynamic arrow shapes instead of circles. Positive profit values will be assigned an up arrow, and negative profit values will be assigned a down arrow. To do this, we need to create the following Calculated Field:
IF SUM([Profit]) > 0 THEN “Positive”
ELSEIF SUM([Profit]) < 0 THEN “Negative”
ELSEIF SUM([Profit]) = 0 THEN “Zero”
END
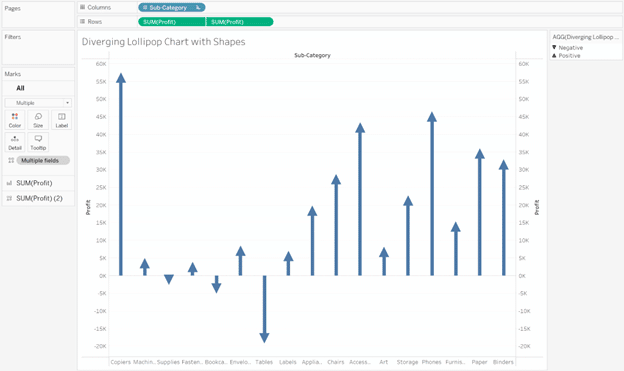
Once your calculated field is ready, click on the second instance of Profit and change the mark type to Shape. Drag and drop the Calculated Field onto the Shape property of the Marks card. Click on the Shape property of the Marks Card and select the “Filled” Shape Palette. Now you can assign the up arrow for “Positive” and the down arrow for “Negative. Make sure to adjust the sizes, so the arrows aren’t smothered by the bars.
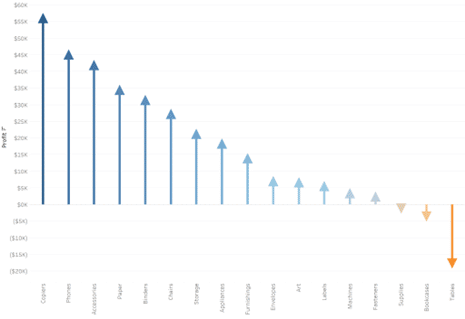
The last two elements to address are sorting and color. Click the drop-down on the Sub-Category pill, choose sort by Field, Sort Order as Descending, and the Field Name as Profit. Click the All instance of the Marks card, and drag Profit onto the Color property of the Marks card. Now both your bars and arrows should be colored by a diverging palette.
The combination of the color palette and arrows give this view a lot of movement and tell a story with your data. My final view looks like this:
Multi-layer lollipop chart
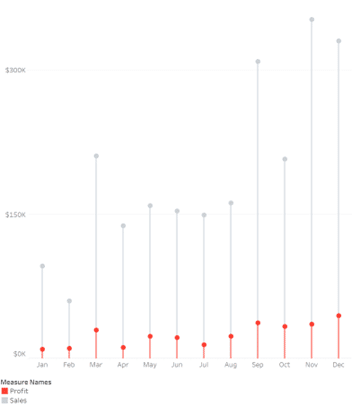
Our last type of lollipop chart is what we call a multi-layer lollipop chart. If you need to make comparisons or show proportions between two values, this visualization is a great option. We’ll start by putting the discrete month of Order Date onto the Columns shelf. Pull Measure Values onto the Rows shelf, and filter to just Profit and Sales. Add Measure Names to the Color property of the Marks card. Your view should look like this:
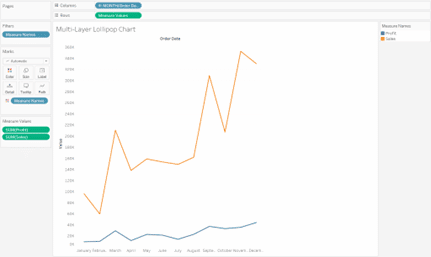
Next, hold down the CTRL key and click and drag Measure Values to duplicate it on the rows shelf. Create a Dual Axis and synchronize the axes. At this point, you will only have two lines in your view.
![]()
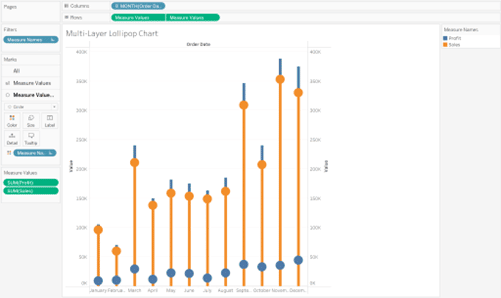
Click the first instance of Measure Values on the Marks card, change the mark type to Bar, and adjust the size so the bars are thin. Next, click the second instance of Measure Values on the Marks card and change the mark type to Circle. The visual will look a little off at this point because Tableau automatically stacks the Profit bars on top of the Sales bars.
To fix this, select Analysis in the menu bar, hover over Stack Marks and choose Off.
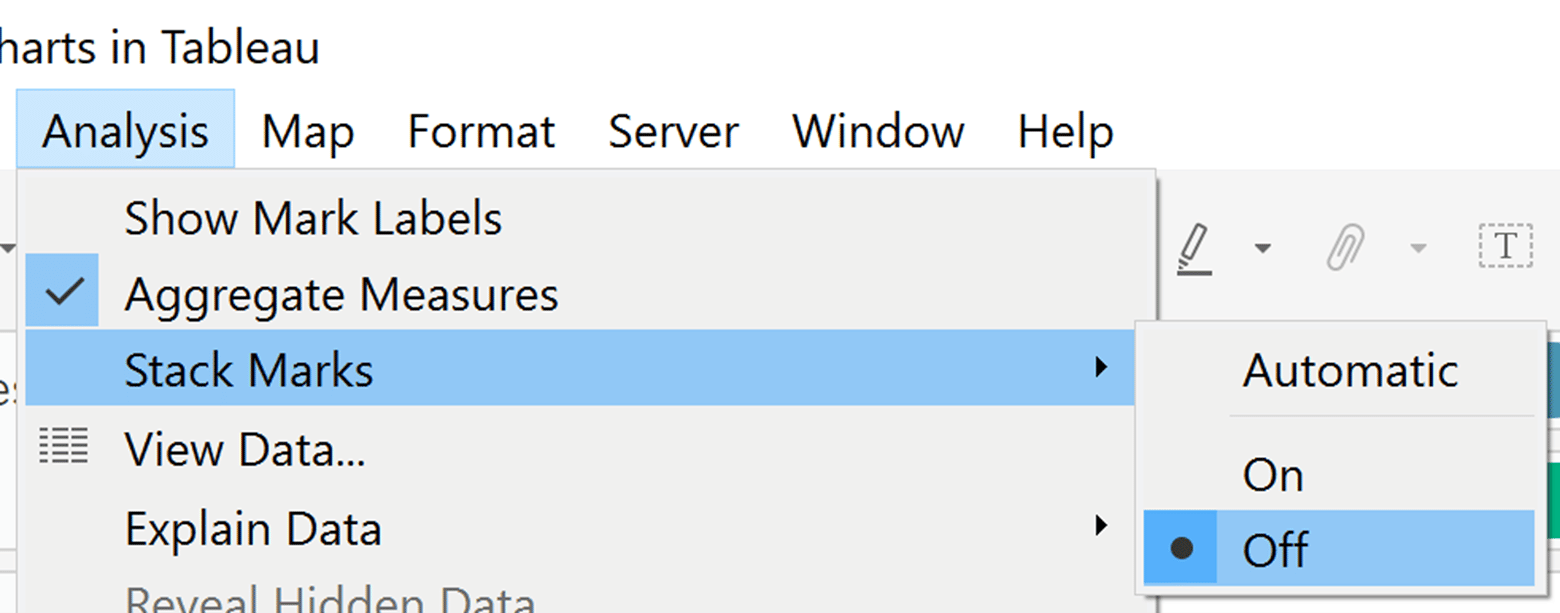
Now instead of stacking the bars, Tableau layers them on top of each other, which allows our lollipop “sticks” to line up with the “candy” circles properly.
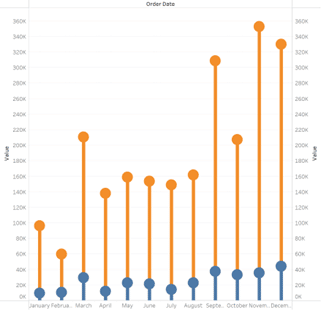
I updated the colors and cleaned up the formatting, so my final view looks like this:
Conclusion
Whether you’re looking for an alternative to bar charts, ways to add visual interest to your dashboards, or just want to learn a new chart type, lollipop charts definitely fit the bill. If you’re looking to jump-start your next project, our newest tool from Playfair+ is the absolute best place to start.
Atlas from Playfair+ is a comprehensive resource that not only provides chart-type recommendations but is integrated with Playfair+ tutorials to help you implement those recommendations. On top of that, Atlas allows you to fully customize the dashboards and visualizations (including lollipop charts) to fit your specific needs and preferences according to your projects. This customization can include changes to the appearance of the chart, such as the colors and fonts used, as well as more functional modifications, such as changing the data layout. By offering this level of customization, the Atlas library becomes a game-changing tool for visualizing and understanding data in the most meaningful and effective way.
Atlas is included with every Playfair+ membership, and I can’t recommend it enough!
Have fun, be creative, and happy vizzing!
Alyssa

Written By
Alyssa Huff

Peer Review
Megan Spengler
Manager, Decision Intelligence
Related Content
3 Ways to Make Brilliant Bullet Graphs in Tableau
Setting goals and measuring progress is a common activity for many people. Maybe someone wants to read 25 books, travel…

Ryan Sleeper
Several ways to use a favorite user feature This video will show you how to make dual-axis combination charts –…
3 Ways to Make Beautiful Bar Charts in Tableau
When it comes to data visualization, Tableau bar charts are still king. With all due respect to my other favorite…