3 Ways to Use Dual-Axis Combination Charts in Tableau
Tableau dual-axis combination charts, or combo charts, are named that because they have two axes and they display a combination of different mark types. For example, you can create a visualization that displays a measure with bars on one axis and another measure as lines on the second axis. This is one of my favorite chart types to use in Tableau because the ability to add a second axis, and control the axes independently of each other, unlocks some additional flexibility. This newfound flexibility creates several practical applications that can be used to improve your analysis, user experience, and design.
![]()
This post will show you how to make a dual-axis combo chart in Tableau as well as three different ways to use them: (1) their traditional use (2) a method for making your end user part of the story and (3) an option for improving the aesthetics of your dashboard.
This content is excerpted from my book, Innovative Tableau: 100 More Tips, Tutorials, and Strategies, published by O’Reilly Media Inc., 2020, ISBN: 978-1492075653. Get the book at Amazon.

How to make dual-axis combination charts in Tableau
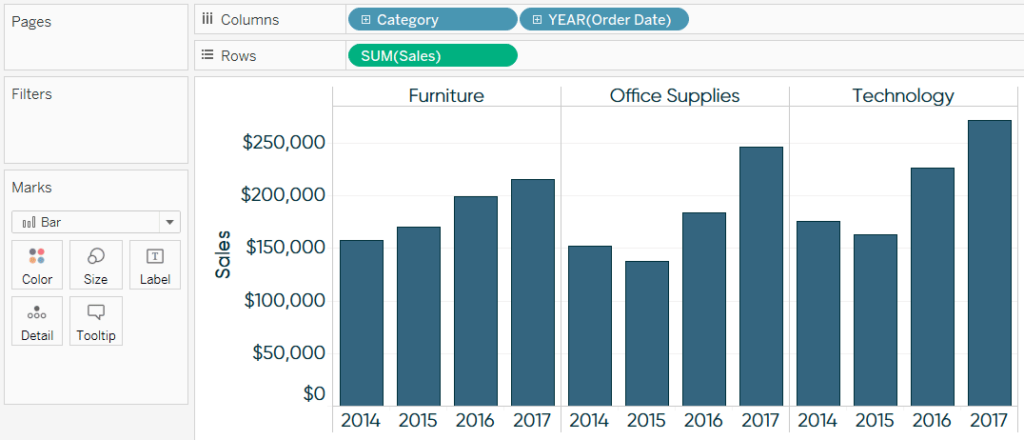
Let’s start by making a traditional dual-axis combination chart using the Sample – Superstore dataset. Even if this is familiar to you, I’ll be sharing a second approach that you may not know that will save you a click. This first chart will show sales by year as bars on one axis, and profit ratio by year as lines on the other axis; both measures will also be broken down by the Category dimension.
Continue reading with a free account, or login.
Unlock this tutorial and hundreds of other free visual analytics resources from our expert team.
Already have an account? Sign In
By continuing, you agree to our Terms of Use and Privacy Policy.
To begin, I like to create one of the charts, so I’ll start with Sales by Year by Category.
Next, place the second measure (in this case, Profit Ratio) on the Rows Shelf.
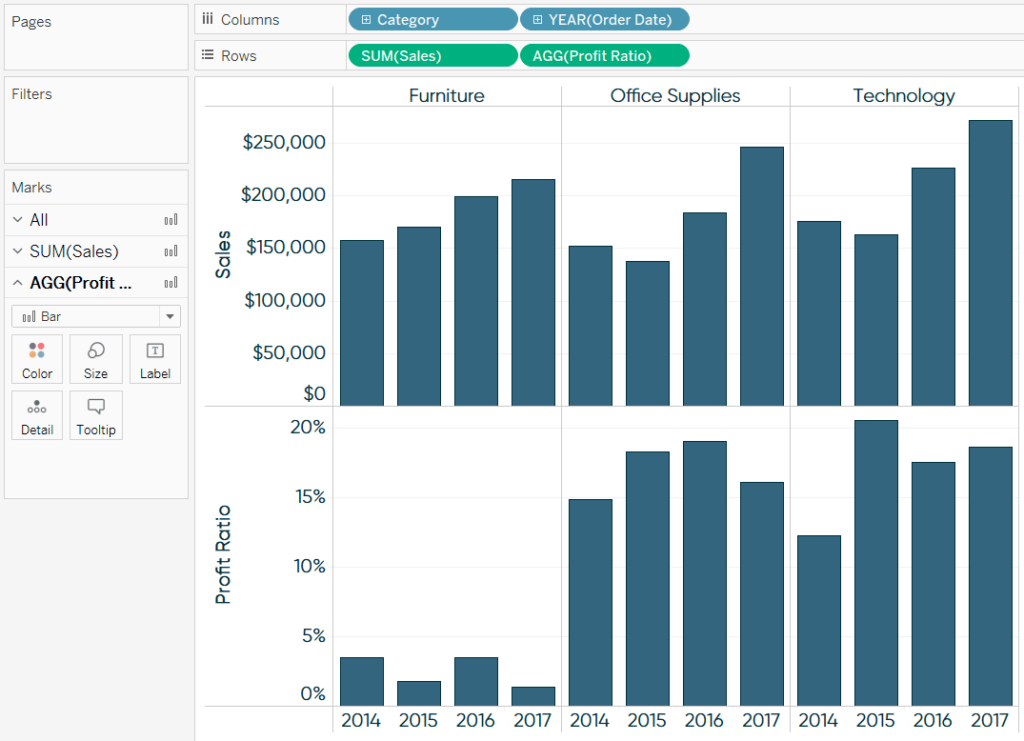
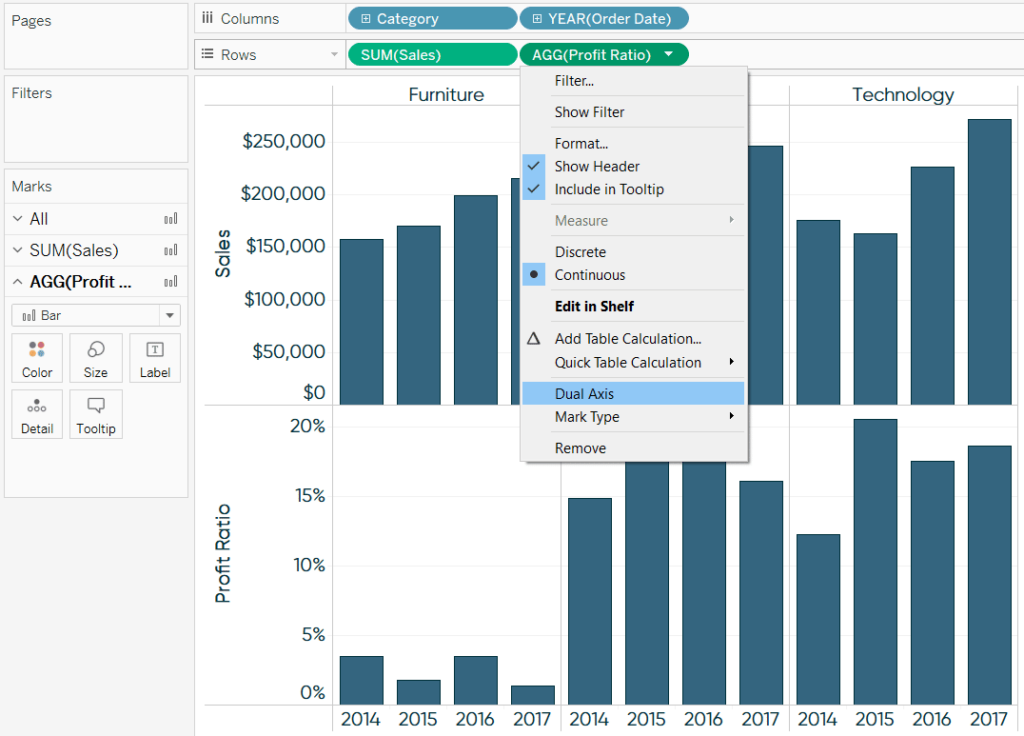
At this point, we have two individual bar charts on two rows. There are two ways we can convert these two separate bar charts into a Tableau dual-axis bar chart. First, and the way most people learn, is to click the second measure pill on the Rows Shelf, and choose “Dual Axis”.
The second, and slightly more efficient method, is to hover over the axis of the second row. While hovering, a green triangle will appear in the upper left-hand corner of the axis. You can left-click on the green triangle and drag it to the opposite axis of the left axis on the first row. When you hover over the right side of the chart, Tableau will show you a dashed line; this is where the axis will be drawn after releasing the left mouse key.
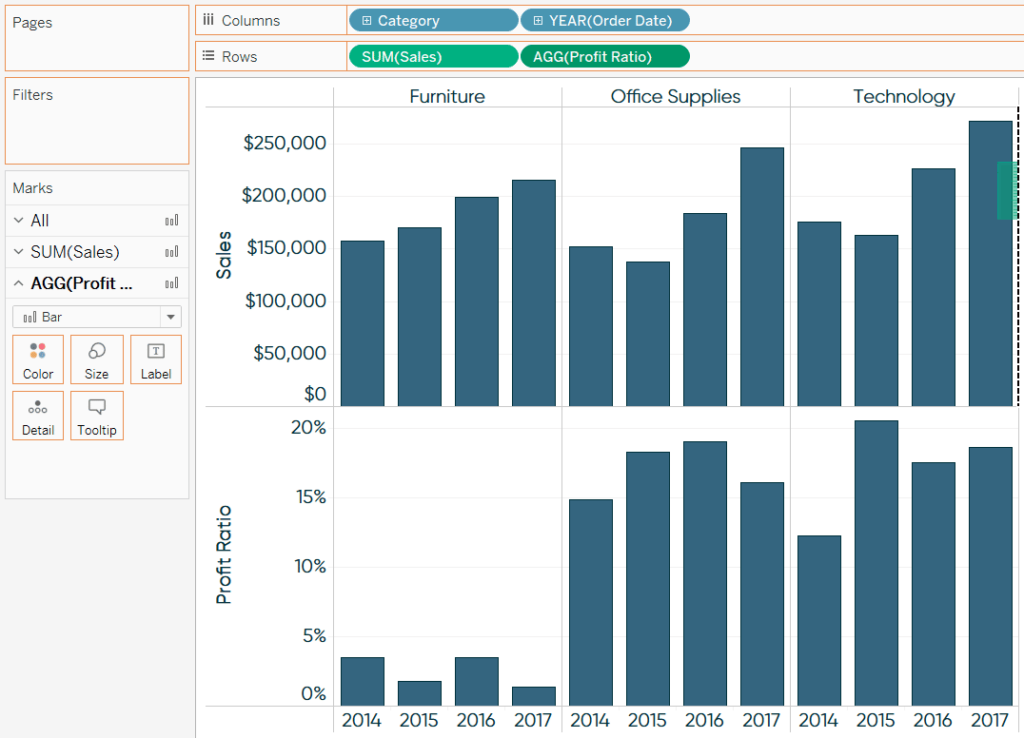
In both cases, we end up with a dual-axis bar chart.
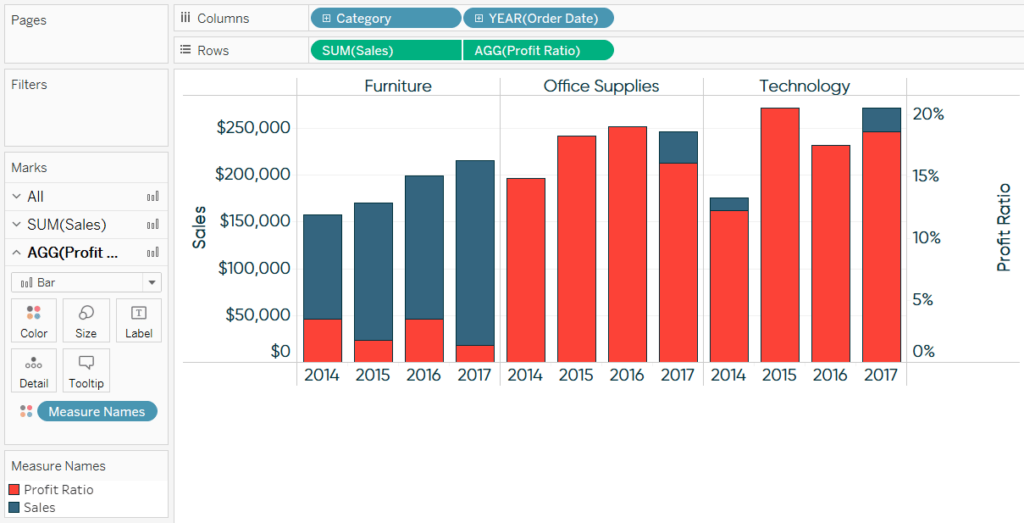
This isn’t quite a Tableau dual-axis combination chart because the mark type for both charts is bar, with the bars for profit ratio lying on top of the bars for sales. For a dual-axis combination chart, we need a combination of mark types. When you have more than one measure on the Rows Shelf and/or Columns Shelf, each measure gets its own Marks Shelf. This means you can edit the mark types for the measures independently of each other. Here’s how the final view looks after I change the mark type of the Profit Ratio measure from bar to line.
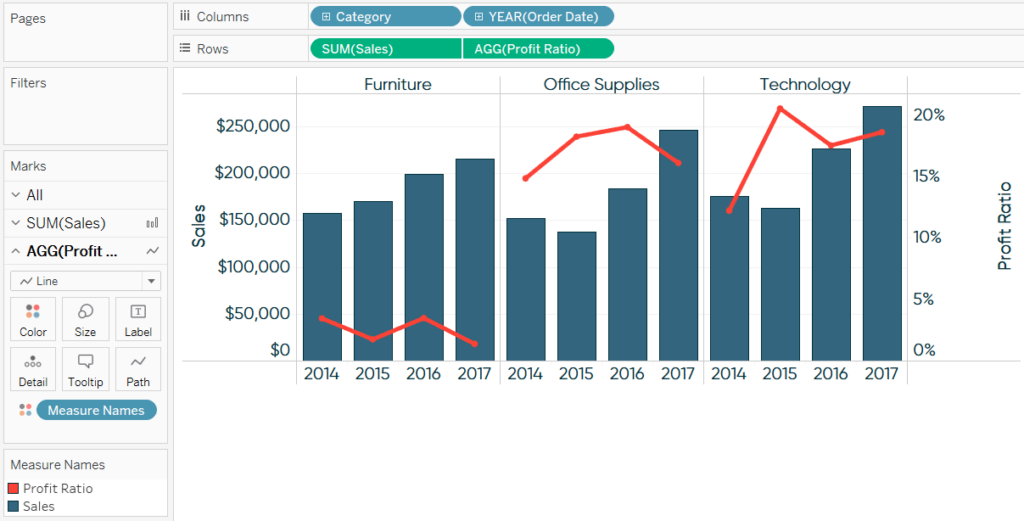
One word of caution when using the line mark type. Lines should only be used when there is a relationship between the data points over time or if they’re being connected by a continuous dimension / measure. Discrete fields are processed in their order on the Rows Shelf or Columns Shelf in Tableau. So for my example, sales and profit ratio are broken down by the Category dimension first, then the Year(Order Date) dimension second. That works, but what if we wanted to break the two measures down by Year(Order Date) first, then Category? Here’s how it looks:
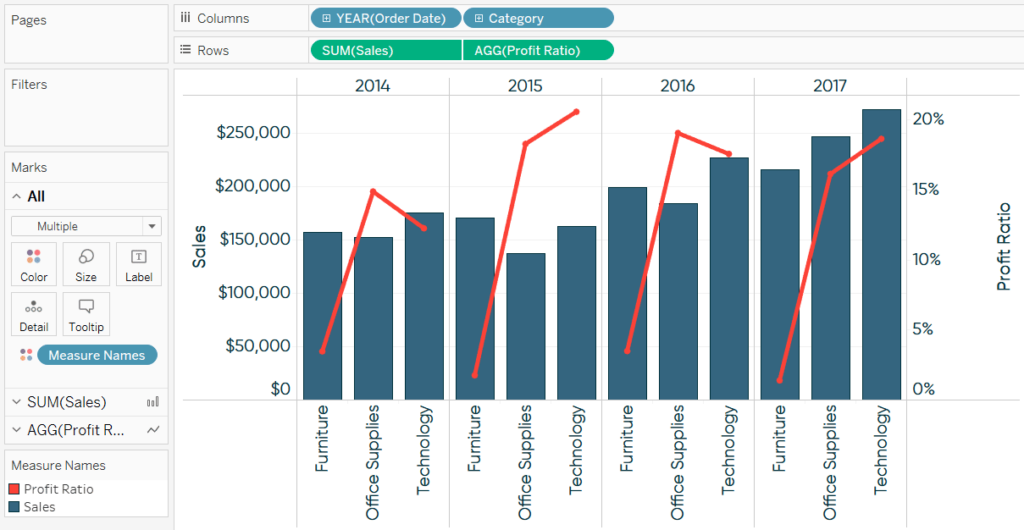
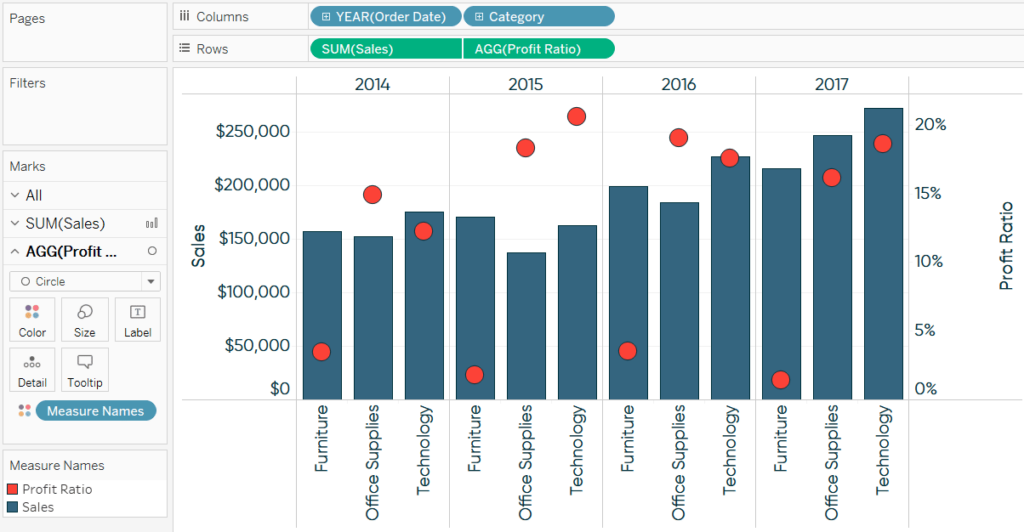
Note that we’re now connecting dots with lines for data points that are not related by time. If you’re ever in this situation, I suggest changing the mark type from line to circle to create a dot plot on the second axis.
Using a dual-axis combination chart to make your user part of the story
For my second way to use a dual-axis combination chart, we will be recreating a portion of my Tableau dashboard, How Does Your Household Income Rank?.
[Click image to view interactive version]
![]()
The visualization features a curve that shows how each household income ranks by percentile. This is a common “descriptive” view in that it describes high-level statistics. The real value comes by using the second axis to display where the person using the dashboard ranks on that curve. This makes the end user part of the story and is a much more engaging user experience.
To achieve this effect, I used a parameter built in Tableau that would allow the end user to choose any of the household income options between $2,000 and $450,000. After making the selection, in addition to the descriptive curve, the circle would move to the appropriate place based on the user’s selection. The label would also update with a caption telling the end user what percentile rank their household income is in.
This is a Tableau dual-axis combination chart. The curve for the left axis uses a mark type of line, and the circle is a second measure that only displays a circle for the end user’s selection on the right axis. The trick to getting just one circle to show up is a simple formula that computes whether the user’s parameter selection matches the household income value on the Y-axis. Here’s what it looks like:
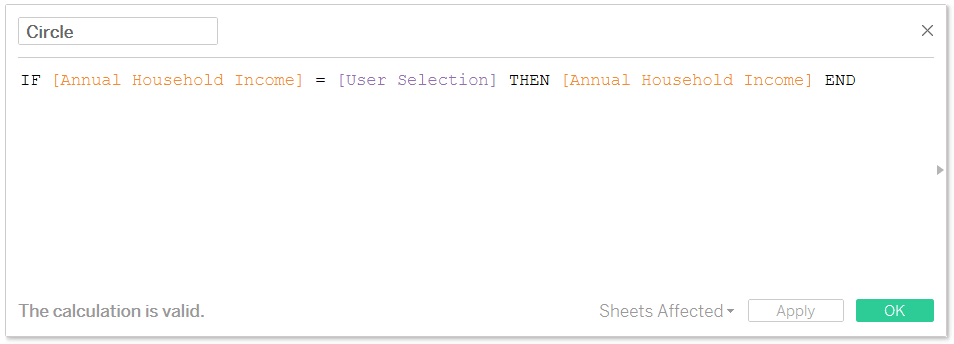
Once I had this calculation, I built the curve on the left axis and put the measure for the circle on the right axis.
![]()
To finalize the view, I synchronized the axes by right-clicking the axis for “Circle” and chose “Synchronize Axis”. This ensures the circle will always line up perfectly with the line on the opposite axis. Lastly, I hid the axis on the right by right-clicking on it and unchecking “Show Header”.
![]()
Two Types of Data Stories and Tactics for Handling Each
Improve the design of a line graph
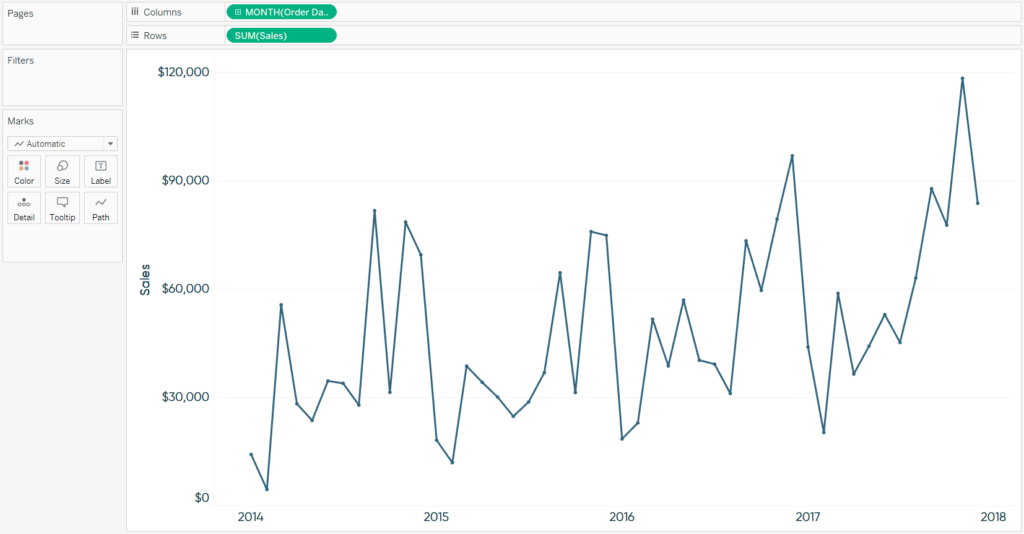
In my post, 3 Ways to Make Lovely Line Graphs, I provide a few recommendations for making traditional line graphs more engaging in Tableau. One of those approaches involves a dual-axis combination chart; here’s how it’s done. Say you have a line graph showing a sales by month trend:
Now I’ll put the Sales measure on the right axis, synchronize the axes, and change the mark type for the second axis to Area.
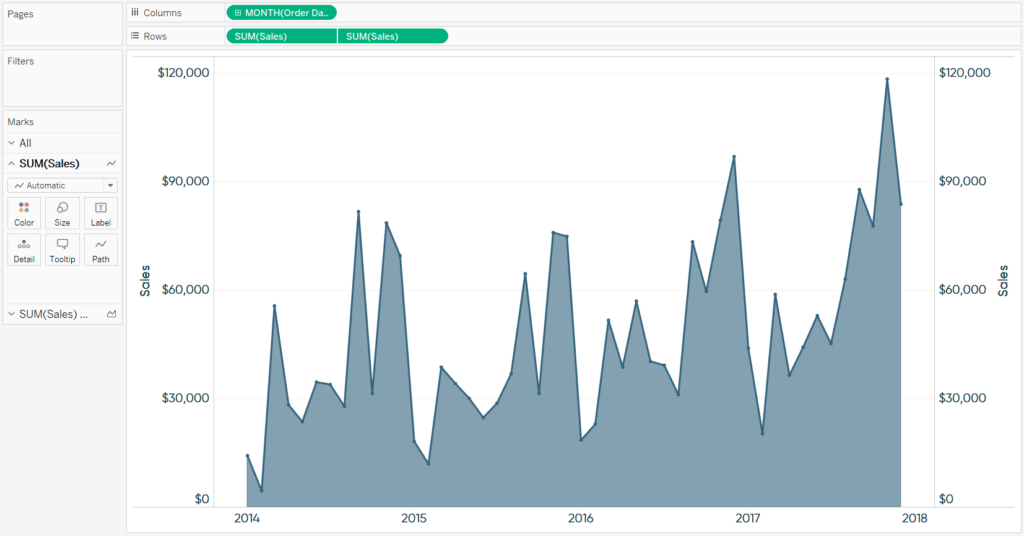
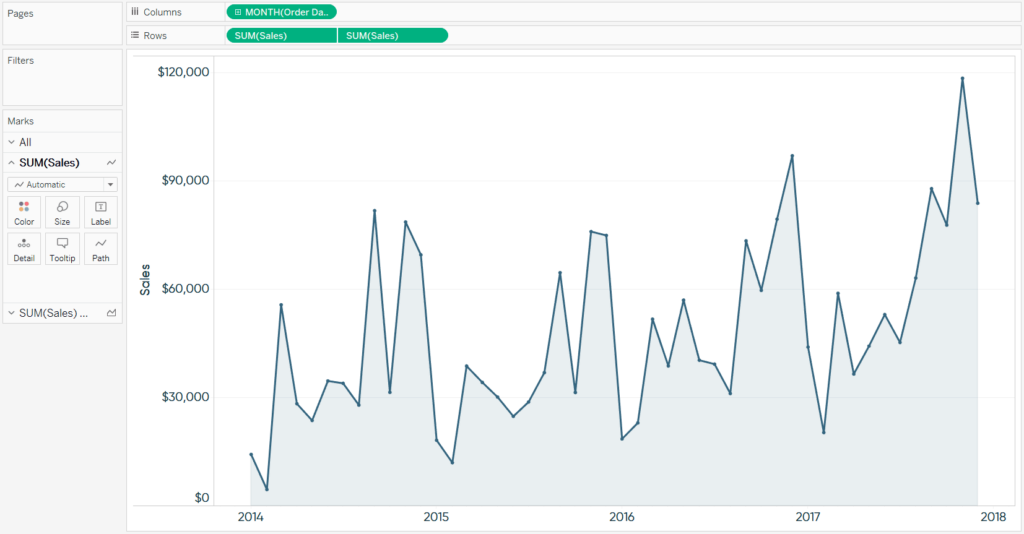
At this point we have a dual-axis combination chart with sales by month as a line graph and sales by month as an area chart. To finalize the view, I will hide the right axis and reduce the opacity of the area to 10%.
You can only use the second axis for one purpose at a time, but if you are not using it for one of the first two reasons above, this third application can be an easy way to enhance your traditional line graphs.
Thanks for reading,
– Ryan


Written By
Ryan Sleeper
Related Content

Ryan Sleeper
Cementing line graphs as a top choice for your Tableau data visualizations by making them more engaging This video shares…
3 More Ways to Make Lovely Line Graphs in Tableau

Tableau line graphs are one of the most widely used visualizations on dashboards today – it’s hard to beat a…
Ryan Sleeper
When we know the outcome vs. making our user part of the story Did you know there are two types…