Beginner’s Guide to DAX: Creating Calculated Columns and Measures in Power BI

When building a report from scratch in Power BI Desktop, one of the most common questions you can ask yourself is, should I create a calculated column, or a measure? The correct answer is (as usual), it depends. Before deciding on which one to use, why would you create a measure or calculated column in the first place?
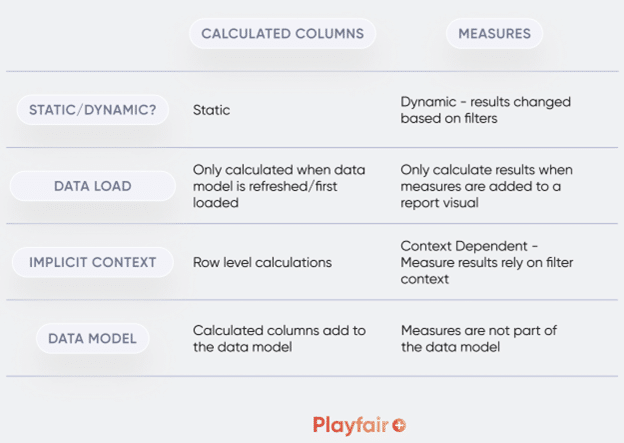
Measures and calculated columns are essential for in-depth analysis in your reports. Without them, it can be difficult to find useful insights and create useful reports. In this blog, we’ll discuss background info, the differences between measures and calculated columns, and some advantages and disadvantages of each.
FAQs answered in this post:
What is the difference between filter context and row context in DAX?
Filter context includes all active filters from slicers, the Filters pane, and visual elements that determine which data rows are evaluated before calculations run. Row context enables DAX to evaluate formulas at the individual row level, automatically iterating through each row of a table. Calculated columns have inherent row context, while measures rely on filter context and require iterator functions like SUMX to force row-by-row evaluation.
When should I create a measure instead of a calculated column in Power BI?
Create measures for dynamic aggregations that change based on filter context, like totals, averages, or percentages that need to respond to slicers and visual interactions. Measures don’t store data in your model, making them memory-efficient and reusable across multiple visuals with different contexts. They’re ideal for calculations that require aggregation functions like SUM, AVERAGE, or COUNT, or when using iterator functions like SUMX for row-level calculations within aggregations.
When should I create a calculated column instead of a measure in Power BI?
Create calculated columns when you need static row-level values that persist in your data model, such as categorizations, text concatenations, or calculations like Units Sold multiplied by Sale Price. Calculated columns are computed during data refresh and store individual values for each row, making them useful for filtering, grouping, or referencing specific row data. However, they increase model size, so avoid them for simple aggregations that measures handle more efficiently.
What are iterator functions in DAX and when do I need them?
Iterator functions like SUMX, AVERAGEX, and COUNTX force measures to evaluate formulas row-by-row before aggregating results, adding row context to measures. Use them when your measure needs to perform operations on columns before aggregating, such as calculating total sales by multiplying Units Sold times Sale Price for each row. Without iterators, measures using simple SUM or AVERAGE aggregate entire columns first, producing incorrect results for row-level calculations.
How do calculated columns and measures impact Power BI report performance?
Calculated columns increase data model size since they store values for every row, but compute during refresh rather than query time. Measures calculate dynamically when displayed in visuals, consuming no storage but potentially impacting performance when too many complex measures load on one page. Break complex measures into smaller components, use measures for aggregations to minimize model size, and reserve calculated columns only for static row-level data you need to filter or group by.
How can Playfair Data help our team master DAX in Power BI?
Playfair Data offers comprehensive Power BI training covering DAX fundamentals including evaluation context, iterator functions, calculated columns versus measures, and performance optimization. Our experts teach best practices for efficient DAX formulas and scalable data models. Schedule a strategy call to learn how our Flagship Power BI workshops and Engineering Fundamentals credentials can accelerate your team’s DAX proficiency and analytical capabilities.
Background info: Evaluation context
Before we begin discussing the differences between calculated columns and measures in Power BI, we have to learn about context. Learning about evaluation context will help us understand some major differences between calculated columns and measures. Evaluation context in Power BI is made up of filter context and row context.
Filter Context
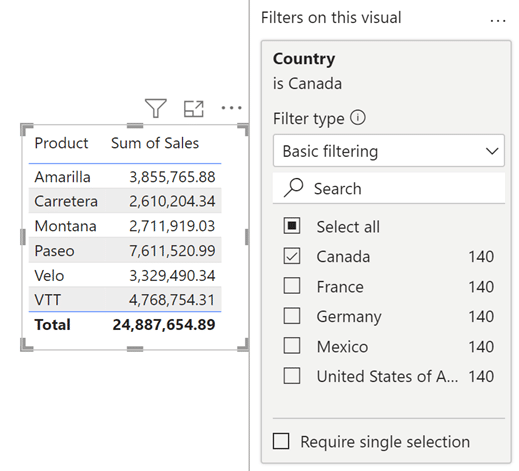
Filter context is the set of filters applied to the data prior to a formula being evaluated in Power BI Desktop. This includes slicers, the filters pane, and rows and columns in table visuals. Measures yield different results for each row because the context is different in each row. In the below image, the filter context for the fourth row of the Sales column is made up of the Country (Canada) filter in the Filters pane and the corresponding fourth row in the Product column (Paseo).
Row Context
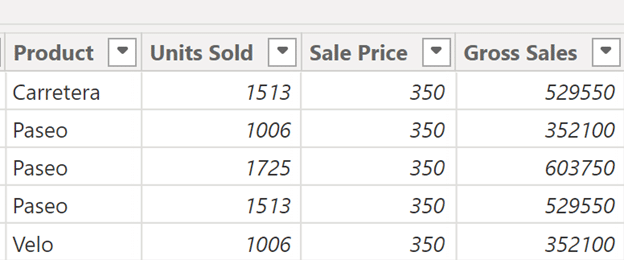
Row context is what enables Power BI to calculate a formula at the row level. In a table, a formula is evaluated for each row. In the table view, we can see that Gross Sales are calculated in every row by multiplying the Units Sold and Sale Price columns.
Calculated columns have inherent row context, but measures do not. However, you can force a measure to iterate row by row using DAX; more on this later!
Creating measures in Power BI Desktop
Measures are dynamic calculations that can be applied to many situations, and will change based on the filter context they are computed in. Let’s create a measure in Power BI Desktop. First, open up a new Power BI Desktop report and load the Financials sample data by clicking on the Use sample data tile.

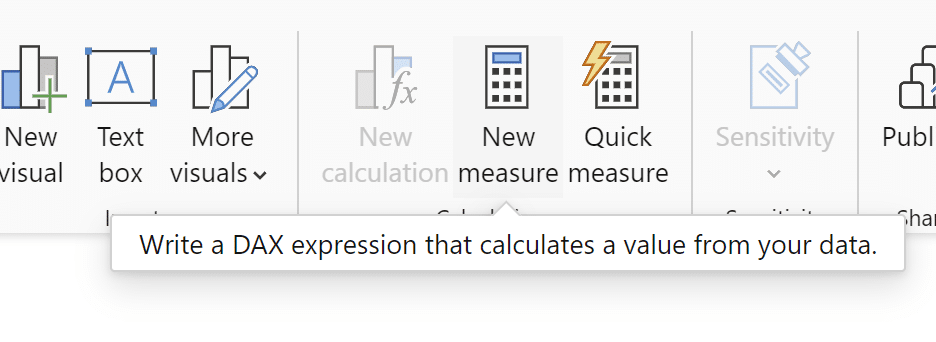
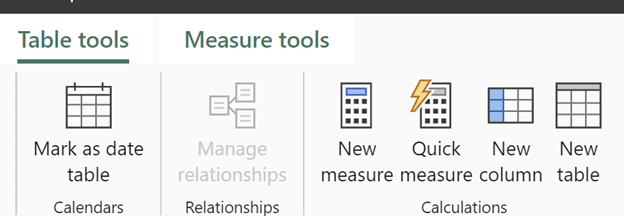
Let’s create a measure to find the total Sales from the VTT product. From the Home tab, click on New measure in the Calculations tab. Another way to create a measure is from the Data pane, by right clicking your table name and selecting New measure.
Once the dialog box opens, let’s name our measure VTT Sales and write the following DAX formula:
VTT Sales = CALCULATE(SUM(financials[Gross Sales]), FILTER(financials, financials[Product] = “VTT”))
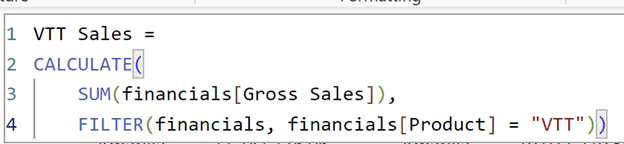
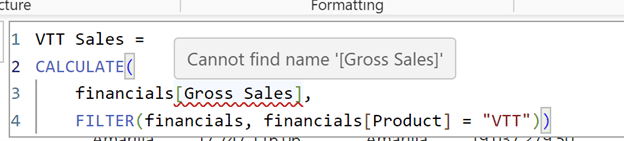
There are other ways to perform this calculation, but for simplicity, we will use the above DAX. Notice that we used the SUM() function. When creating a measure, you need to instruct DAX to use an aggregation before referencing an item (like the Gross Sales column) from the data pane. If you were to simply write CALCULATE(financials[Gross Sales]), you would notice that DAX’s autocomplete won’t fill in, indicating an error in your DAX code.
Since measures are computed when a measure is displayed on a report page, they do not have an implicit row context, like calculated columns do. A measure dynamically changes based on the visual it is used in, so without an iterator function (a function that performs the formula for every row of a table in the function that usually ends in X), the only context that affects a measure is filter context. Any slicer, active filter, or visual affects how a measure is computed. Iterator functions force measures to have row context. Keep this in mind when we create this second measure below.
An Introduction to the Power BI Power Query Editor
Let’s create a new Gross Sales measure, by multiplying the total units sold by the sale price. We’ll check our measure by comparing it to the Gross Sales column from the Financials dataset.
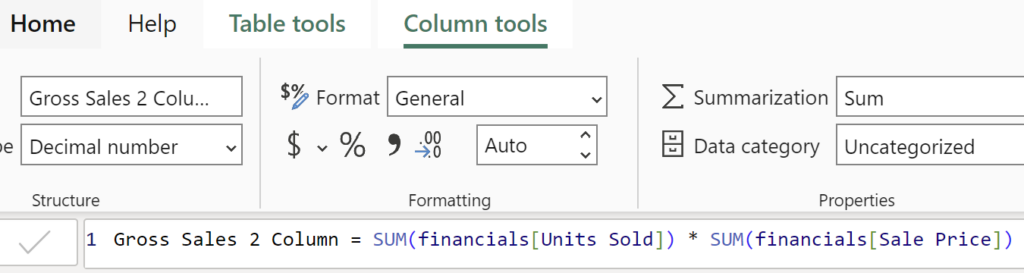
Gross Sales 2 = SUM(financials[Units Sold]) * SUM(financials[Sale Price])
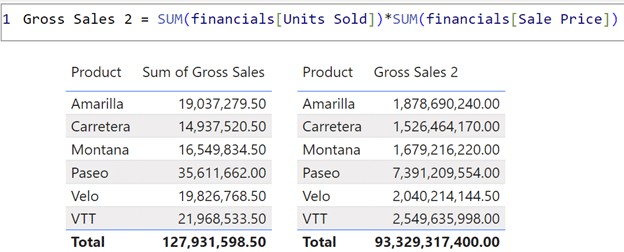
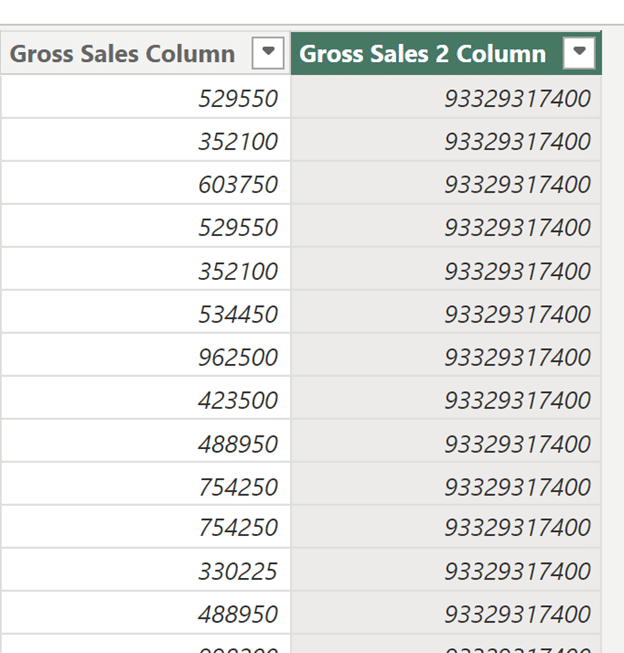
Our Gross Sales 2 measure should be matching our values on the left hand side. What happened? Our measure is incorrect because our measure does not have any implicit row context.
The Gross Sales 2 measure computed the total number of units sold and multiplied that by the total sale price. If this measure worked correctly, the calculation of Units Sold * Sale Price would have happened for every single row, and then aggregated in the visual after each row calculation was performed.
Now, we’ll rewrite Gross Sales 2 using the iterator function, SUMX:
Sales 2 = SUMX(financials, financials[Units Sold] * financials[Sale Price])
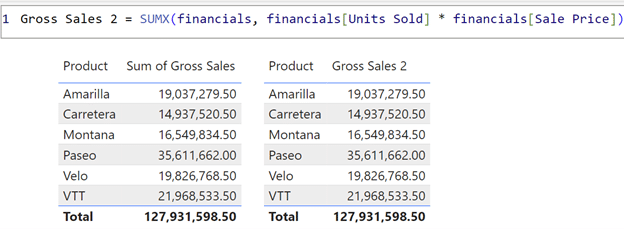
Now that we’ve forced row context into our Gross Sales 2 measure, our numbers match the Sum of Gross Sales column from the Financials dataset. This example illustrates the main difference between measures and calculated columns. Measures do not have row context, so to use them in a way that requires row context, you need to force them to manually calculate row by row.
Creating a calculated column in Power BI Desktop
Next, I’ll show you how to create a calculated column. First, navigate to the table view, which will help illustrate the differences between calculated columns and measures in Power BI. First, look for the VTT sales and Gross Sales 2 measures in table view. Where are they? Measures are not stored in the original data model, so they can’t be viewed here. Since they aren’t computed until they are used in a visual or on a report page, they don’t have individual row values like columns do.
Now in the table view, click on New column.
We’re going to write the same Gross Sales measure, but this time we’re creating a column.
Continue reading with a free account, or login.
Unlock this tutorial and hundreds of other free visual analytics resources from our expert team.
Already have an account? Sign In
By continuing, you agree to our Terms of Use and Privacy Policy.
Gross Sales Column = financials[Units Sold] * financials[Sales Price]
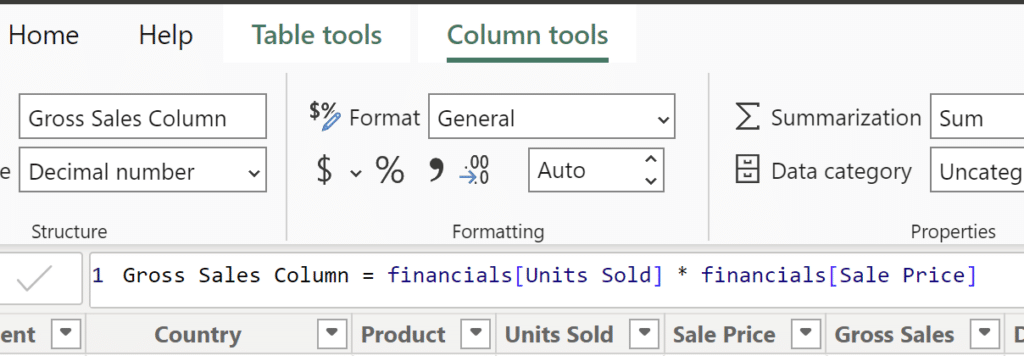
Notice that when you start to type Units Sold, DAX’s autocomplete works without you having to write an aggregation like SUM before the column, like you would with a measure. Since calculated columns perform the operation, Units Sold * Sale Price row by row, the gross sales column we created yields the same result as the original Gross Sales column.
An Introduction to Parameters in Power BI
You can force an aggregation in a calculated column if you’d like, but doing so results in the same incorrect value for each row in the column, the same error as our incorrect Sales measure from before.
Now, if your intention was to have the same value for every row in the column, create a new calculated column and write Gross Sales Total = SUM(financials[Gross Sales]).
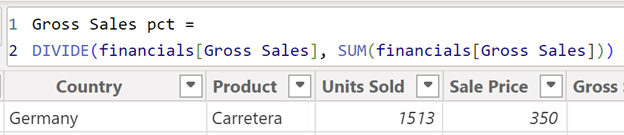
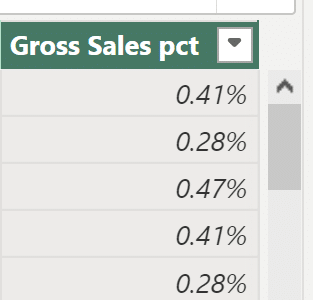
This will give you the correct Total gross sales value. This could be useful if you wanted to determine something like the percentage of gross sales each row makes up. But for this, you can skip the Gross Sales Total Column and just create a percentage of total column, writing:
Gross Sales pct = DIVIDE(financials[Gross Sales], SUM(financials[Gross Sales]))
Pros and cons of columns and measures
Now that we’ve talked about context and DAX-specific differences between calculated columns and measures in Power BI, let’s discuss the main advantages and disadvantages of each.
Pros and cons of measures
Pros:
- Reusability/Context: Since measures are dynamic, measure results change based on the context they’re computed in. This means the same measure can be reused multiple times and have different results.
- Storage: Measures don’t affect your data model; they only exist when they are used in a visual on your report page.
Cons:
- Use in moderation: Too many measures on the same report page can impact performance. Measures that are very complicated can also impact performance. Break up your measures into smaller measures if you need to!
- Context: Yes, context is a pro and a con for measures. If you see results or totals that don’t look right, check your filter context!
Pros and cons of calculated columns
Pros:
- Row-level data: Calculated columns store individual row values which can be useful when referencing specific values in your analysis.
- They are static: Row values will always stay the same.
Cons:
- Row-level data: Calculated columns aren’t the best at aggregations.
- Storage: Calculated columns can increase the size of your data model. BUT, since they are computed when the data is loaded/refreshed, they can improve performance when compared to measures that load individually when used in visuals.
At the end of the day, the better choice between the two is what suits your needs and use case best. Both calculated columns and measures in Power BI are extremely powerful tools, but without learning the differences between the two, it can be hard to use them appropriately in your reports. I hope this blog has cleared up some of the confusion around the choice between measures and calculated columns in Power BI Desktop.
Thanks for reading,
Juan Carlos Guzman

Written By
Juan Carlos Guzman

Peer Review
Matt Snively
Sr. Manager, Analytics Engineering
Related Content
Beginner’s Guide to DAX in Power BI: Creating a Date Table
In the same way that you can’t bake a cake without flour, you can’t use Power BI Desktop without Data…

Ryan Sleeper
Dimension filters, measure filters, discrete date filters, and continuous date filters Create relevant analyses by keeping or excluding marks on…
3 Ways to Make Beautiful Bar Charts in Power BI
Despite many new challengers over the years in the world of data visualization, bar charts have remained one of the…