An Introduction to Parameters in Power BI

Parameters are user-generated values that define how a system can operate. We can use parameters in Power BI to grant users control over visuals in a report, breathing new life into them in the process by making them interactive. You can create and/or interact with parameters in Power BI Desktop and in Power Query. In Power BI Desktop, there are two types of parameters: Numeric parameters or field parameters. Numeric parameters allow users to set specific ranges to filter their data. Field parameters allow users to change the measures analyzed in a report.
Creating a numeric parameter in Power BI Desktop
For this tutorial, we’ll be using the Adventure Works dataset. Connect to this Excel workbook using Get Data → Excel Workbook → Select the Adventure Works file in your downloads.
Continue reading with a free account, or login.
Unlock this tutorial and hundreds of other free visual analytics resources from our expert team.
Already have an account? Sign In
By continuing, you agree to our Terms of Use and Privacy Policy.
How to Connect to Data in Power BI Desktop
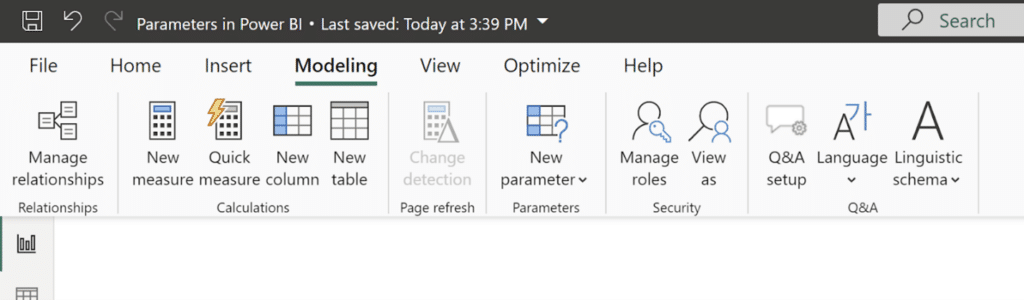
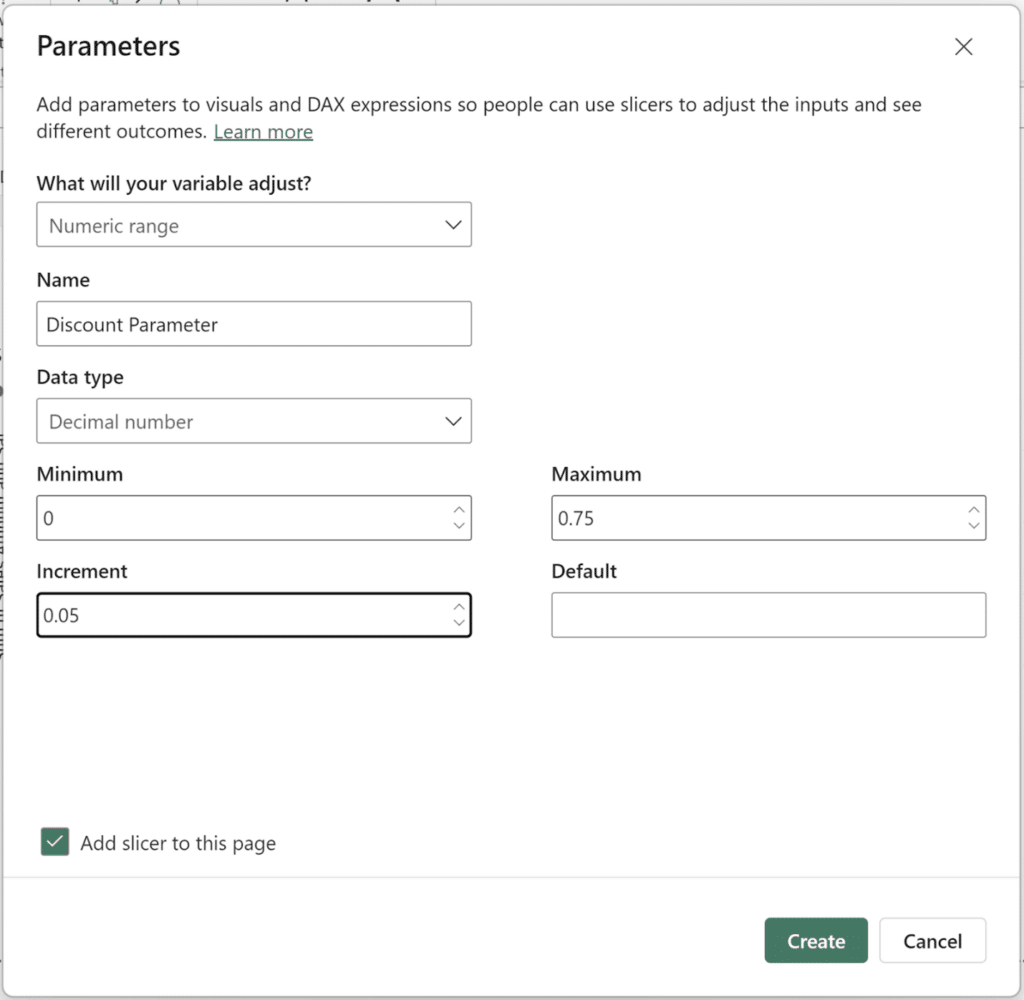
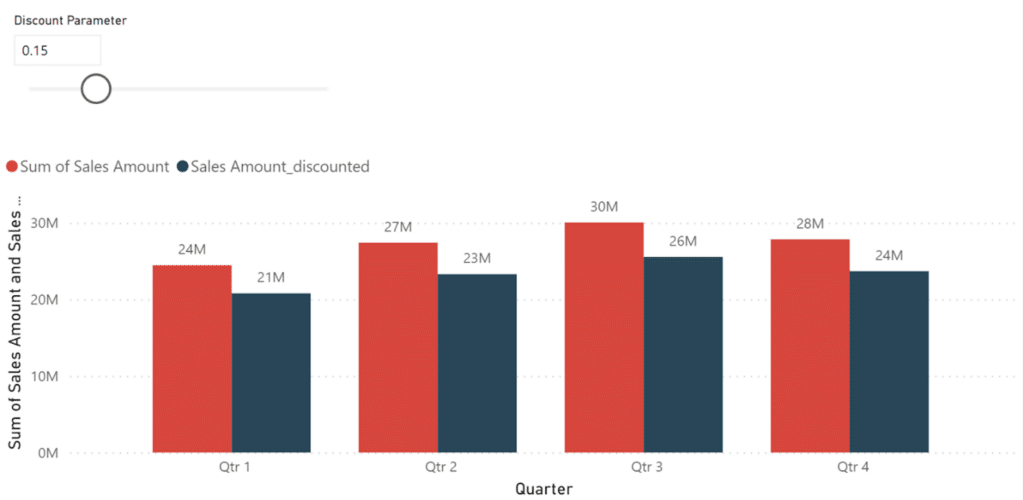
Click on the New Parameter card and then click on Numeric Range in the dropdown. Let’s use a parameter to compare product sales with discounts. Name your parameter ‘Discount Parameter’ and change the Data type to ‘Decimal number’. Set the Minimum to 0, Maximum to 0.75, and Increment to 0.05. If you want a slicer to be added to your page with your new parameter, keep the ‘Add slicer to page box’ checked.

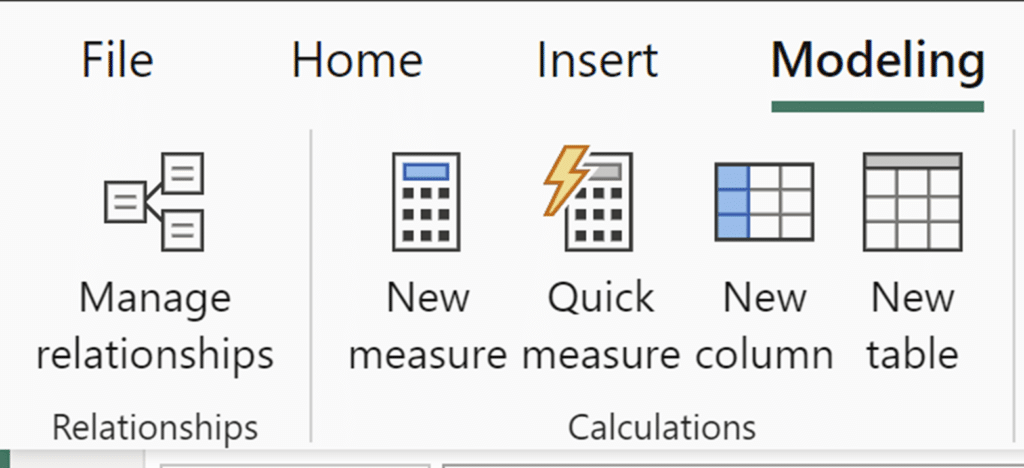
Now hit Create to have the parameter slicer apply to your current report page. Notice that the parameter now exists in the Data Pane. This is where we’ll drag the field from to populate our visuals. Now, create a bar chart visual with Sales (after creating this measure) on the Y-axis and Product on the X-axis. Try different values in your parameter and see what happens to your visual. Regardless of your parameter selection, your visual won’t change. This is because to connect our parameter to our visuals, we first need to create a custom measure that references the parameter. To create a new measure, click the ‘New measure’ tile in the Home or Modeling tabs.
Once you click on New measure, a popup window will appear at the top of your screen where you are able to use the DAX language to create a custom measure. We will use the following formula for our Sales Amount_discounted measure:
Sales Amount_discounted = SUM(Sales[Sales Amount]) – (SUM(Sales[Sales Amount]) * ‘Discount Parameter’[Discount Value])
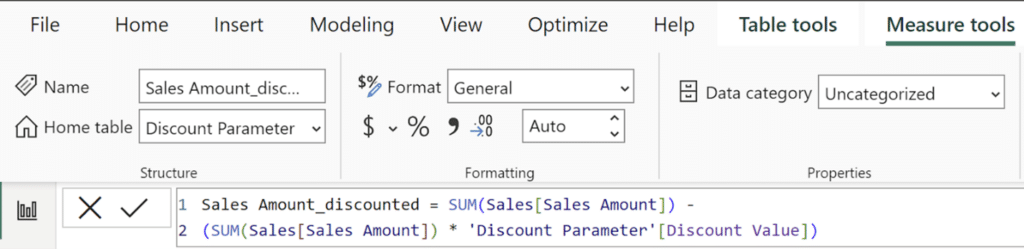
This measure will link our parameter with our bar chart visual and will update when changes are made within the slider.
Creating a field in Power BI Desktop
In the Modeling tab, click on ‘New parameter’ and then click on ‘Fields’ in the dropdown. Name it Field Parameter and drag in the Category, Subcategory, Model, and Product fields. Like before, leave the ‘Add slicer to this page’ box checked and click on Create.
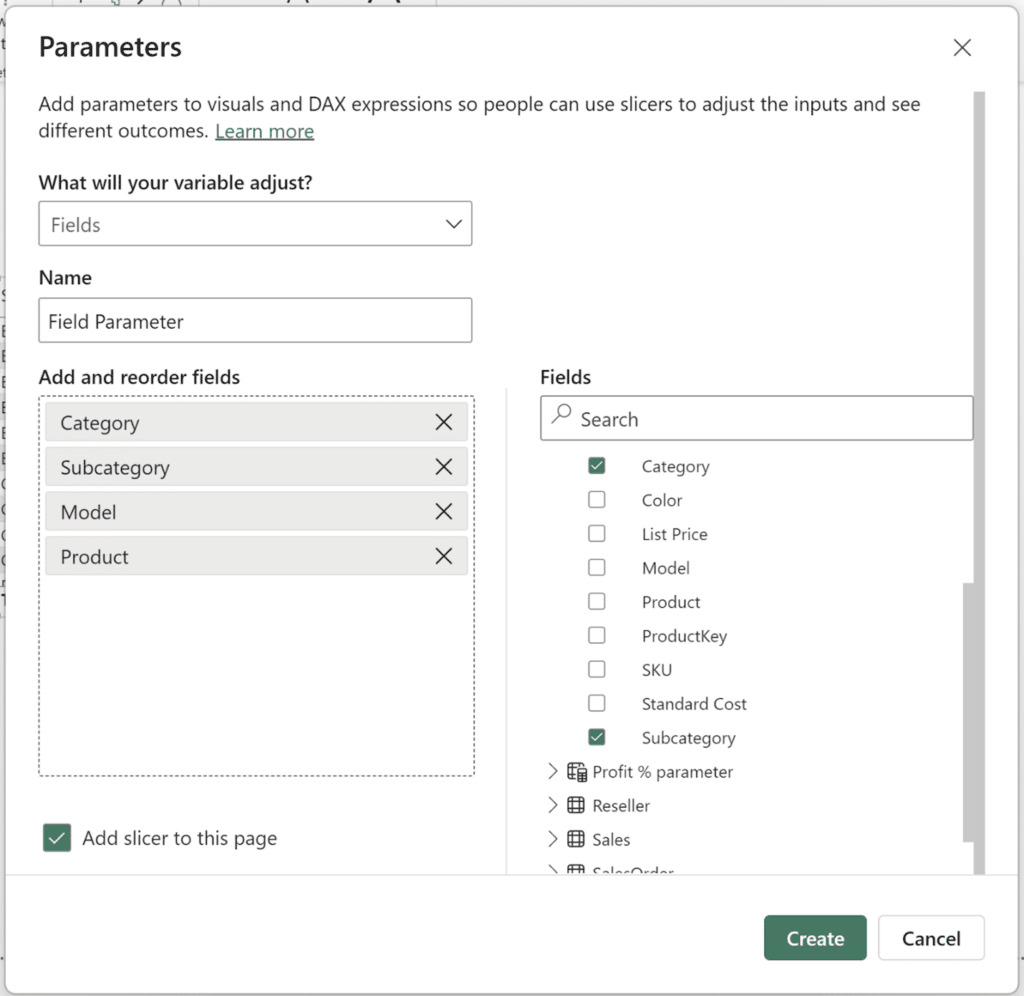
Since the data in this slicer isn’t numeric, you’ll see the slicer populate as a checklist.
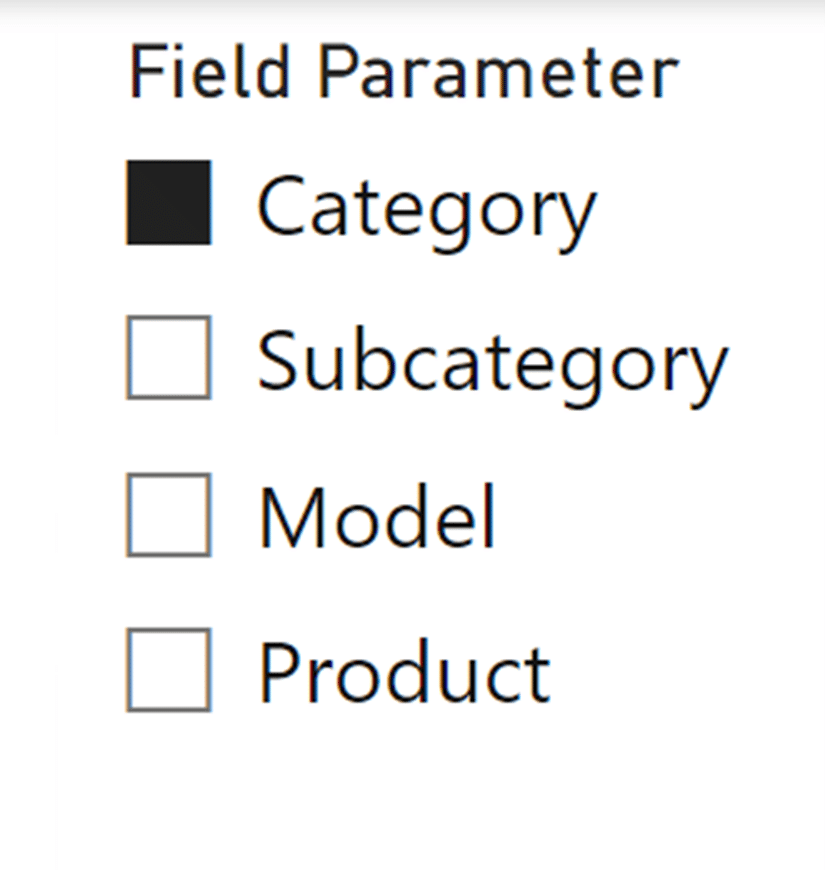
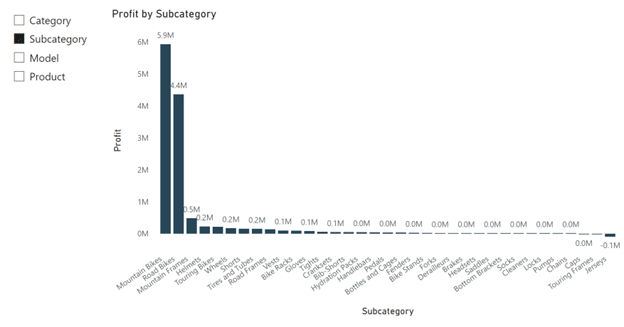
Now let’s add a column chart to our report page. For our x-axis, drag in the Field Parameter field from the Data pane. In the y-axis, drag in Profit. With no selection in our parameter, the visual should default to the first field in your field parameter. In our case, this is the Category field.
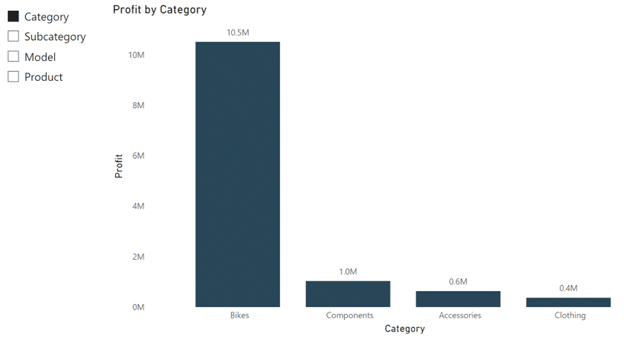
Field parameters in Power BI are a little easier to create than numeric parameters, since you don’t have to create a custom measure to actually use the parameter, they automatically use the fields in your data.
Editing your field parameters
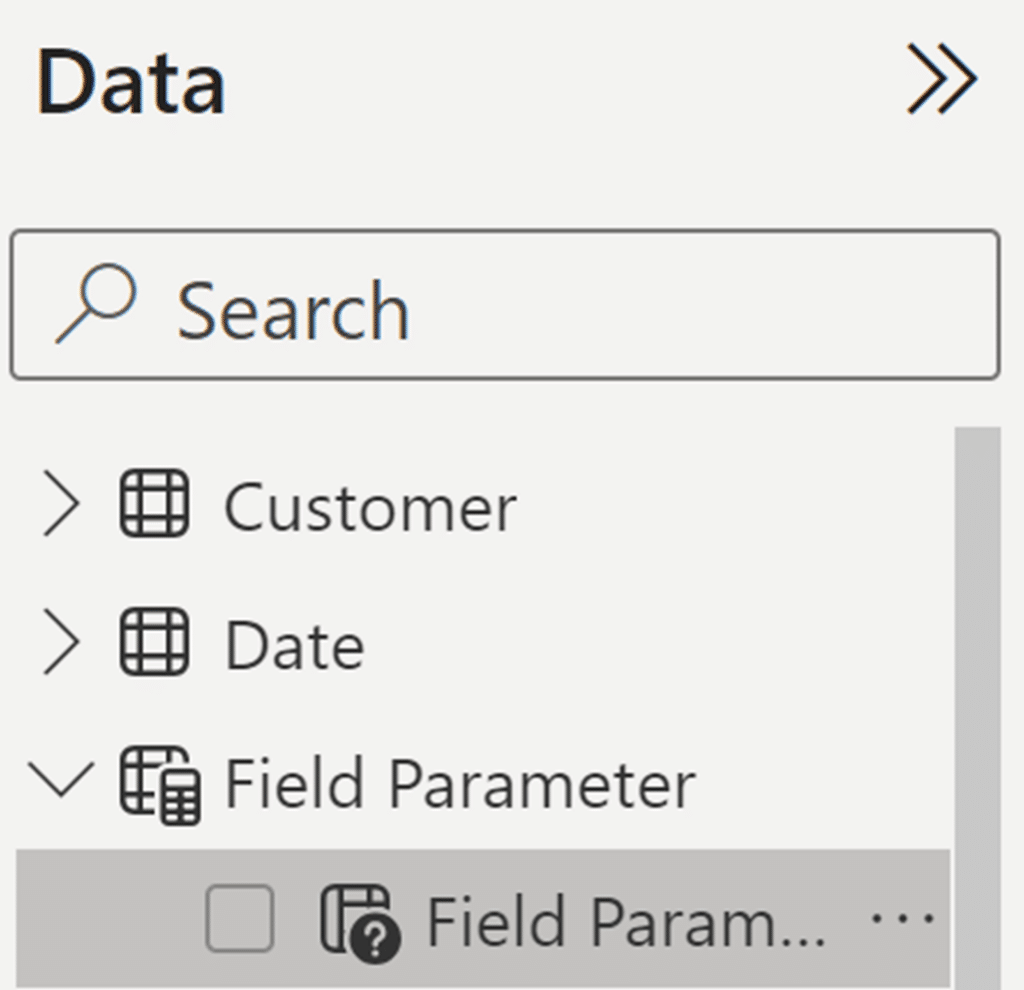
Let’s say we forgot to add the Color field from the Products table to our field parameter. To edit your parameter after it has been created, expand your Field Parameter in the Data pane and click on the measure in your field parameter.
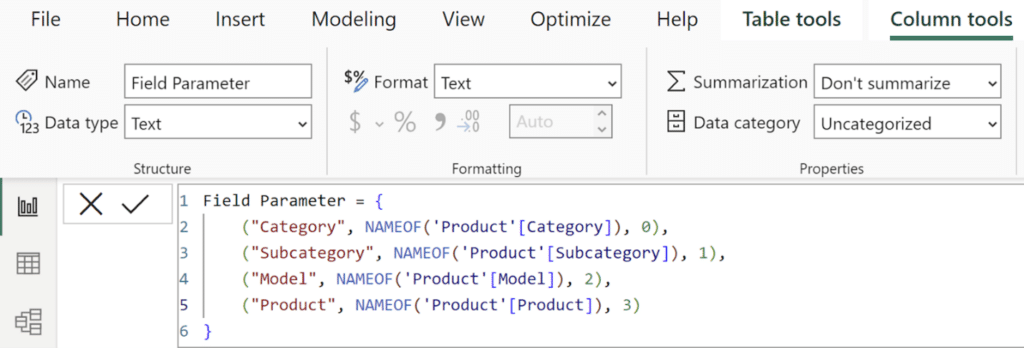
Once you do so, the DAX for that Field Parameter column will appear at the top of your screen. Now we follow the formatting and add the Color field.
The parameter column structure is:
(“Name of column in the parameter”, NAMEOF(‘table’[Column]), order)
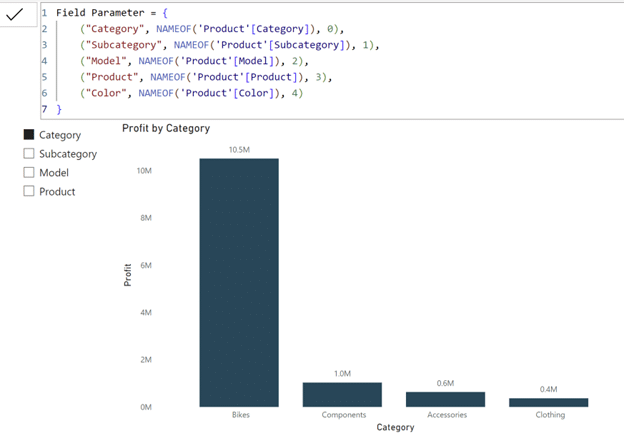
Let’s say I would like to add color as a fifth option. Before I hit Shift+Enter to create a new line under the Product line, I add a comma to the Product line since it is no longer the last line in the code. Then I insert the Color line with the same syntax as the first four options. Once I hit enter, the slicer automatically updates to include the new column.
You can add, remove, reorder, and rename your parameters in your slicer in this DAX window.
Thanks for reading the basics of using numeric and field parameters in Power BI Desktop!
Juan Carlos Guzman

Written By
Juan Carlos Guzman

Peer Review
Maddie Dierkes
Manager, Decision Science
Related Content
An Introduction to the Power BI Power Query Editor
With the Power BI Power Query Editor, the data engineering world is at your fingertips. You can shape data to…

Matt Snively
Create dynamic and flexible Power BI reports In this video, you will learn about using parameters and DAX in Power…
Nested Parameters in Power BI Desktop
Parameters are a great way to customize your Power BI Desktop reports. Using parameters in your reports allows users to…