How to Account for Leap Year in Tableau
Brace yourselves – 2024 is a leap year! Here are a few strategies to keep your Tableau workbooks accurate this February. This year will have 29 days in February instead of 28, which is a 3.6% increase in time. When we make year over year comparisons, some measures will be artificially inflated. In this tutorial, I will show you three methods to account for the 3.6% increase in time caused by leap year in Tableau.
Account for leap year in Tableau with annotations
Ratios and averages, like Profit Ratio and Daily Visits, automatically account for the extra leap year day. Summed measures, like Profit and Sales, may be amplified by the extra day. The easiest way to account for this is to add an annotation to your report.
![]()
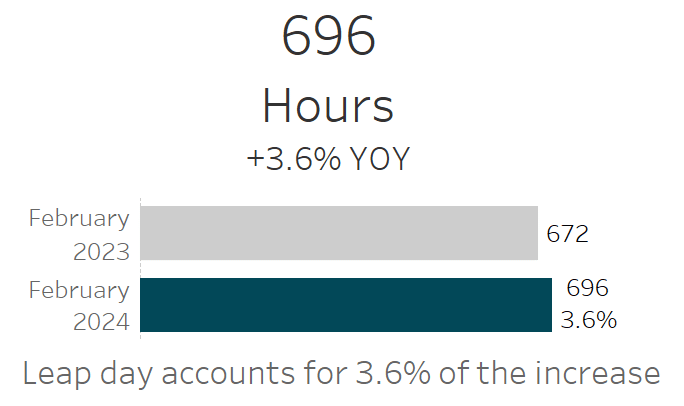
In the screenshot below, I’ve plotted the YOY hours for February. The chart shows that February 2023 had 672 hours, while February 2024 has 696 hours – a 3.6% increase! It also includes an annotation explaining that we can expect a 3.6% increase in hours on account of Leap Day. A simple annotation reminds users that a February shift could be partially attributed to leap year.
Continue reading with a free account, or login.
Unlock this tutorial and hundreds of other free visual analytics resources from our expert team.
Already have an account? Sign In
By continuing, you agree to our Terms of Use and Privacy Policy.
Practical Tableau: 3 Ways to Add Alerts to Your Dashboards
Use daily averages
The next solution for wrangling additive measures in YOY comparisons is replacing the monthly total with a daily average. In the example below, I’ve taken the chart from before and converted Total Hours to Avg Daily Hours.
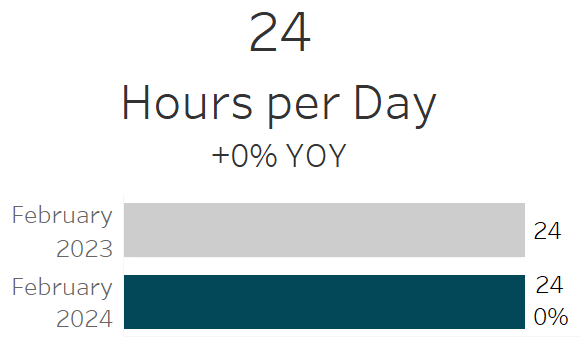
Obviously, this version does a much better job of controlling for leap year in Tableau! Now we immediately see that both years averaged 24 hours per day. To do this, first I used Include to create a daily total. { INCLUDE [Date] : SUM( [Hours] ) } Then in the view I aggregated the calculated field using AVG() instead of SUM().
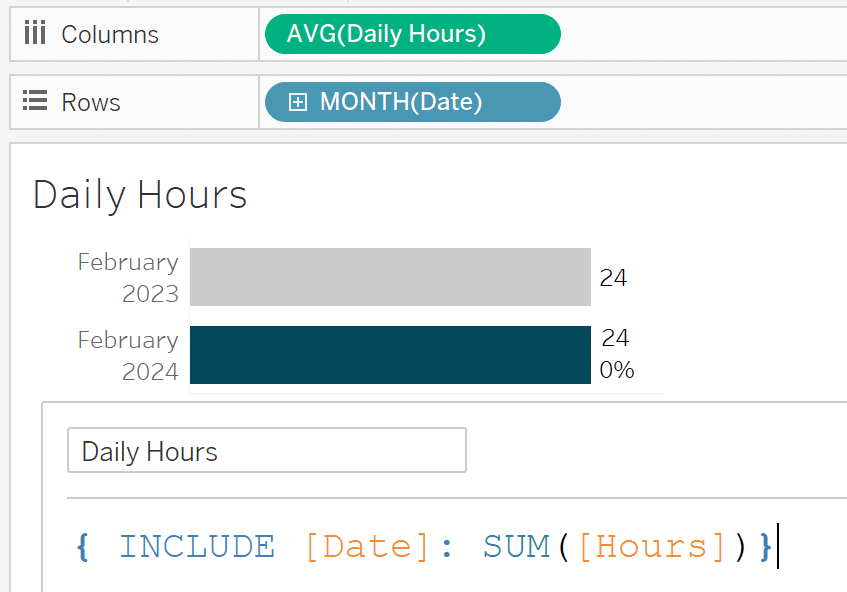
Tableau Fundamentals: An Introduction to Level of Detail Expressions
Use Day of Year to align weekdays
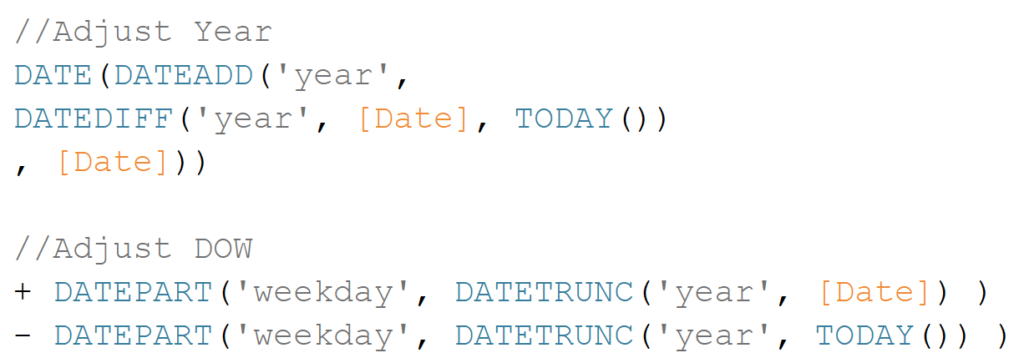
If your data has strong weekday seasonality, you probably plot weeks year over year. In a standard year, it makes sense to take your original dates, add years to bring it into the current year, and then add days to adjust for day of week. There are a few ways to do this. A basic way is to check the year value and add 364 days to the prior year. A more resilient method computes the year adjustment and day of week adjustment needed for each date, and then brings those dates forward into the current year.
//Adjust Year
DATE(DATEADD(‘year’,
DATEDIFF(‘year’, [Date], TODAY())
, [Date]))
//Adjust DOW
+ DATEPART(‘weekday’, DATETRUNC(‘year’, [Date]) )
– DATEPART(‘weekday’, DATETRUNC(‘year’, TODAY()) )
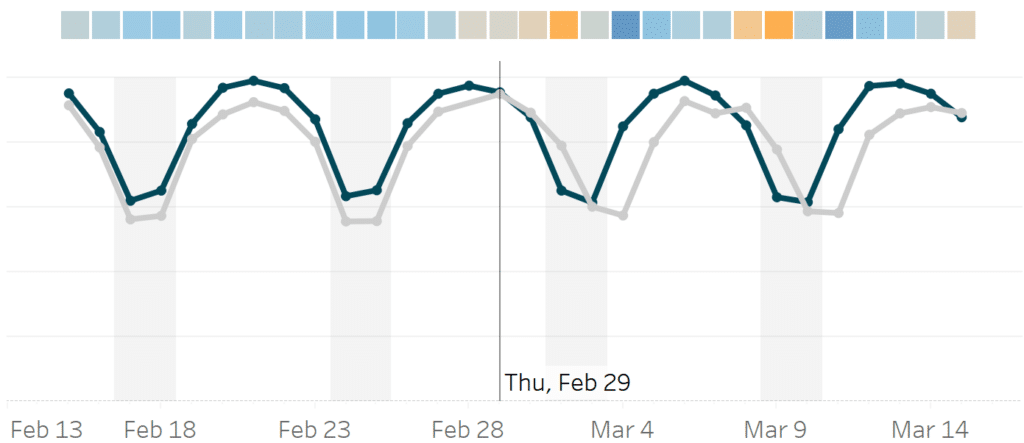
This dynamic calculation avoids hardcoding and works for any past year, but fails to address leap year in Tableau. After February 29th, the weekdays become misaligned. In this example, I plot attendance with a weekly pattern that is significantly higher on weekdays, peaking on Wednesdays. This plot focuses on February 15 through March 15, with historical records adjusted to align weekdays. Here, February 15, 2024, is compared to February 16, 2023, because both are Thursdays. When I use a Year + DOW (Day of Week) adjustment, Wednesday, March 1st, gets paired with Thursday, February 29th, and the weekdays of each subsequent date becomes unaligned! This causes a new seasonality in the YOY comparison.
How to Equalize Year Over Year Dates on One Axis in Tableau
Instead, we can use the Date Part ‘dayofyear’ to avoid this issue. My calculation finds the first day of the current year, finds the Day of Year value for the original date value, and then adds the two together. Then we subtract one because January 1st is Day 1 of the year not Day 0. Then it adjusts for day of week by comparing the weekdays for January 1st of the current year versus the year of the original date.
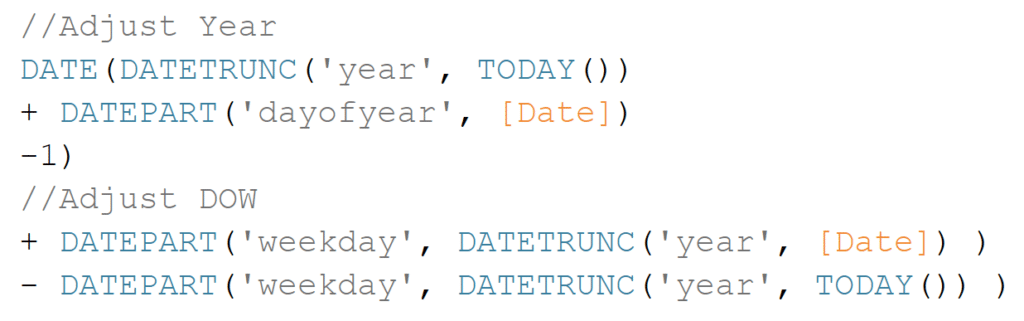
//Adjust Year
DATE(DATETRUNC(‘year’, TODAY())
+ DATEPART(‘dayofyear’, [Date])
-1)
//Adjust DOW
+ DATEPART(‘weekday’, DATETRUNC(‘year’, [Date]) )
– DATEPART(‘weekday’, DATETRUNC(‘year’, TODAY()) )
![]()
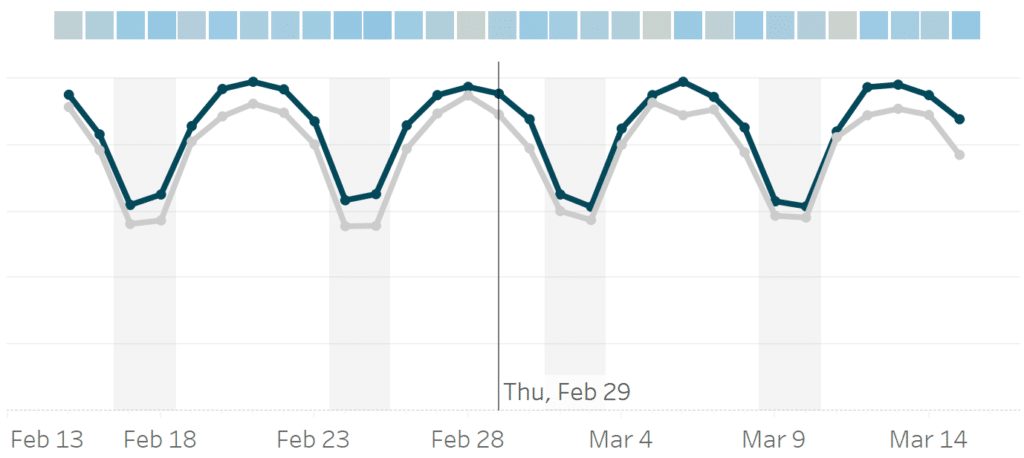
When we apply this calculation to the plot, we can see that Wednesday, March 1st, gets paired with Wednesday, February 28th, and the weekday values after February 29th remain in alignment.
Good luck this February! I hope these strategies help keep your reports accurate this leap year.
Thanks for reading,
Felicia

Written By
Felicia Styer

Peer Review
Dan Bunker
Manager, Decision Engineering
Related Content

Felicia Styer
Three strategies to handle Leap Year in Tableau Struggling to explain, control, or align data in Tableau because of Leap…
How to Default to the Most Recent Dynamic Max Date in Tableau
I recently worked on a dashboard with two main filters – Date and Team. The view focused on a single…

Ryan Sleeper
Automatically Compare the Last Two Partial Weeks or Months Ryan shares the three calculated fields required to automatically compare the…